Physical Address
304 North Cardinal St.
Dorchester Center, MA 02124
Physical Address
304 North Cardinal St.
Dorchester Center, MA 02124

Dark pools are private exchanges where institutional investors can trade large blocks of securities without revealing their intentions to the public market in real-time. These alternative trading systems were created to address a fundamental challenge for large investors: how to execute significant positions without causing adverse price movements through information leakage.
Institutions utilize dark pools primarily to:
With approximately 40% of all U.S. equity trading volume now occurring in dark pools, understanding how to properly interpret this activity has become essential for traders of all sizes.
One of the most persistent misconceptions I encounter with clients is the belief that dark pool prints immediately reveal directional intent. Many traders see these large block trades and instinctively want to jump in right away, assuming they can determine whether the print represents buying or selling pressure. This rush to action often leads to costly mistakes.
What most traders fail to understand is that institutional dark pool activity often creates what I call a “splash effect” – an initial price movement in the opposite direction of the eventual sustained move. This counterintuitive price action confounds traders who make instant directional bets based solely on print data.
Consider SPDR Gold Trust (GLD) as a case study. When examining the largest dark pool prints over the past year, we observed a significant print on December 11, 2024. Following this print, the price actually moved down approximately $10 before reversing course and moving upward through the print level around January 16th. This pattern demonstrates how gold – and many other assets – takes considerable time to digest dark pool activity.
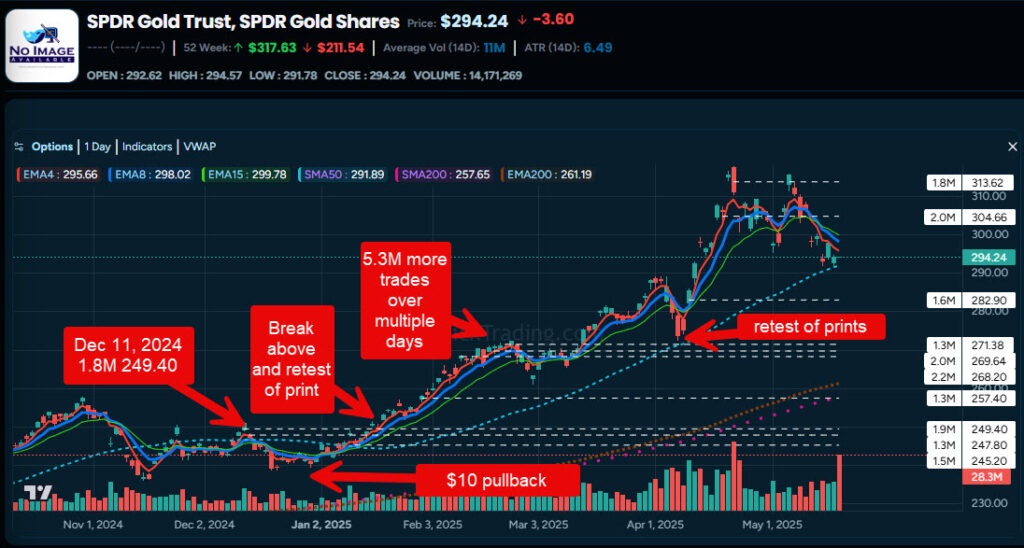
Another critical insight: the larger the dark pool trade, the larger the eventual move – but counterintuitively, the longer it typically takes for that move to manifest. When examining large block trades (those representing 4.7M shares or more in our GLD example), we observed:
By the time GLD reached its peak around $314, patient traders who understood this relationship captured approximately $65 profit per share – but only if they waited for the true directional move to reveal itself.
Beyond directional signals, dark pool prints themselves often create significant support and resistance levels. These price zones, where large institutional trades have occurred, frequently become important technical levels that influence future price action. Traders who rush to judgment miss this valuable context.
Another common error is attempting to determine buying or selling pressure based on the National Best Bid and Offer (NBBO) at the time of the print. For clarity, the NBBO represents the best available bid and ask prices across all exchanges at the moment a trade is finalized – essentially a snapshot of market conditions when the transaction is recorded.
However, using this snapshot to determine directional intent is fundamentally flawed because:
Rather than making split-second directional assumptions based on dark pool prints, successful traders have adjusted their approach by:
A critical factor often overlooked is the fundamental mismatch between institutional and retail time horizons. Institutions establishing positions through dark pools are typically:
This creates both challenges and opportunities for different types of traders:
For short-term traders (intraday, day, or swing):
For long-term investors:
The traders who have corrected this misconception have transformed their results. By respecting the time delay between institutional dark pool activity and the resulting price moves, they avoid getting “splashed” by the initial counter-move. Instead, they position themselves for the larger, more sustained trend that typically follows.
This shift in understanding has turned dark pool data from a misleading indicator into a powerful edge – but only for those with the patience and perspective to use it correctly.
The next time you spot a significant dark pool print, resist the urge to immediately determine direction. Instead, recognize that you’re witnessing the beginning of a process that may take days or weeks to unfold. The largest profits often go to those who understand that in institutional trading, time is an essential component of the equation.
To gain an edge in tracking and analyzing dark pool activity, visit MobyTickTrading.com – our comprehensive dark pool application that monitors institutional trades across more than 10,000 stocks. Our platform allows traders to quickly identify the most actionable setups with minimal effort, filtering through the noise to find the high-probability trades where institutional money is flowing. With proper understanding of how dark pools function, this institutional insight can become one of your most valuable trading tools.