Physical Address
304 North Cardinal St.
Dorchester Center, MA 02124
Physical Address
304 North Cardinal St.
Dorchester Center, MA 02124

Institutional dark pool levels, trade setups, and deep dives for AAPL, SMH, and MSFT. SMH recorded its largest single dark pool trade in MobyTick's 6-year database: 4.1M shares ($1.67B). Plus: Understanding Profit Taking in Dark Pools.
Week of February 16–20, 2026
Follow the Money. See What Others Can’t.
Every week, we publish institutional dark pool levels with bullish and bearish targets. Here’s how last week’s callouts performed against the actual weekly candle for Feb 10-14.
✅ 6 of 9 bullish triggers activated — 11 targets hit
✅ 5 of 9 bearish triggers activated — 8 targets hit
⭐ MSFT was the star — crushed 5 of 6 bullish targets, reaching $423.68. 💥 AAPL triggered both sides — rallied to $280 then collapsed to $255, a $25 range (-8%). Near misses: SPY bullish missed by $0.36, INTC missed by $0.03.
Bearish was the money this week — every single stock closed red. When the levels hit, the targets followed.
Stocks posted their worst week of 2026. The S&P 500 dropped 1.4%, the Dow Jones fell 1.2% — after hitting record closing highs Monday and Tuesday above 50,000 — and the Nasdaq Composite slid 2.1% (Investopedia, FRED).
The sell-off was driven by a continuation of the “SaaSpocalypse” — a broad rotation out of software and AI-adjacent names that began the prior week — compounded by a surprisingly strong January jobs report on Wednesday. The BLS (delayed from its usual Friday release) reported 130,000 jobs added, near expectations, but the unemployment rate dipped to 4.0% and average hourly earnings rose 0.5% month-over-month — the hottest wage growth since March 2024. Markets immediately repriced rate-cut expectations, sending the 10-year yield above 4.55%.
What the dark pools tell us: Institutions were active all week. MobyTick tracked over 1,800 block trades totaling $103+ billion across 4 trading days (400,000+ share minimum, excluding opening and closing auctions — MobyTick Dark Pool API). Thursday Feb 12 was the heaviest single day with 376 aggregated trades worth $27.2B.
The headline print: SMH recorded a single 4.1 million share trade at $408.54 — a $1.675 billion block — the largest single dark pool trade on SMH in MobyTick’s entire 6-year database (MobyTick Historical Prints API, Jan 2020–present). The previous record was 3.18M shares in February 2022.
Other notable institutional activity this week:
The institutions are positioning. These levels become our roadmap for the week ahead.
Data sourced from: MobyTick Dark Pool API (mobyticktrading.com), Bureau of Labor Statistics (bls.gov), Federal Reserve Economic Data (fred.stlouisfed.org), Investopedia.
Dark pools sound like insidious beasts. But these big players need to buy or sell from someone — they can’t use a limit order for 3 million shares. This is why trades happen “off exchange.” Our job: identify these levels and use them as institutional support and resistance.
Remember: Institutions are not scalpers. They accumulate and distribute over time.
⚠️ Note: This is a 4-day trading week — markets are closed Monday, February 16th for Presidents’ Day.
Now onto our trade setups for the week!
Based on institutional dark pool levels from the past 30 days. These are NOT recommendations — they are institutional-grade support and resistance levels for your watchlist.
How to use these levels: Wait for a closing confirmation in the last 15 minutes of the trading day. If price closes above the “Bullish Above” level, the bullish targets are in play. If price closes below the “Bearish Below” level, the bearish targets are active. Do NOT chase entries mid-day — let the close confirm.
📈 BULLISH TARGETS
[Scorecard table available in the full newsletter — subscribe free to get the complete table with all entries and targets]
📉 BEARISH TARGETS
[Scorecard table available in the full newsletter — subscribe free to get the complete table with all entries and targets]
A closer look at three stocks with the most compelling institutional stories this week.
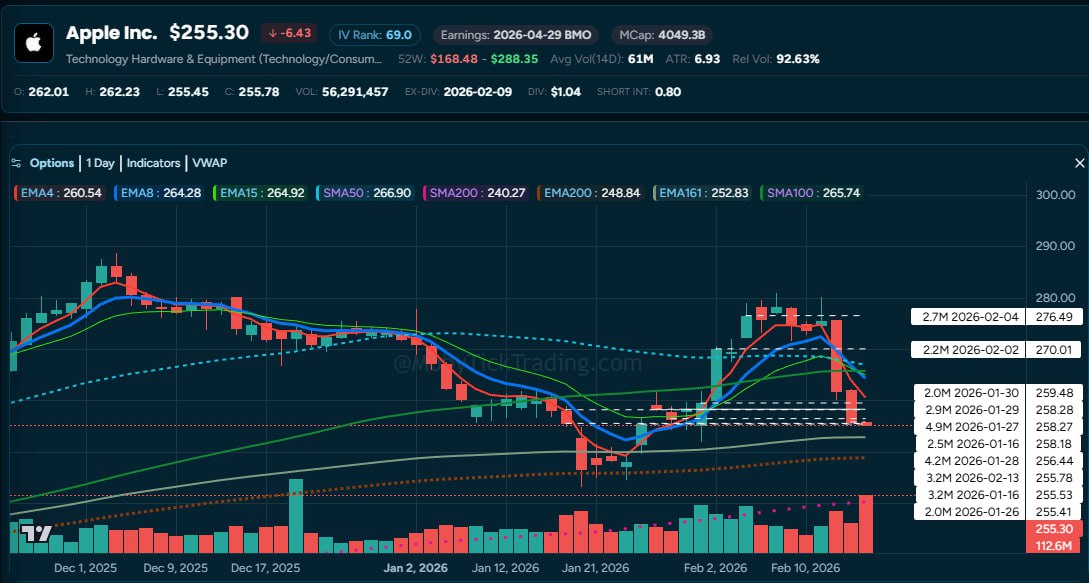
Apple had its worst week since April 2025, losing $202 billion in market cap on Wednesday alone amid FTC scrutiny, AI Siri delays, and weakening China demand from Huawei competition.
The chart tells the story. Look at the cluster of massive prints on the right side — institutions have been building aggressively in the $255-259 zone over the past 30 days. The largest: 4.9M shares at $258.27 (Jan 27), 4.2M shares at $256.44 (Jan 28), and 3.2M shares at $255.53 (Jan 16). This is mega accumulation.
Current price ($255.78) is sitting right on top of this institutional floor. Friday’s 3.2M share print at $255.78 shows institutions are STILL active at this level. The bounce earlier this month to $270-276 (2.2M at $270.01, 2.7M at $276.49) represents the upside target — and a zone where profit taking occurred.
Key Institutional Levels:
Want to see these levels in real-time for any stock? → mobyticktrading.com/pricing
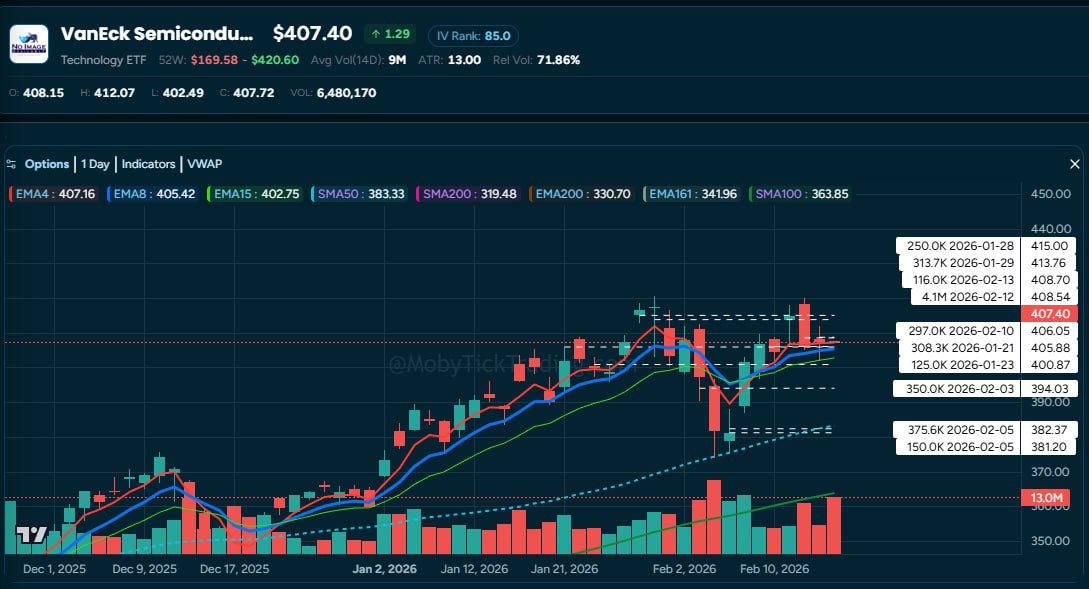
This week, SMH recorded its largest single dark pool trade in MobyTick’s entire 6-year database: 4.1 million shares at $408.54 on February 12th — a single transaction worth $1.67 BILLION.
To put that in perspective: this happened on a day when the Dow shed 670 points and tech was getting hammered by AI jitters. While retail traders were selling, one institution placed a bet on semiconductors worth more than most companies’ entire market cap. That’s conviction.
The chart shows the $408.54 level clearly — it’s the dominant print dwarfing everything else on the right side. The only other significant print in 30 days was 541K shares at $396.27 (Jan 15). Current price ($407.72) is essentially right at the institutional level, with support from the $382-394 zone below.
Key Institutional Levels:
Track record-breaking dark pool trades as they happen → mobyticktrading.com/pricing
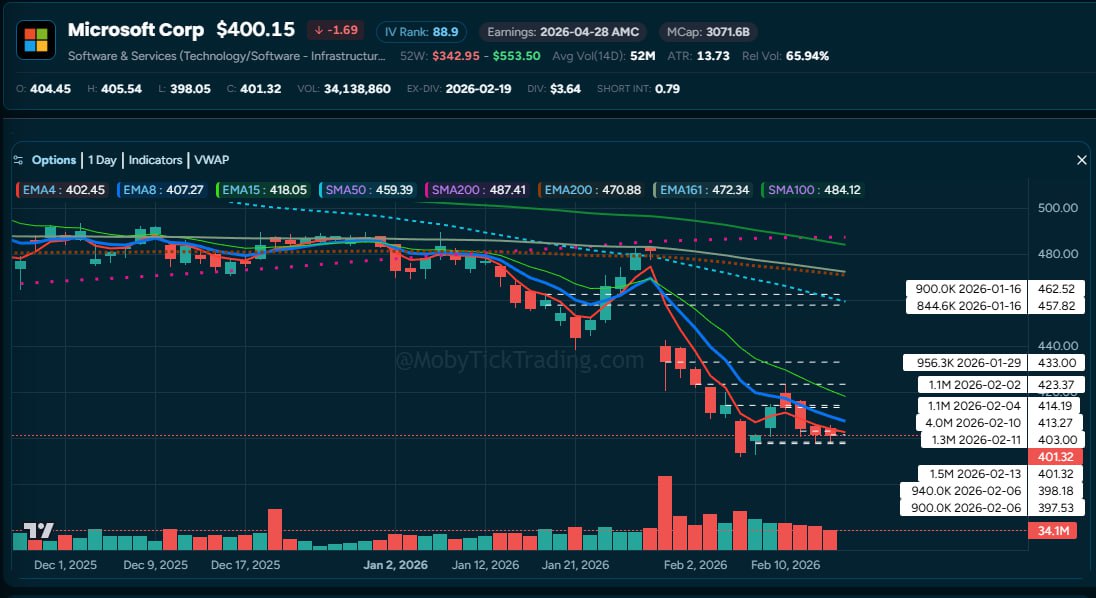
Microsoft was last week’s scorecard star (5 of 6 bullish targets hit to $423.68). This week it finished essentially flat, but the chart reveals a textbook example of profit taking — our educational topic this week.
Look at the print levels on the chart from top to bottom. In mid-January, institutions printed 900K shares at $462.52 and 845K at $457.82. Then 956K at $433 (Jan 29) and 1.1M at $423.37 (Feb 2). As the stock declined, fresh prints appeared: 1.1M at $414.19 (Feb 4), and then the week’s biggest — 4.0M shares at $413.27 (Feb 10). That $413 level is now the single most active institutional level on the chart.
The story continues lower: 1.3M at $403 (Feb 11), 1.5M at $401.32 (Feb 13), and 940K + 900K at $398.18 and $397.53 (Feb 6). You can literally watch institutions stepping down through price levels over the past month — some taking profits at highs, others accumulating at each new support.
Key Institutional Levels:
See institutional levels update in real-time → mobyticktrading.com/pricing
This week’s topic is one of the most misunderstood aspects of dark pool trading: profit taking. Most retail traders see a large dark pool print and assume “someone’s buying!” The reality is more nuanced.
Institutions don’t buy and sell in one shot. They build positions over weeks or months at lower prices (accumulation), ride the move, then systematically sell into strength at higher prices. This selling happens in dark pools because dumping millions of shares on the open market would crash the price before they could exit.
Look at WHERE prints cluster relative to recent price action:
Look at the MSFT chart above. In mid-January, institutions printed at $457-462. By late January, prints appeared at $433. Then $423. Then $413-414. Then $401-403. Then $397-398.
You can literally watch the institutional price ladder step down over a month. The prints at $457-462 and $433 were profit taking from earlier positions. The massive 4.0M share print at $413.27 and the recent prints at $401-403 are fresh accumulation at the new range.
The takeaway: those top-of-range prints weren’t bullish signals — they were exits. The bottom-of-range prints are where institutions are building new positions.
Apple shows the same pattern. Institutions built 34+ million shares in the $255-259 zone over a month. When the stock bounced to $270-276, prints appeared at those highs — classic profit taking. When AAPL crashed back to $255, another 3.2M shares printed at $255.78 — this is testing the accumulation zone. If it holds, the bounce trade is on.
Institutions are rarely wrong. When you see a large print at a high price after a run-up, assume profit taking. When you see prints at lows during a pullback, assume accumulation.
How this applies to your trading:
The dark pool shows you what institutions are DOING, not what they’re saying. Follow the money — especially when it’s leaving.
This weekly report is completely free. Get institutional dark pool levels, trade setups, and educational content every Sunday before the market opens.
MobyTick Trading provides institutional-grade dark pool and block trade intelligence to retail traders. Charts show you the past — MobyTick shows you what institutions are doing RIGHT NOW.
🔥 Start your 7-day free trial → mobyticktrading.com/pricing
Disclaimer: This newsletter is for educational and informational purposes only. It does not constitute financial advice, investment recommendations, or a solicitation to buy or sell any securities. Dark pool data represents historical trades and does not predict future price movements. Always do your own research before making trading decisions.