Physical Address
304 North Cardinal St.
Dorchester Center, MA 02124
Physical Address
304 North Cardinal St.
Dorchester Center, MA 02124

SPY's $679 institutional floor broke. IOT breakout pattern revealed. 13 tickers with dark pool levels, trade setups, and a new Breakout Watch section. Issue #4 of the MobyTick Weekly Dark Pool Report.
Follow the Money. See What Others Can’t.
Every week, we publish institutional dark pool levels with bullish and bearish targets. Here’s how last week’s callouts performed against the actual weekly candle for March 2–6, 2026.
✅ 13 of 18 bullish triggers activated | ✅ 10 of 18 bearish triggers activated
A volatile, red week across the board — Iran conflict, oil at $90, and a shocking jobs miss. But the institutional levels delivered. When triggers activated, they hit targets.
| Ticker | Bull Above | Wk High | Bull Result | Bear Below | Wk Low | Bear Result |
|---|---|---|---|---|---|---|
| SPY | $697.50 | $688.62 | ❌ No Entry | $679 | $669.66 | ✅ T1-T5 ⭐ |
| QQQ | $609.50 | $612.88 | ✅ T1 | $600 | $591.87 | ✅ T1-T3 |
| IWM | $266.25 | $264.28 | ❌ No Entry | $259 | $249.94 | ✅ T1-T5 ⭐ |
| NVDA | $180 | $184.70 | ✅ T1-T2 | $174 | $174.64 | ❌ No Entry |
| AAPL | $272.50 | $266.53 | ❌ No Entry | $259 | $254.37 | ✅ T1-T3 |
| MSFT | $403 | $413.05 | ✅ T1-T4 ⭐ | $384 | $390.63 | ❌ No Entry |
| GOOGL | $317.50 | $308.49 | ❌ No Entry | $298 | $295.18 | ✅ T1 |
| AMZN | $211.25 | $220.47 | ✅ T1-T4 ⭐ | $205 | $202.48 | ✅ T1 |
| META | $665 | $672.77 | ✅ T1 | $637 | $634.50 | ✅ T1 |
| NFLX | $100 | $100.19 | ✅ 0 targets | $90 | $95.20 | ❌ No Entry |
| UNH | $295 | $295.31 | ✅ 0 targets | $280 | $283.05 | ❌ No Entry |
| ORCL | $155 | $159.19 | ✅ T1-T2 | $142.50 | $141.18 | ✅ 0 targets |
| NVO | $41 | $39.12 | ❌ No Entry | $37 | $35.85 | ✅ T1 |
| WMT | $128.25 | $128.75 | ✅ 0 targets | $121 | $121.62 | ❌ No Entry |
| RTX | $205 | $214.50 | ✅ T1-T4 ⭐ | $196 | $200.10 | ❌ No Entry |
| CVX | $188 | $192.41 | ✅ T1-T2 | $180 | $184.15 | ❌ No Entry |
| XLE | $56.25 | $57.88 | ✅ T1 | $54 | $55.33 | ❌ No Entry |
| MRVL | $82.50 | $93.40 | ✅ T1-T5 ⭐⭐ | $77 | $75.24 | ✅ T1 |
⭐ Star Performers:
Note: If stocks didn’t trigger the previous week, it doesn’t mean the trade is off. There is massive institutional conviction and these levels will move. Keep them on your radar.
Weekly Dark Pool Stats (Mar 2–6): 52,000+ block trades (50K+ shares) | $351B+ total volume | Most active: NVDA ($4.0B across 24 trades)
War, oil, and a jobs shock. This was the week the market broke down — and the dark pool data told the story before the headlines landed.
The numbers: The S&P 500 fell 2.0% for the week. The Dow dropped 3.0% — its worst week since April 2025. The Nasdaq Composite slipped 1.2%. Small caps (IWM) got crushed, down 4.9%. Stocks are now negative for 2026.
Weekly index performance (Mar 2–6):
The Iran conflict dominated the week. U.S. and Israeli strikes on Iran’s nuclear facilities began Saturday, and the Strait of Hormuz — through which 20% of global oil passes — saw tanker traffic essentially halt. West Texas Intermediate crude surged 35% to $90.65/barrel, its biggest weekly gain since 1983. Maersk suspended shipping services through the region Friday. Gold hit $5,165/oz. The 10-year Treasury yield jumped from 3.95% to 4.15%.
Then Friday’s jobs report: the U.S. economy shed 92,000 jobs in February (consensus expected +50,000). Unemployment ticked up to 4.4%. “A tricky, stagflationary mix of risks,” JP Morgan’s Elyse Ausenbaugh called it.
The dark pool story: SPY’s institutional floor at $679.10-$679.11 — 20 million shares printed across December 16-17 in late-reported trades totaling $13.6 billion — finally broke this week. Price fell through and tested the deeper October-November institutional zone at $669-$672, where 56 million shares of prints dating back to October 2025 form the next line of defense. Two new late prints appeared: 5.7M shares at $685.52 (Thursday) and 5.1M at $681.74 (Friday).
Below the current zone, the next major institutional levels are the September 2025 prints: 6.5M shares at $663.21, 6.5M at $661.78, 6.6M at $659.23, and 5.5M at $657.76.
Sector performance:
Notable: Suncor Energy (SU) saw $780M in dark pool activity across 8 trades this week, including three near-identical 3.25M share prints within 60 seconds on March 3 at $57.12 each. However, SU went ex-dividend March 4 ($0.60/share) — these prints were likely positioning to collect the dividend.
💡 What Are Dark Pools? Dark pools sound like insidious beasts. But these big players need to buy or sell from someone — they can’t use a limit order for 3 million shares. This is why trades happen “off exchange.” Our job: identify these levels and use them as institutional support and resistance. Remember: Institutions are not scalpers. They accumulate and distribute over time.
Sources: MobyTick API, Investopedia, Bureau of Labor Statistics, CNN Business, Reuters
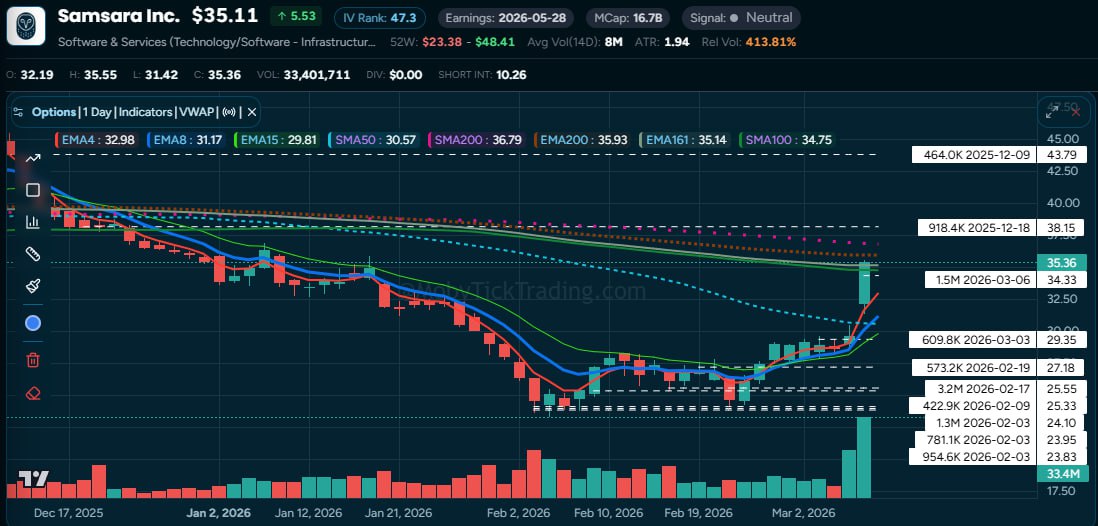
When IOT crashed from $43.79 in December to the low $20s, institutions stepped in hard. On February 3 alone, three prints landed at $23.83, $23.95, and $24.10 — over 3 million shares as the stock bottomed. Then on February 17, the largest print: 3.2 million shares at $25.55. These prints established the $23.83-$25.55 zone as the institutional floor.
What happened next was textbook: price tested these levels, bounced, and with each retest the prints held as support. Volume began increasing. By early March, prints appeared above the zone — 609.8K at $29.35 on March 3 — and on Friday March 6, IOT gapped from $29.58 to open at $32.19 and ran to $35.55, closing at $35.36 near the top of the candle on 33.4 million shares (5x average volume). A 1.5 million share print at $34.33 ($51M) on Friday confirmed institutions establishing positions at the new level.
The lesson: When you see institutions printing at specific levels during a crash, and those levels hold through retests with increasing volume — that’s accumulation. The data was on the tape a month before the breakout.
Based on institutional dark pool levels from the past 30 days. These are NOT recommendations — they are institutional-grade support and resistance levels for your watchlist.
How to use these levels: Wait for a closing confirmation in the last 15 minutes of the trading day. If price closes above the “Bullish Above” level, the bullish targets are in play. If price closes below the “Bearish Below” level, the bearish targets are active. Do NOT chase entries mid-day — let the close confirm the direction.
⚠️ BEARISH MARKET CAUTION: When the broader market is trending down, traders tend to sell into rallies. Be careful with swing trades — consider taking profits earlier than you normally would.
| Ticker | Price | Above | T1 | T2 | T3 | T4 | T5 |
|---|---|---|---|---|---|---|---|
| SPY | $672.38 | $680 | $681.25 | $682.50 | $685 | $687.50 | $689 |
| QQQ | $599.75 | $610 | $611.25 | $612.50 | $615 | $616.50 | $620 |
| IWM | $250.89 | $255 | $256.25 | $257.50 | $259 | $260 | $262.50 |
| NVDA | $177.82 | $180 | $181.50 | $183 | $185 | $186 | $187.50 |
| ORCL | $152.96 | $160 | $162.50 | $165 | $170 | $172.50 | $175 |
| RTX | $209.76 | $215 | $216.25 | $217.50 | $220 | $225 | $230 |
| IOT | $35.36 | $36 | $36.50 | $37 | $38 | $39 | $40 |
| PANW | $165.05 | $167.50 | $170 | $172.50 | $175 | $180 | $182 |
| DDOG | $125.75 | $127.50 | $130 | $132.50 | $135 | $137.50 | $140 |
| WDAY | $151.04 | $154 | $156.25 | $157.50 | $160 | $165 | $170 |
| CRM | $202.11 | $201.25 | $202.50 | $205 | $207.50 | $210 | $211.50 |
| PINS | $20.01 | $20.50 | $21 | $22 | $23.50 | $25 | |
| NOW | $124.34 | $125 | $126.25 | $127.50 | $130 | $135 | $137.50 |
| Ticker | Price | Below | T1 | T2 | T3 | T4 | T5 |
|---|---|---|---|---|---|---|---|
| SPY | $672.38 | $670 | $667.50 | $665 | $662.50 | $660 | |
| QQQ | $599.75 | $597.50 | $595 | $592.50 | $590 | $585 | $580 |
| IWM | $250.89 | $250 | $247.50 | $245 | $243 | $240 | $235 |
| NVDA | $177.82 | $177 | $176 | $172 | $172.50 | $170 | $167.50 |
| ORCL | $152.96 | $140 | $137.50 | $135 | $132.50 | $130 | $127.50 |
| RTX | $209.76 | $209 | $207.50 | $205 | $204 | $202 | $200 |
| IOT | $35.36 | $33 | $32 | $31 | $30 | $29.50 | $29 |
| PANW | $165.05 | $160 | $159 | $157.50 | $155 | $152.50 | $150 |
| DDOG | $125.75 | $120 | $119 | $118 | $117.50 | $115 | $113 |
| WDAY | $151.04 | $140 | $137.50 | $135 | $133 | $130 | $127.50 |
| CRM | $202.11 | $189 | $187.50 | $185 | $182.50 | $185 | $175 |
| PINS | $20.01 | $18.50 | $18 | $17 | $16.75 | $16 | $15 |
| NOW | $124.34 | $114 | $113 | $112 | $110 | $108 | $107 |
Current: $672.38 | Week: –2.04% | IV Rank: 100 | Rel Vol: 120.88%
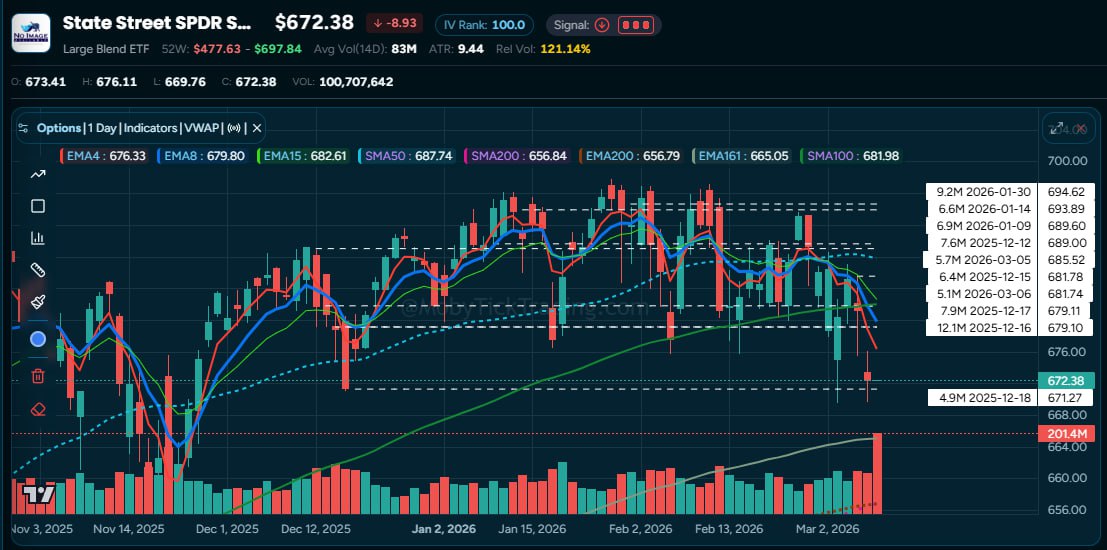
SPY’s chart this week tells the story of the entire market. The 20 million share institutional wall at $679.10-$679.11 — built across December 16-17 in late-reported prints totaling $13.6 billion — had been the floor since December. This week, it broke.
Price fell through $679 on Wednesday and continued to $669.66 on Friday’s jobs report, testing the deeper institutional zone at $669-$672 where 56 million shares of prints dating back to October 2025 form the next line of defense.
Key Institutional Levels (1-year largest prints):
Below current price — the next major support:
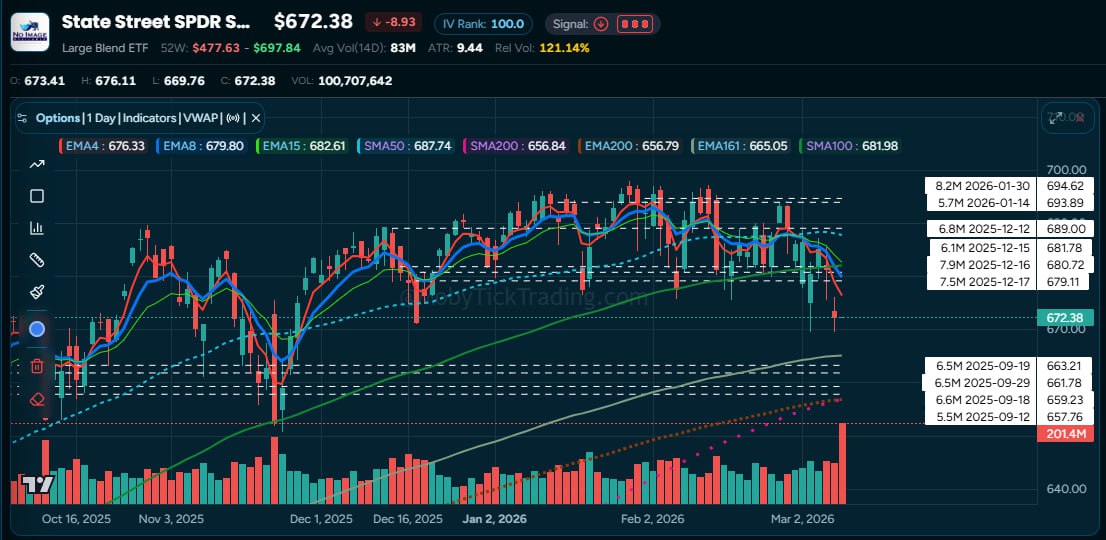
A close above $680 activates bullish targets. Below $670, the September support at $657-$663 comes into play.
Current: $599.75 | Week: –1.37%
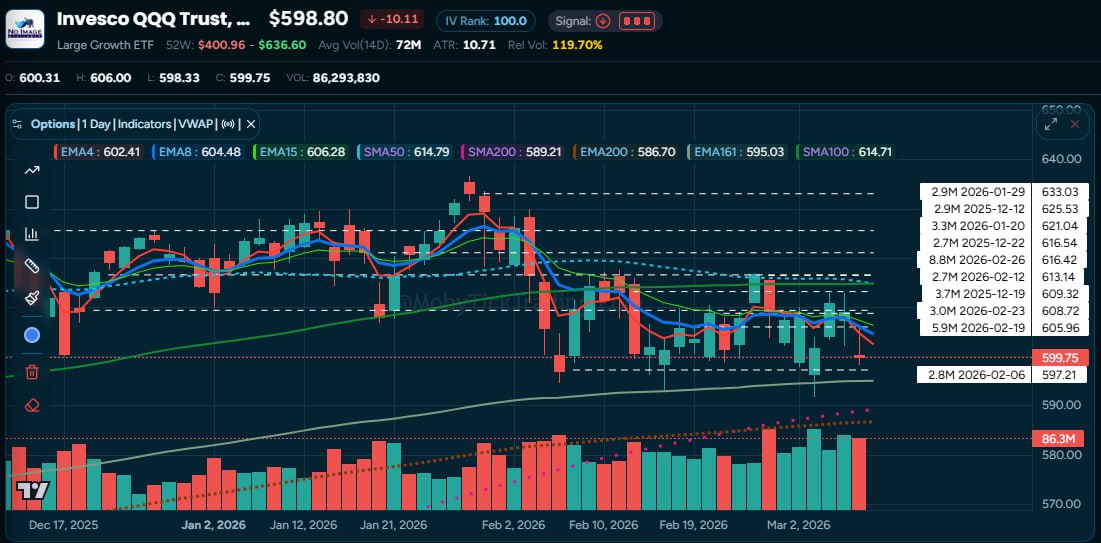
📈 Bullish Above: $610 | 📉 Bearish Below: $597.50
QQQ held up better than the broader market. Dark pool prints clustered in the $601-$610 range. The bearish trigger at $597.50 sits just below Friday’s low of $598.33.
Current: $250.89 | Week: –4.90% — Worst major index
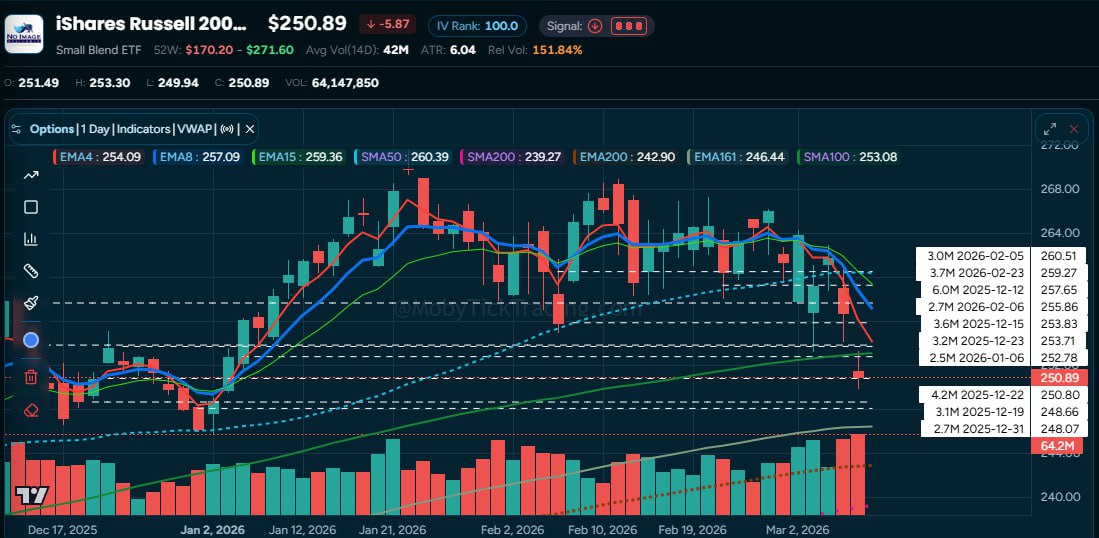
📈 Bullish Above: $255 | 📉 Bearish Below: $250
Small caps got hammered. Dark pool prints show activity at $250.05 (right at current price). The $250 bearish trigger is critical.
This week produced a textbook example of how dark pool data can reveal institutional accumulation before a breakout happens. We’re calling it the “IOT Pattern” — after Samsara (IOT), which demonstrated it perfectly this week.
Institutions can’t hide size. When a fund needs to accumulate millions of shares, those prints show up in the dark pool data — often weeks before the price moves. The trick is knowing what to look for and how the sequence unfolds.
📈 Bullish Above: $167.50 | 📉 Bearish Below: $160
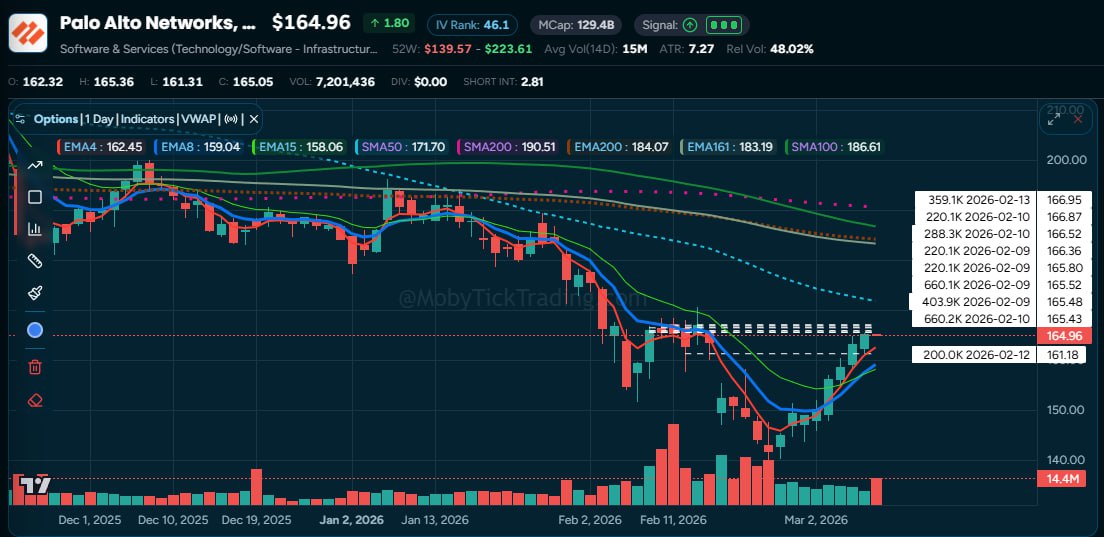
PANW is pressing into a dense institutional cluster from February 9-13: roughly 3 million shares packed into $165.43-$166.95 across eight prints. This week, price stair-stepped from $150 → $157 → $163 → $165.05 with clean higher closes every single day.
📈 Bullish Above: $127.50 | 📉 Bearish Below: $120
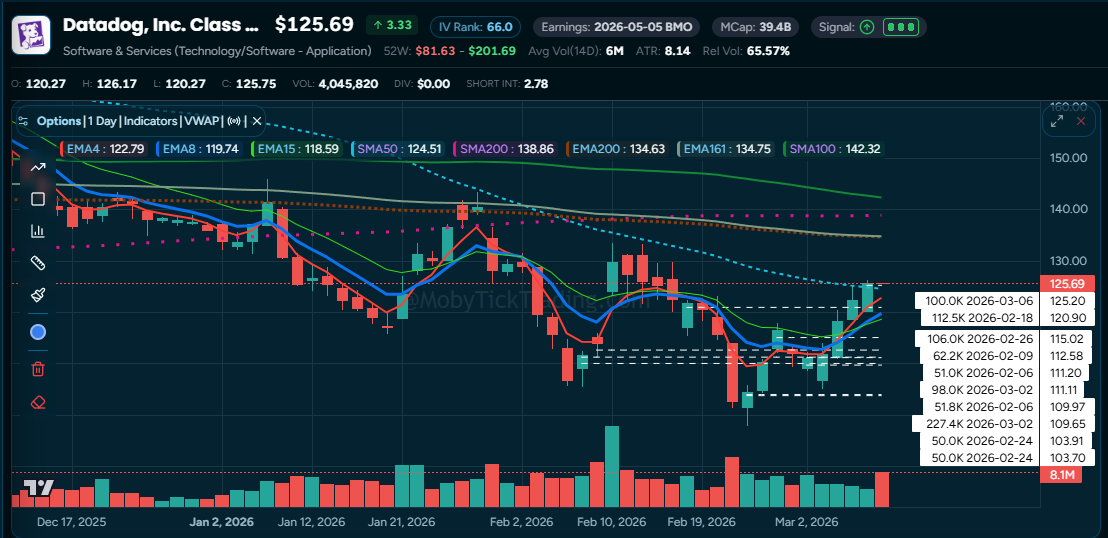
DDOG built a base at $103-$112 through February. This week, price broke above the entire cluster to $125.75. A new 100K print at $125.20 on Friday confirms institutions at the breakout level.
📈 Bullish Above: $154 | 📉 Bearish Below: $140
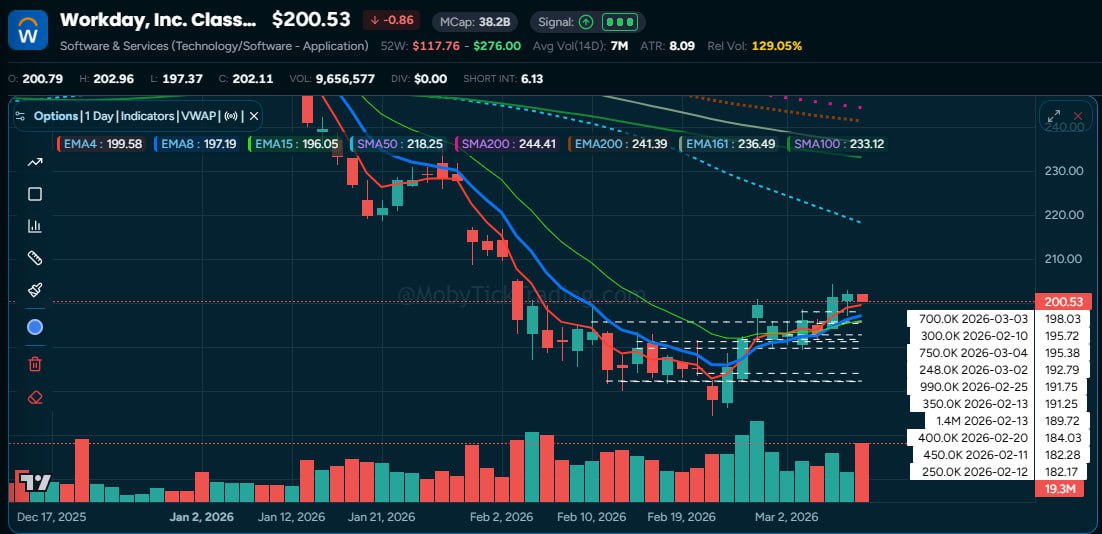
WDAY shows institutional prints stair-stepping higher through the week. The $154 bullish trigger aligns with overhead prints at $153.73-$154 from February 10 (1M+ shares).
📈 Bullish Above: $201.25 | 📉 Bearish Below: $189
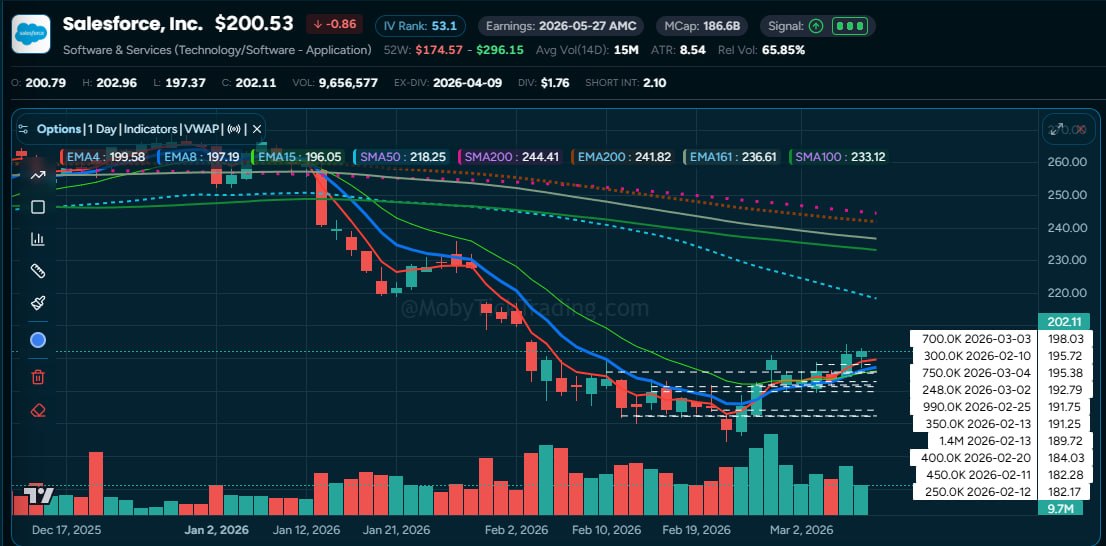
CRM has broken above ALL dark pool prints. The institutional floor at $182-$192 now serves as support. The bullish trigger is already active at $201.25.
📈 Bullish Above: $20.50 | 📉 Bearish Below: $18.50
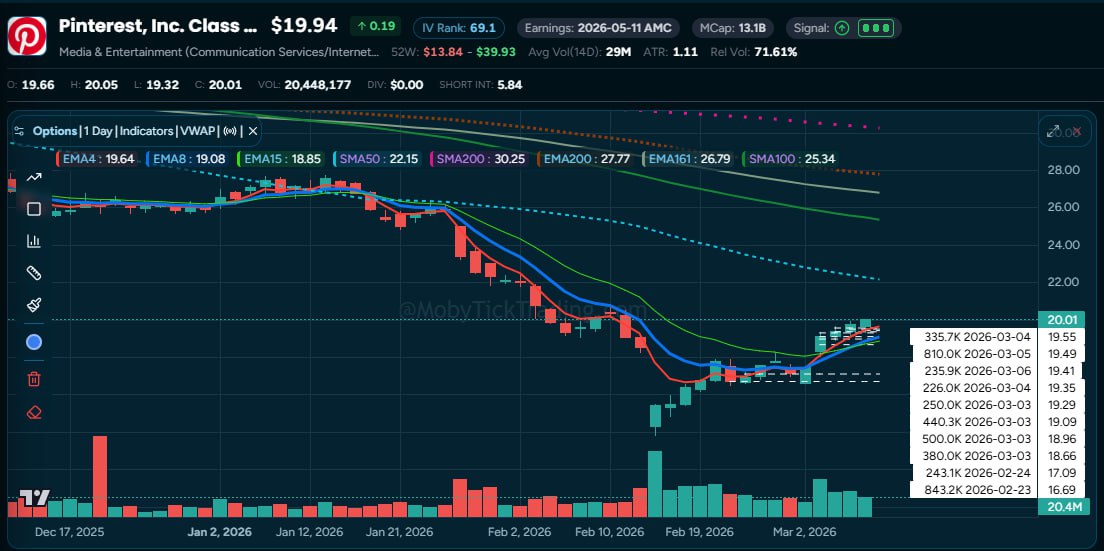
PINS crashed to $16.69 then institutions accumulated. March 3: four prints from $18.66 to $19.29 totaling 1.57M shares on 39M volume. Friday closed $20.01 — above every print.
📈 Bullish Above: $125 | 📉 Bearish Below: $114
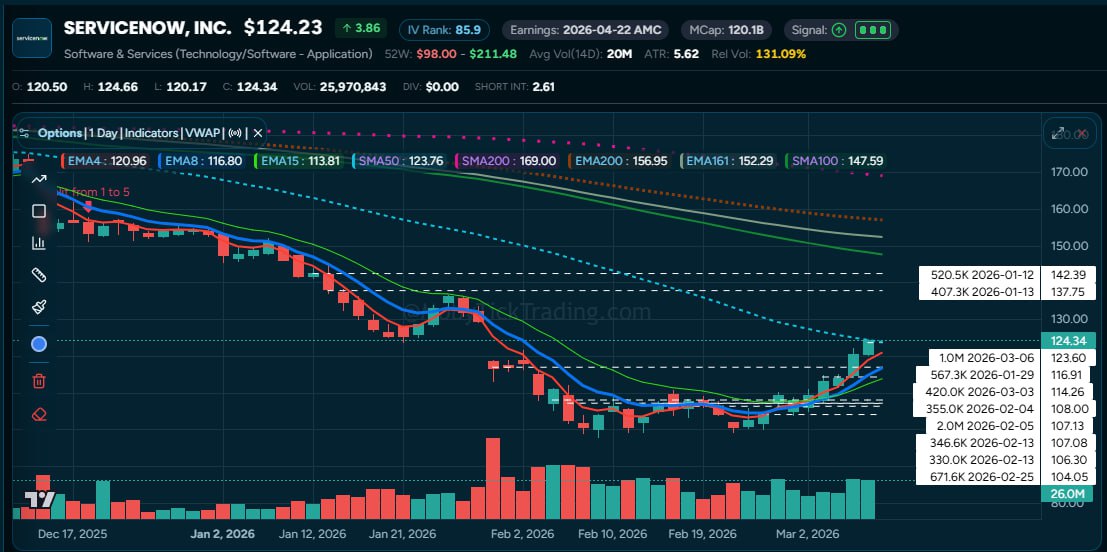
NOW built an accumulation base at $104-$108 with the big print — 2.0M shares at $107.13. This week broke out to $124.34. A 1.0M share print at $123.60 on Friday confirms institutions at the new level.
📈 Bullish Above: $180 | 📉 Bearish Below: $177
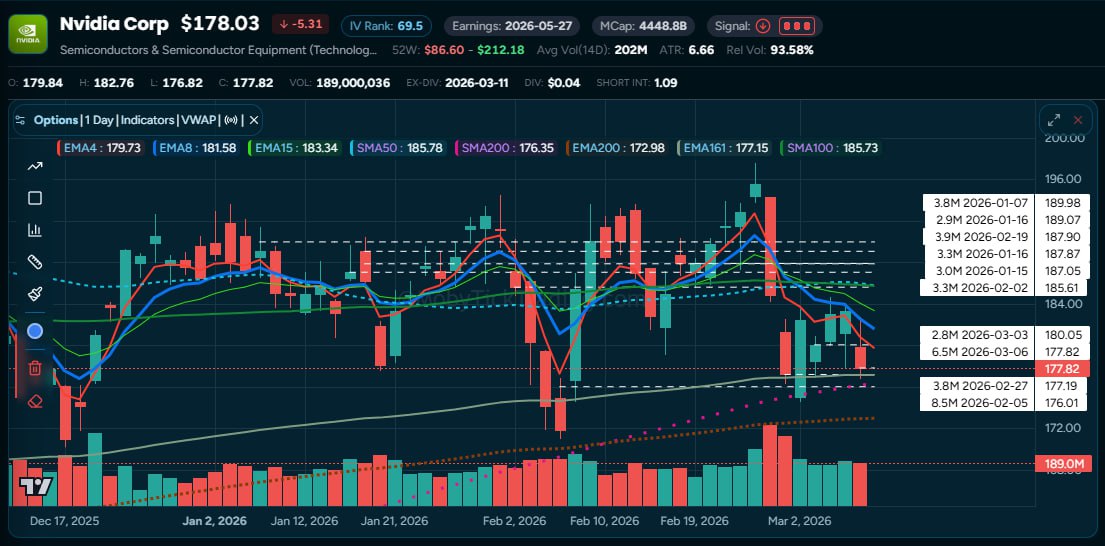
NVDA remains the most active dark pool stock with $4.0B in prints this week. Overhead: ~20M shares of institutional supply between $185-$190. Support floor: 8.5M at $176.01 and this week’s 6.5M at $177.82. Current price is wedged between the floor and ceiling. Ex-dividend March 11.
📈 Bullish Above: $160 | 📉 Bearish Below: $140
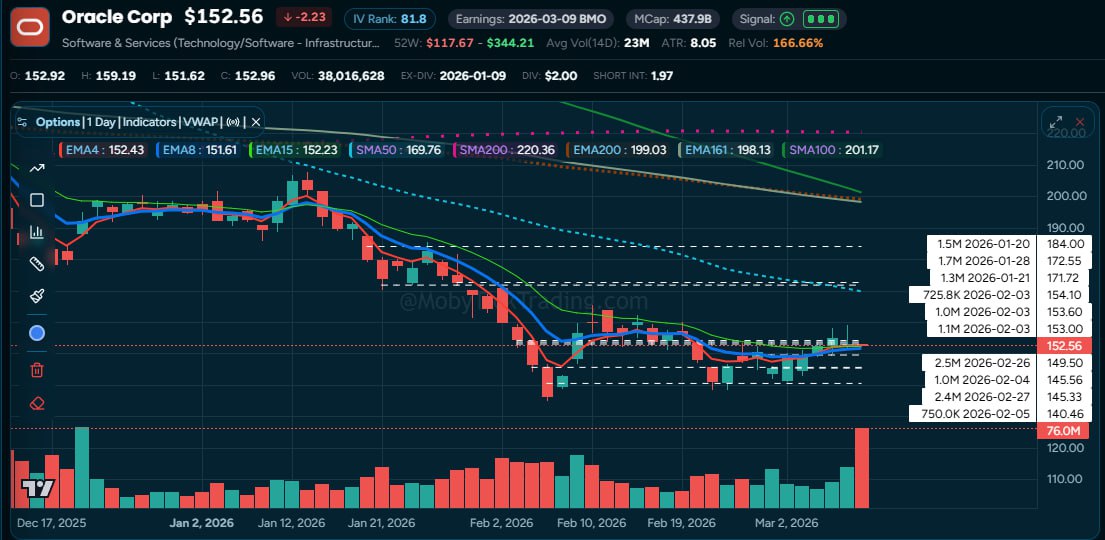
ORCL has $2.51B in institutional positioning (89 prints). Two clear zones: accumulation at $145-$154 and overhead from January at $171-$184. Earnings Monday is the catalyst. IV Rank: 81.8.
📈 Bullish Above: $215 | 📉 Bearish Below: $209
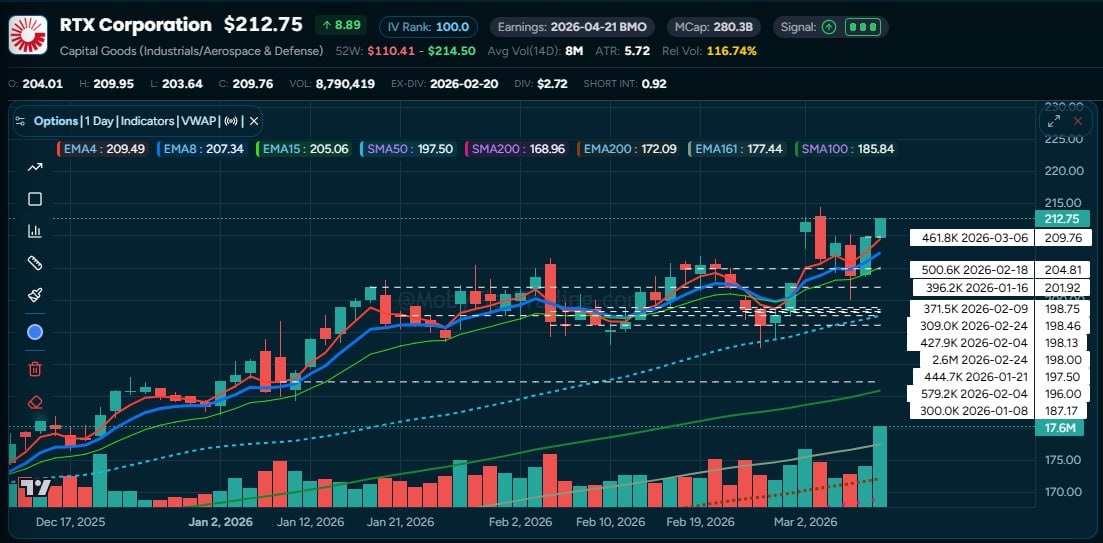
RTX is the best-looking chart — a textbook staircase of institutional prints from $187.17 → $196 → $198 (2.6M) → $201.92 → $204.81 → $209.76. Each print higher than the last, with price following. IV Rank: 100.
Got a ticker you want us to analyze? Reply to this email and we’ll take a look.
This weekly report is completely free. Subscribe at mobyticktrading.com/weekly-report to get institutional dark pool levels, trade setups, and educational content every Sunday before the market opens.
MobyTick Trading provides institutional-grade dark pool and block trade intelligence to retail traders. Charts show you the past — MobyTick shows you what institutions are doing RIGHT NOW.
This newsletter is for educational and informational purposes only. It does not constitute financial advice, investment recommendations, or a solicitation to buy or sell any securities. Dark pool data represents historical trades and does not predict future price movements. Always do your own research and consult with a qualified financial advisor before making investment decisions. Past performance is not indicative of future results.