Physical Address
304 North Cardinal St.
Dorchester Center, MA 02124
Physical Address
304 North Cardinal St.
Dorchester Center, MA 02124

The market is crashing. Retail traders are buying the dip. But without dark pool data showing where institutional money is actually positioned, you're flying blind. Real examples from today's $275M CMCSA institutional zone, GS's $215M single block, and why FCEL's dip has no floor.
Reading Time: 7 Minutes
It’s Monday morning. Markets are deep in the red. Your watchlist is bleeding. The Iran conflict has escalated, oil is above $107, and Dow futures were down 1,000 points before the open.
Your Twitter feed is full of two camps:
Camp 1: “This is the end. Sell everything.”
Camp 2: “Buy the dip! Everything’s on sale!”
Both camps are guessing. And both are making the same mistake — they’re reacting to price without looking at positioning.
There’s a third option: look at where institutional money is actually showing up, and make decisions based on data instead of feelings.
Before we go further, let’s clear up a common misconception. Dark pool prints don’t tell you whether institutions are “buying” or “selling.” Every single trade has one buyer and one seller — that’s how markets work.
What dark pool prints do tell you:
This information is invisible on a standard brokerage chart. And it changes everything about how you evaluate a “dip.”
Let’s look at two stocks in the red on Monday, March 9, 2026. Both are “on sale.” Both look like dip-buying opportunities on a standard chart. But the dark pool data tells two very different stories.
Comcast dropped -3.5% this morning. A standard chart shows a big red candle.
Here’s what the dark pool data shows:
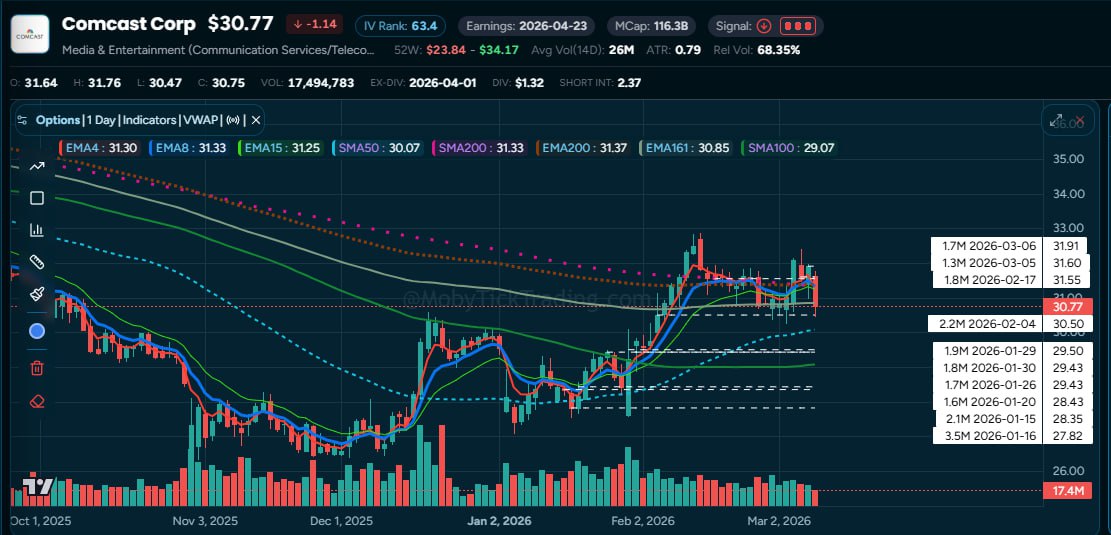
| Time | Shares | Price |
|---|---|---|
| Before open | 447K | $30.85 |
| Before open | 498K | $30.82 |
| 10:08 AM | 1,000,000 | $30.70 |
| 10:36 AM | 1,000,000 | $30.51 |
| 11:18 AM | 1,273,500 | $31.19 |
| 11:43 AM | 4,000,000 | $30.72 |
| + 2 more prints | 731K | $30.70–$30.91 |
Total: 8.95 million shares across 9 prints — $275 million worth. In a single morning.
That 4-million-share block at 11:43 AM? That’s $122.9 million in one trade. On a $30 stock. Someone with very deep pockets wanted to be at this level — badly enough to do it in one shot.
Now zoom out. Over the past 30 days, CMCSA has seen consistent institutional prints in the $30.50–$31.91 range:
That’s a clearly defined zone. Institutions keep transacting at these levels, day after day, week after week. The stock drops 3.5% today — and $275 million in dark pool prints show up right in the middle of this zone.
A trader without this data sees “Comcast is down.” A trader with this data sees that $30.50–$32.00 is one of the most actively transacted institutional zones in the market right now.
Does that guarantee the stock bounces? No. But it tells you someone with a lot of money has been repeatedly showing up at this price. That’s a fundamentally different situation than a stock falling into empty air.
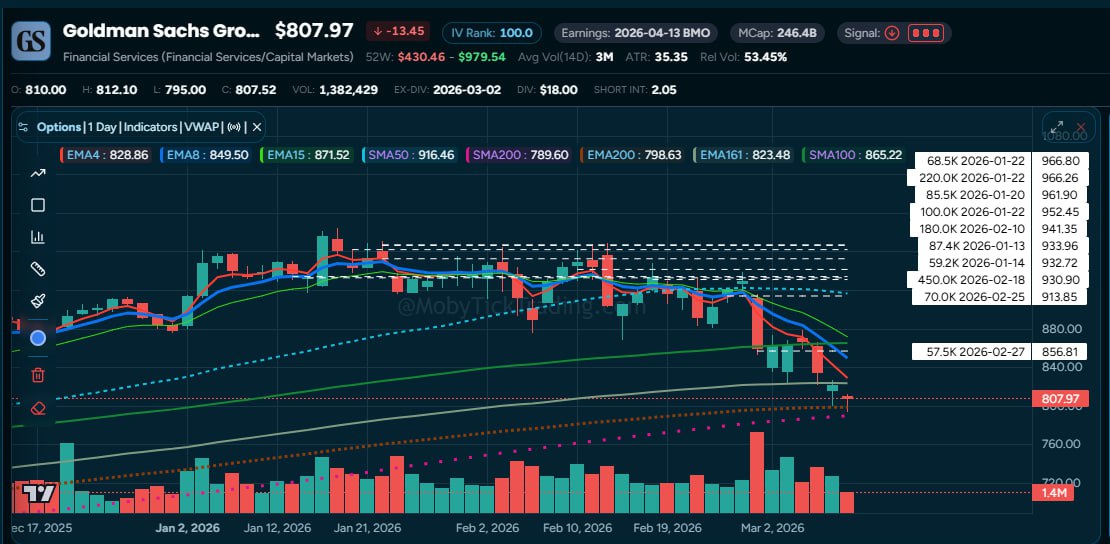
Goldman Sachs opened down this morning. At some point, a single dark pool trade printed:
262,623 shares @ $821.42 = $215.7 million. One trade.
For context, look at GS’s 30-day dark pool history:
The largest prints happened at higher prices ($930–$941). Today’s $215M block at $821 is the lowest price level with major institutional activity in 30 days.
Without dark pool data, GS down from $930 to $821 looks like a -12% crash. With dark pool data, you can see every price level where institutions have been active — and today’s print sits at the bottom of a range that stretches back a month.
Dark pool data isn’t just about finding opportunities — it’s about avoiding traps.
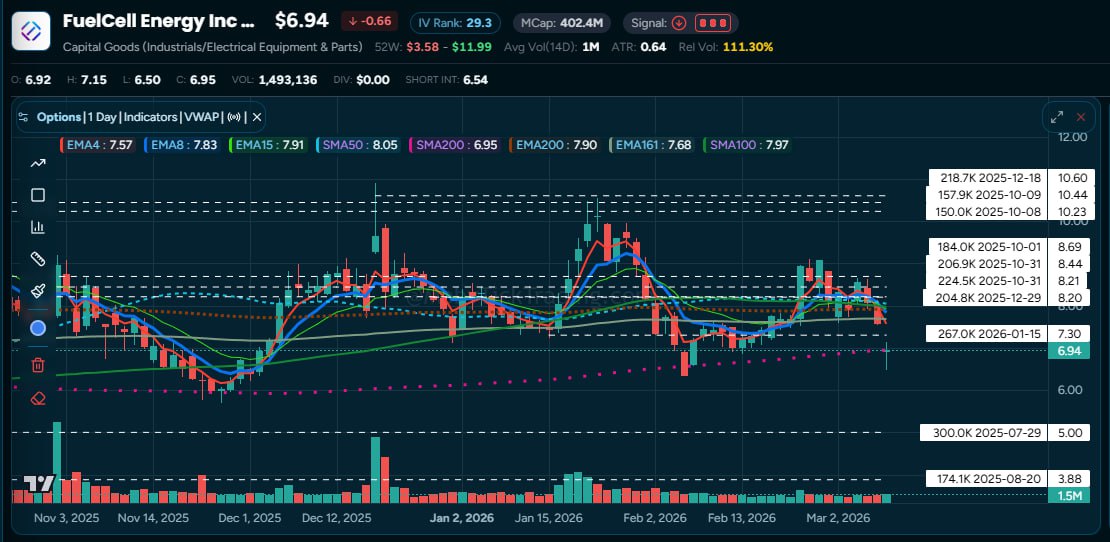
Look at FCEL (FuelCell Energy). The stock is down -8.7% today at $6.94. A trader scanning for “beaten-down stocks” might see this and think: “That’s cheap.”
But look at the dark pool data:
When a stock is falling and there are no significant dark pool prints near the current price, that absence is information. It means institutions haven’t stepped in at these levels. There’s no established floor. You’re the one testing whether this price holds, not a pension fund with $500 million in conviction.
A “dip” without institutional prints near it isn’t a dip. It’s just a stock going down.
Not all the action today is on the downside. BP (British Petroleum) is up 1% while the broader market crashes.
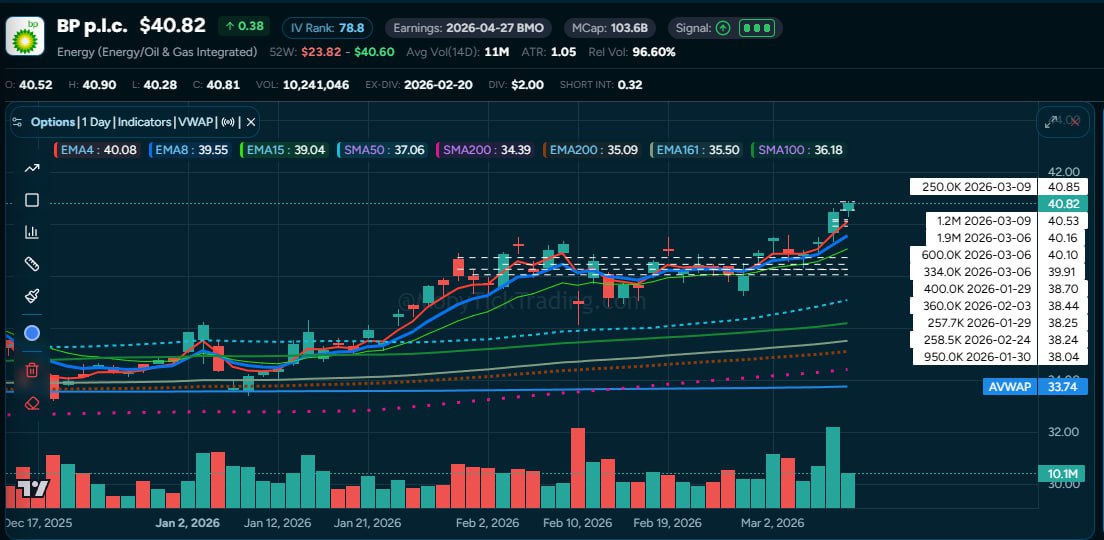
The dark pool data tells you this isn’t a surprise:
Institutional prints in BP ramped dramatically starting March 6 — three days ago. The Iran conflict was already escalating. Today’s prints continue the pattern at slightly higher prices.
If you’re trying to figure out where to look during a geopolitical crisis, dark pool data literally shows you where institutional money is flowing. No guessing required.
Next time a stock on your watchlist drops 5% and you’re tempted to hit “buy,” ask:
If institutions have been repeatedly transacting at or near the current price, it’s a level that matters to someone with serious capital. If there are zero prints nearby, you’re on your own.
A single 50,000-share print is noise. Multiple prints totaling millions of shares over days or weeks? That’s a pattern. CMCSA didn’t just have one print at $30.70 — it had $275 million across nine trades in a single morning, building on weeks of activity in the same zone.
Dark pool prints don’t exist in isolation. Is the stock falling into a zone of institutional activity (like CMCSA today), or falling through levels where institutions were active weeks ago? One suggests the level may hold. The other suggests institutions are already positioned elsewhere.
“Buy the dip” isn’t a strategy. It’s a bumper sticker.
A strategy requires knowing where institutional money has been active, at what price levels, in what size, and over what timeframe. That’s what dark pool data provides — not a crystal ball, but a map of where the biggest players in the market have been showing up.
On a day like today, with markets in turmoil and headlines screaming, that map is the difference between informed positioning and expensive guessing.
Moby Tick Trading tracks institutional dark pool activity across 10,000+ stocks with over 5 years of historical data. Our free Weekly Dark Pool Report breaks down the biggest institutional prints and key levels every week.
Ready to see where the money is moving? Explore our plans or check out our educational videos on YouTube to learn how to read dark pool data like a pro.