How Did We Do? — Last Week’s Scorecard
Every week, we publish institutional dark pool levels with bullish and bearish targets. Here’s how last week’s callouts performed against the actual weekly candle for February 24–28, 2026.
✅ 5 of 14 bullish triggers activated | ✅ 10 of 14 bearish triggers activated
A decidedly bearish week — but the levels worked. When triggers activated, they delivered.
⭐ Star Performers:
- AAPL — Bullish T3 hit ($275). +$8.61 from trigger to weekly high.
- AI — Bearish T2 hit ($8.00). Dropped from $10.44 entry to $7.73 low (–26%).
- NVDA — Both directions triggered. Bull T2 ($197.50) + Bear T2 ($177.50). $21.25 weekly range — volatile week around earnings.
- AVGO — Bearish T3 hit ($310). Fell from $319.50 trigger to $307.93 low.
| Ticker |
Bull Above |
Wk High |
Bull Result |
Bear Below |
Wk Low |
Bear Result |
| SPY |
$697.50 |
$693.68 |
No Entry |
$680 |
$680.00 |
Exact level — held to the penny |
| QQQ |
$617.50 |
$616.83 |
No Entry |
$602.50 |
$599.05 |
✅ T1 ($600) |
| IWM |
$266.25 |
$266.24 |
No Entry |
$262 |
$258.10 |
✅ T1-T2 ($260.50, $258.25) |
| XLF |
$54.50 |
$52.66 |
No Entry |
$51 |
$50.23 |
✅ Triggered, 0 targets |
| NVDA |
$193.50 |
$197.63 |
✅ T1-T2 ($195, $197.50) |
$182.50 |
$176.38 |
✅ T1-T2 ($180, $177.50) |
| AAPL |
$267.50 |
$276.11 |
✅ T1-T3 ($270, $272.50, $275) ⭐ |
$255 |
$262.89 |
No Entry |
| AVGO |
$341.25 |
$338.50 |
No Entry |
$319.50 |
$307.93 |
✅ T1-T3 ($317.50, $315, $310) |
| GOOGL |
$321.50 |
$319.51 |
No Entry |
$302.50 |
$302.35 |
✅ Triggered, 0 targets |
| AMD |
$208.50 |
$216.71 |
✅ T1-T2 ($210, $215) |
$192.50 |
$194.15 |
No Entry |
| SCHW |
$97 |
$97.61 |
✅ Triggered, 0 targets |
$92 |
$91.28 |
✅ Triggered, 0 targets |
| WMT |
$129 |
$128.60 |
No Entry |
$121 |
$122.96 |
No Entry |
| AAL |
$14.50 |
$14.17 |
No Entry |
$13 |
$12.84 |
✅ Triggered, 0 targets |
| AI |
$11.50 |
$10.53 |
No Entry |
$9.75 |
$7.73 |
✅ T1-T2 ($9, $8) ⭐ |
| SMH |
$416.25 |
$427.94 |
✅ T1-T2 ($417.50, $425) |
$407 |
$401.88 |
✅ T1 ($405) |
Note: If stocks didn’t trigger the previous week, it doesn’t mean the trade is off. There is massive institutional conviction and these levels will move. Keep them on your radar.
Market Overview
📊 Weekly Dark Pool Stats (Feb 24–28): 17,391 block trades (50K+ shares) | $124.7B total volume | Most active: NVDA ($7.4B across 35 trades
This week’s dark pool data painted a clear picture before the headlines caught up. While the financial media focused on Nvidia’s earnings beat and Friday’s hot PPI print, institutions were already positioned — and the prints told the story.
The numbers: The S&P 500 slipped 0.5% for February. The Nasdaq Composite dropped over 3%, its worst month since March 2025 — though the pain was concentrated in software (the iShares Expanded Tech-Software ETF fell nearly 10% in February alone, down 23% year-to-date). The Dow eked out a small gain, extending its winning streak to ten consecutive months.
Weekly index performance (Feb 24–28):
- SPY (S&P 500): $687.83 → $685.99 (–0.27%)
- QQQ (Nasdaq-100): $606.61 → $607.29 (+0.11%)
- IWM (Russell 2000): $263.40 → $261.41 (–0.76%)
- DIA (Dow): $494.50 → $489.66 (–0.98%)
The key catalysts — and what institutions did before they hit:
Nvidia reported Q4 earnings Wednesday after the close — $68.1 billion in revenue (+73% YoY), beating estimates by $3 billion, with $78 billion guidance for next quarter. The stock initially rose, then sold off 4.4% Thursday and another 3.6% Friday. But look at the dark pool data: $7.4 billion in institutional prints across the week, with 8.5 million shares printed at $176.01 on February 5 — weeks before the report. These prints at $174–$177 are now acting as the support floor.
Friday’s Producer Price Index came in hotter than expected — +0.5% month-over-month (vs. 0.3% forecast), with headline PPI at 2.9% year-over-year. Markets are pricing a 94.1% probability the Fed holds rates steady in March. Meanwhile, tariff uncertainty continued after the Supreme Court struck down broad tariff authority and the White House imposed new 10–15% across-the-board tariffs.
The standout story: Netflix. A 5.36 million share dark pool print at $85.30 ($457M) landed Wednesday — hours before Bloomberg reported Netflix was dropping its $83 billion Warner Bros. Discovery bid. Friday morning, NFLX gapped up 13.8% on 400.9 million shares. The data was on the tape before the news broke.
How do we trade it? The answer is in the levels. Institutions positioned at specific price points — those prints now serve as support and resistance. Our job is to identify where the big money committed capital and use those levels as our roadmap for the week ahead.
💡 What Are Dark Pools? Dark pools sound like insidious beasts. But these big players need to buy or sell from someone — they can’t use a limit order for 3 million shares. This is why trades happen “off exchange.” Our job: identify these levels and use them as institutional support and resistance.
Remember: Institutions are not scalpers. They accumulate and distribute over time.
Sources: MobyTick API, Reuters, CNBC, Bloomberg, Bureau of Labor Statistics
Print of the Week
NFLX — 5.36 million shares at $85.30 ($457M) on Wednesday, February 26.
This single dark pool print — the largest Netflix block trade in over a month — landed hours before Bloomberg reported Netflix was dropping its Warner Bros. Discovery bid. The next morning, NFLX gapped from $84.59 to open at $94.30 and closed at $96.24. Volume: 200 million shares (436% of average). The data was on the tape before the headlines hit.
Trade Setups — Entries & Targets (March 2–6, 2026)
Based on institutional dark pool levels from the past 30 days. These are NOT recommendations — they are institutional-grade support and resistance levels for your watchlist.
How to use these levels: Wait for a closing confirmation in the last 15 minutes of the trading day. If price closes above the “Bullish Above” level, the bullish targets are in play. If price closes below the “Bearish Below” level, the bearish targets are active. Do NOT chase entries mid-day — let the close confirm the direction.
📈 Bullish Targets
| Ticker |
Price |
Above |
T1 |
T2 |
T3 |
T4 |
T5 |
T6 |
| SPY |
$685.99 |
$697.50 |
$700 |
$702.50 |
$705 |
$710 |
|
|
| QQQ |
$605.38 |
$609.50 |
$612.50 |
$615 |
$620 |
$621 |
$625 |
$626.25 |
| IWM |
$261.41 |
$266.25 |
$267.50 |
$270 |
$271.25 |
$272.50 |
$275 |
|
| NVDA |
$177.80 |
$180 |
$182.50 |
$185 |
$186 |
$187.50 |
$190 |
|
| AAPL |
$263.55 |
$272.50 |
$274 |
$275 |
$276.50 |
$277.50 |
$280 |
|
| MSFT |
$394.17 |
$403 |
$405 |
$407.50 |
$410 |
$413 |
$415 |
$425 |
| GOOGL |
$309.20 |
$317.50 |
$320 |
$325 |
$330 |
$340 |
$345 |
$350 |
| AMZN |
$209.23 |
$211.25 |
$212.50 |
$215 |
$217.50 |
$220 |
$222.50 |
|
| META |
$645.21 |
$665 |
$670 |
$680 |
$690 |
$697.50 |
$700 |
|
| NFLX |
$95.57 |
$100 |
$101.25 |
$102.50 |
$105 |
$107.50 |
$110 |
|
| UNH |
$292.14 |
$295 |
$297.50 |
$299 |
$301.25 |
$302.50 |
$305 |
|
| ORCL |
$144.69 |
$155 |
$156.25 |
$157.50 |
$160 |
$165 |
$170 |
|
| NVO |
$37.49 |
$41 |
$42.50 |
$43.25 |
$45 |
$47.50 |
$48.25 |
|
| WMT |
$127.75 |
$128.25 |
$130 |
$132 |
$134 |
$135 |
$137.50 |
|
| RTX |
$202.80 |
$205 |
$206.25 |
$207.50 |
$210 |
$212.50 |
$215 |
|
| CVX |
$187.10 |
$188 |
$190 |
$191.25 |
$192.50 |
$195 |
$196.25 |
|
| XLE |
$55.92 |
$56.25 |
$57.50 |
$58.25 |
$60 |
$61.25 |
$62.50 |
|
| MRVL |
$81.35 |
$82.50 |
$84.25 |
$85 |
$87.50 |
$90 |
$92.50 |
$95 |
📉 Bearish Targets
| Ticker |
Price |
Below |
T1 |
T2 |
T3 |
T4 |
T5 |
T6 |
| SPY |
$685.99 |
$679 |
$677.50 |
$675 |
$672.50 |
$671.65 |
$670 |
$665 |
| QQQ |
$605.38 |
$600 |
$597.50 |
$596.25 |
$595 |
$590 |
$587.50 |
$585 |
| IWM |
$261.41 |
$259 |
$257.50 |
$256 |
$255 |
$253 |
$250 |
|
| NVDA |
$177.80 |
$174 |
$172.50 |
$170 |
$167.50 |
$165 |
$162.50 |
$160 |
| AAPL |
$263.55 |
$259 |
$257 |
$256 |
$255 |
$250 |
$245 |
$240 |
| MSFT |
$394.17 |
$384 |
$382.50 |
$380 |
$370 |
$365 |
$360 |
|
| GOOGL |
$309.20 |
$298 |
$296.25 |
$295 |
$290 |
$285 |
$280 |
|
| AMZN |
$209.23 |
$205 |
$202.50 |
$201.25 |
$200 |
$199 |
$197.50 |
$190 |
| META |
$645.21 |
$637 |
$635 |
$630 |
$620 |
$610 |
$600 |
|
| NFLX |
$95.57 |
$90 |
$88.50 |
$85.30 |
$84.50 |
$83.50 |
$81 |
$77 |
| UNH |
$292.14 |
$280 |
$277.50 |
$275 |
$272.50 |
$270 |
$260 |
$250 |
| ORCL |
$144.69 |
$142.50 |
$140 |
$137.50 |
$135 |
$132.50 |
$130 |
$120 |
| NVO |
$37.49 |
$37 |
$36.50 |
$35 |
$34 |
$32.50 |
$32 |
$30 |
| WMT |
$127.75 |
$121 |
$120 |
$118.75 |
$117.50 |
$115 |
$112.50 |
|
| RTX |
$202.80 |
$196 |
$195 |
$192.50 |
$190 |
$185 |
$180 |
|
| CVX |
$187.10 |
$180 |
$178 |
$176.25 |
$175 |
$173 |
$171.25 |
$170 |
| XLE |
$55.92 |
$54 |
$52.50 |
$52 |
$51 |
$50 |
|
|
| MRVL |
$81.35 |
$77 |
$76 |
$75 |
$74 |
$70 |
$68.75 |
$65 |
📊 Institutional Dark Pool Levels — Chart Analysis
Each chart below shows the MobyTick dark pool overlay on the daily price chart. Orange/teal blocks on the right side represent institutional dark pool prints — the larger the block, the more shares traded at that level.
SPY — S&P 500 ETF ($685.99)
📈 Bullish Above: $697.50 | 📉 Bearish Below: $679
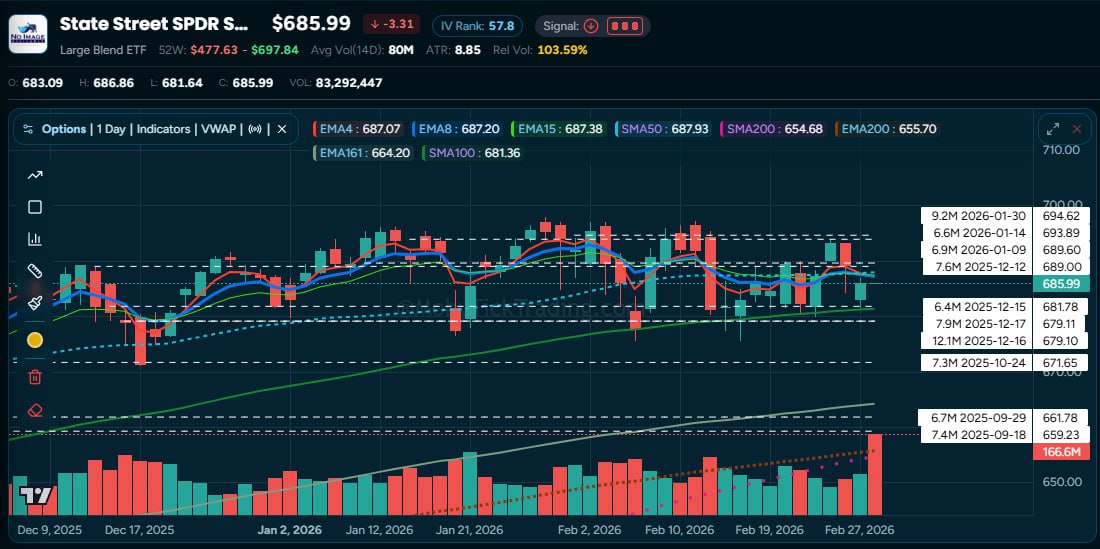
SPY closed the week at $685.99, sitting just below the EMA cluster ($687). The chart shows two major institutional zones:
- Overhead resistance at $689–$695: A 9.2M share print at $694.62 (Jan 30), 6.6M at $693.89 (Jan 14), 6.9M at $689.60 (Jan 9), and 7.6M at $689.00 (Dec 12). This is the wall institutions built above current price.
- Support floor at $679–$682: 12.1M shares at $679.10 (Dec 16), 7.9M at $679.11 (Dec 17), and 6.4M at $681.78 (Dec 15). This is the level that held last week when price touched $680.00 exactly.
- Deep support at $671.65: 7.3M shares from October 24, 2025 — the next major institutional level below.
Price is sandwiched between these two zones. A close above $697.50 activates bullish targets. Below $679, the Dec support cluster comes into play.
QQQ — Nasdaq-100 ETF ($605.38)
📈 Bullish Above: $609.50 | 📉 Bearish Below: $600
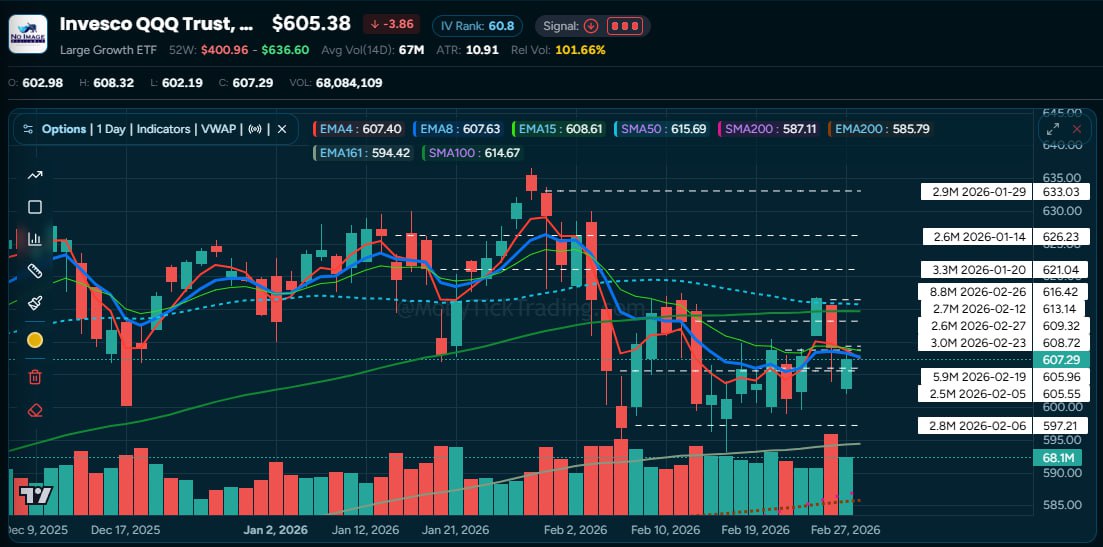
- The chart shows the massive 8.8M share print at $616.42 (Feb 26) as the primary overhead resistance, with 2.7M at $613.14 (Feb 12) and 2.6M at $609.32 (Feb 27) forming intermediate levels.
- Support at $605–$606: 5.9M shares at $605.96 (Feb 19) and 2.5M at $605.55 (Feb 5) — institutions actively defending this zone, right at current price.
- Below, 2.8M shares at $597.21 (Feb 6) marks the bear target floor.
- Above the overhead cluster: 3.3M at $621.04 (Jan 20) and 2.9M at $633.03 (Jan 29) — these are the higher targets if QQQ breaks through resistance.
IWM — Russell 2000 ETF ($261.41)
📈 Bullish Above: $266.25 | 📉 Bearish Below: $259
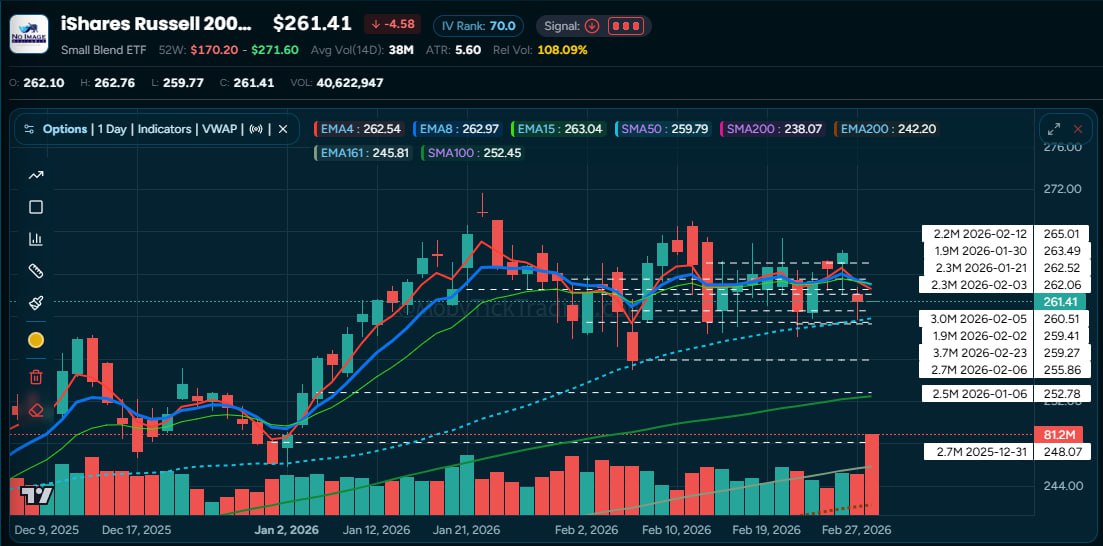
- Price sits just below the EMA4/EMA8/EMA15 cluster ($262–$263). The $262–$263 zone has 2.2M shares (Feb 12), 2.3M (Jan 21), and 2.3M (Feb 3) — institutions are positioned right here.
- Support at $259–$260: 3.0M shares at $260.51 (Feb 5), 3.7M at $259.27 (Feb 23), and 1.9M at $259.41 (Feb 2). This zone held last week and is the bear trigger area.
- Below, 2.7M at $255.86 (Feb 6) and 2.5M at $252.78 (Jan 6) provide deeper support.
- Above, 2.2M at $265.01 (Feb 12) marks the first overhead level before the $266.25 bullish trigger.
NVDA — Nvidia ($177.80)
📈 Bullish Above: $180 | 📉 Bearish Below: $174
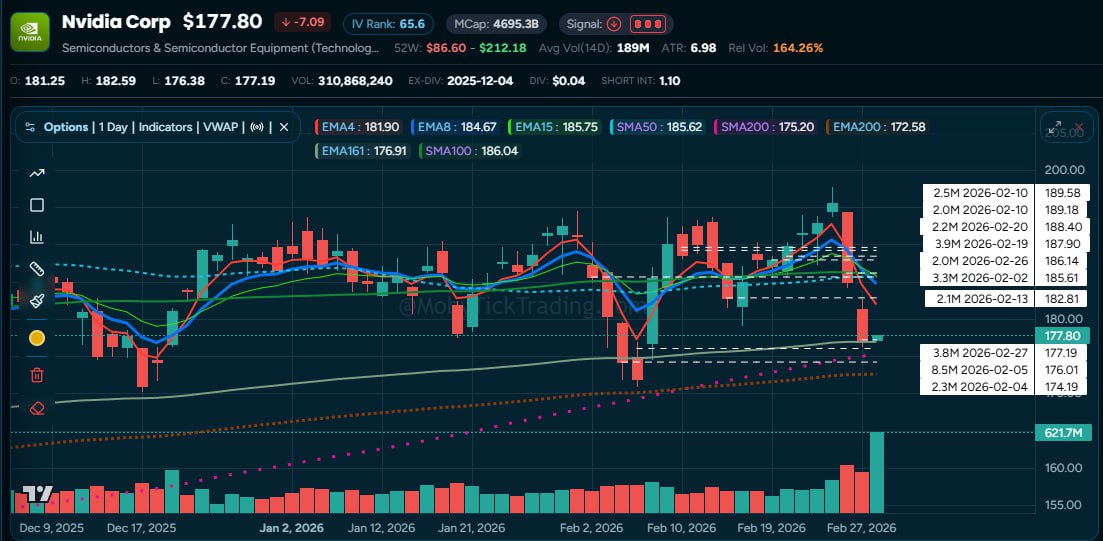
NVDA sold off despite beating Q4 earnings ($68.1B revenue, +73% YoY). Friday’s volume was 621.7 million shares (164% relative volume). The dark pool levels show where institutions are positioned through the selloff:
- Current support at $176–$177: 3.8M shares at $177.19 (Feb 27) and the massive 8.5M at $176.01 (Feb 5). This is the floor institutions built before earnings — and it’s holding.
- Overhead at $185–$190: 3.3M at $185.61 (Feb 2), 3.9M at $187.90 (Feb 19), 2.5M at $189.58 (Feb 10), and 2.0M at $189.18 (Feb 10). This was the pre-earnings range — now it’s resistance.
- Below, 2.3M at $174.19 (Feb 4) marks the bear trigger zone. Under that, 2.1M at $182.81 (Feb 13) is intermediate support.
- Key level: $196–$197 had prints of 2.0M and 2.2M — the pre-earnings highs. A long way from current price.
AAPL — Apple ($263.55)
📈 Bullish Above: $272.50 | 📉 Bearish Below: $259
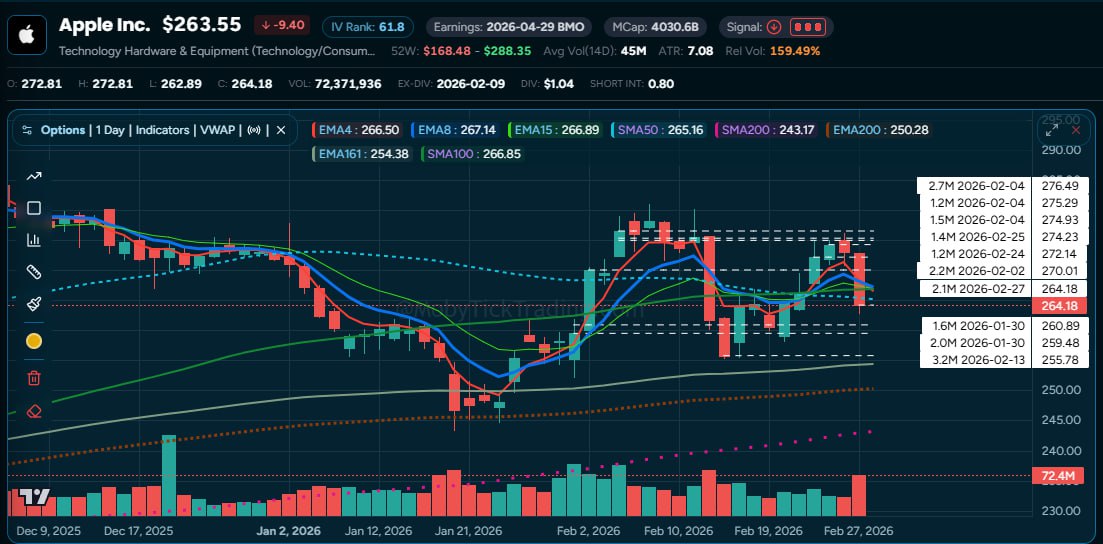
- The chart shows heavy prints above current price: 2.7M at $276.49 (Feb 4), 1.5M at $274.93 (Feb 4), 2.2M at $270.01 (Feb 2), and 1.4M at $272.14 (Feb 25). Institutions were active in the $270–$276 zone — these are now the overhead levels.
- Right at current price: 2.1M shares at $264.18 (Feb 27) — Friday’s print landed exactly at the close.
- Support below: 1.6M at $260.89 (Jan 30), 2.0M at $259.48 (Jan 30), and 3.2M at $255.78 (Feb 13). The $259 bear trigger sits right at the Jan 30 institutional floor.
- Relative volume: 159%. The stock is attracting attention.
MSFT — Microsoft ($394.17)
📈 Bullish Above: $403 | 📉 Bearish Below: $384
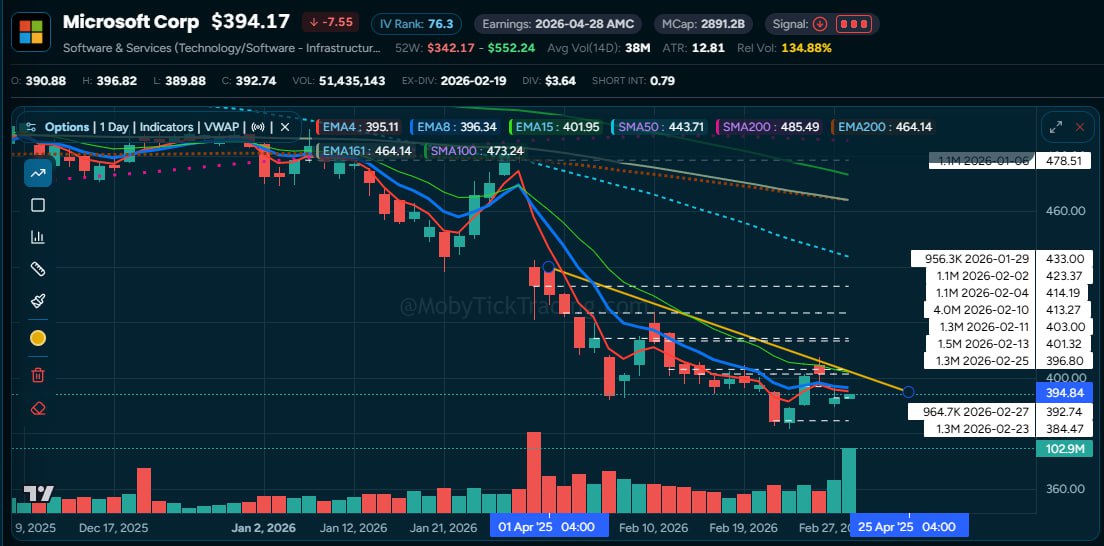
- MSFT is in a steep downtrend from $552, trading well below all major moving averages. The chart shows prints stepping down with price:
- Overhead zone: 4.0M at $413.27 (Feb 10), 1.1M at $414.19 (Feb 4), 1.3M at $403.00 (Feb 11), and 1.5M at $401.32 (Feb 13). The $403 bullish trigger sits right at this institutional cluster.
- At current price: 1.3M at $396.80 (Feb 25) and 964.7K at $392.74 (Feb 27) — recent prints right where MSFT is trading now.
- Below: 1.3M at $384.47 (Feb 23) — the bear trigger level. Under that, the chart shows open air.
- IV Rank: 76.3. The options market is pricing elevated uncertainty.
GOOGL — Alphabet ($309.20)
📈 Bullish Above: $317.50 | 📉 Bearish Below: $298
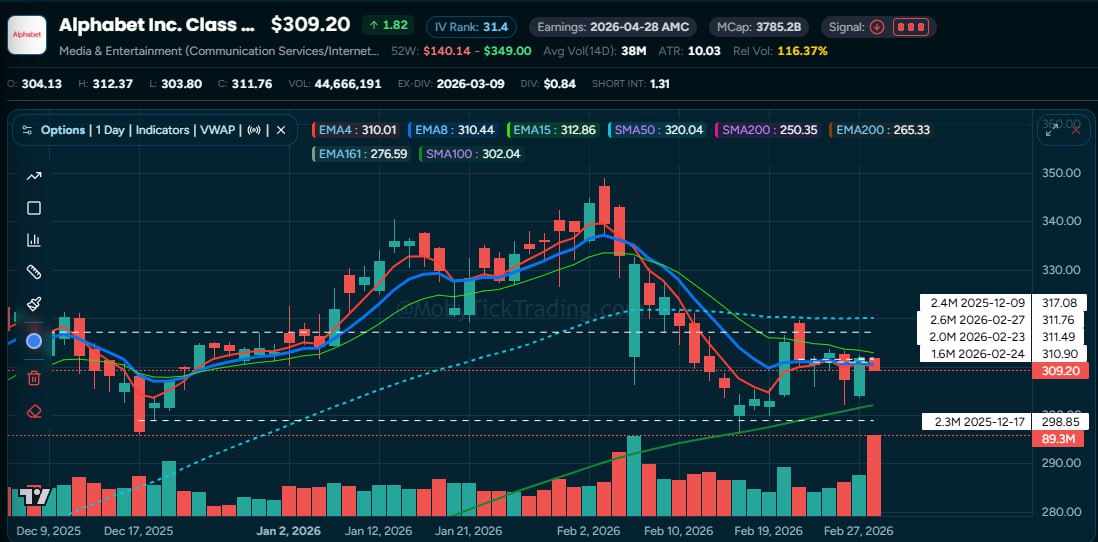
- GOOGL sits just below the EMA4 ($310) and EMA15 ($312.86), in a tight consolidation. Institutional prints are tightly clustered:
- Current zone: 2.6M at $311.76 (Feb 27), 2.0M at $311.49 (Feb 23), 1.6M at $310.90 (Feb 24). Three consecutive days of prints at $310–$312 — institutions are building right here.
- Overhead: 2.4M at $317.08 (Dec 9) — this is the bullish trigger area and the last major print before the current range.
- Support: 2.3M at $298.85 (Dec 17) — a clear floor well below current price. The $298 bear trigger aligns with this institutional level.
- Ex-dividend: March 9 ($0.84)
AMZN — Amazon ($209.23)
📈 Bullish Above: $211.25 | 📉 Bearish Below: $205
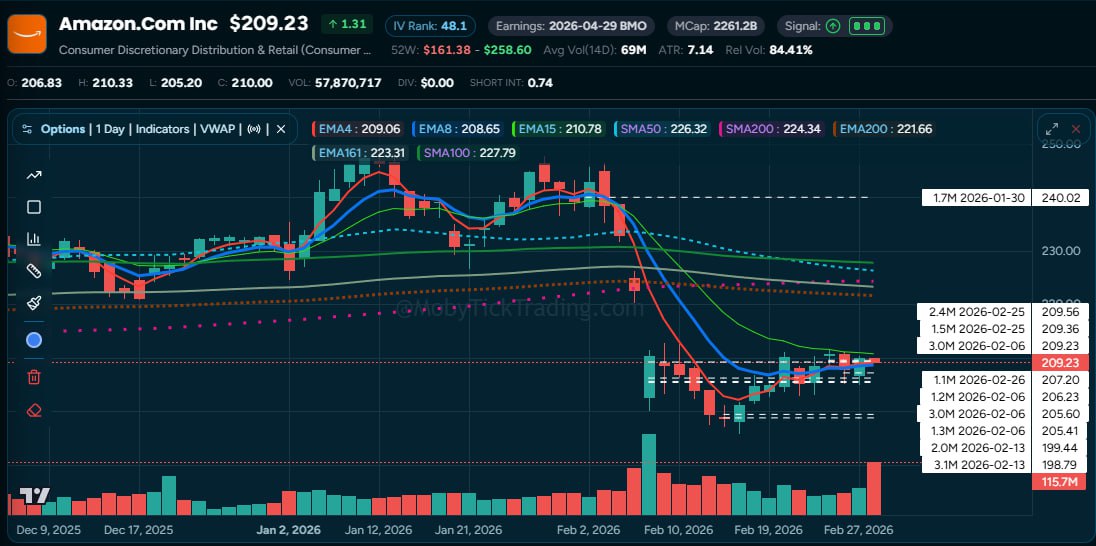
- AMZN pulled back from $258 to $209, sitting at the EMA4/EMA8 convergence ($208–$209). The chart shows a clear institutional footprint:
- At current price: 2.4M at $209.56 (Feb 25), 1.5M at $209.36 (Feb 25), and 3.0M at $209.23 (Feb 6). Heavy prints right at the $209 level — institutions are anchored here.
- Immediate support: 1.1M at $207.20 (Feb 26), 1.2M at $206.23 (Feb 6), 3.0M at $205.60 (Feb 6). The $205 bear trigger sits at this cluster.
- Deeper support: 2.0M at $199.44 (Feb 13) and 3.1M at $198.79 (Feb 13). These are the backstop levels if AMZN breaks down.
- Overhead: 1.7M at $240.02 (Jan 30) — a big gap to fill above.
META — Meta Platforms ($645.21)
📈 Bullish Above: $665 | 📉 Bearish Below: $637
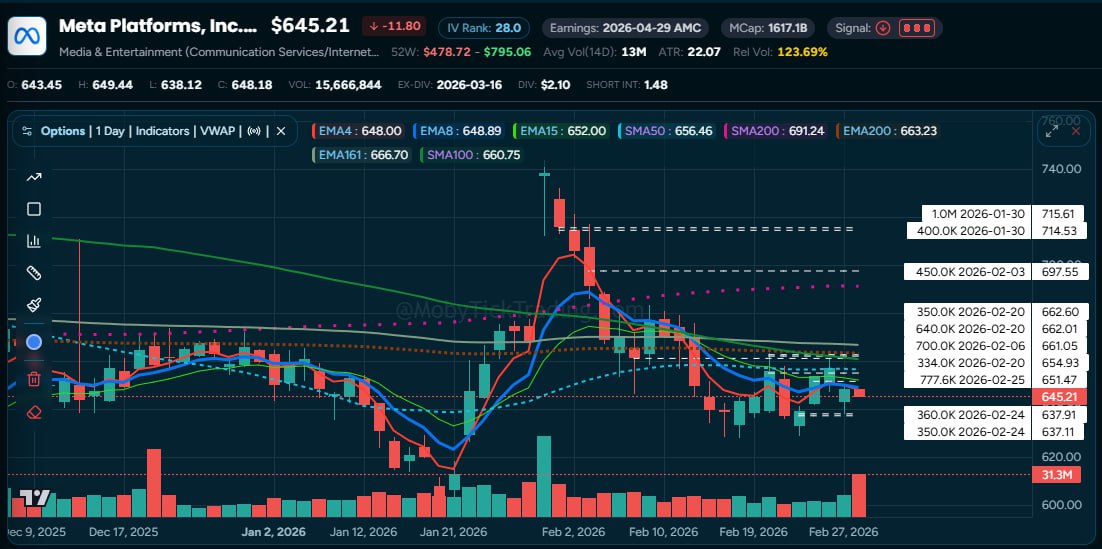
- META trades below all major moving averages at $645, with the chart showing prints clustered in two zones:
- Overhead resistance: 700K at $661.05 (Feb 6), 640K at $662.01 (Feb 20), 350K at $662.60 (Feb 20), and 777.6K at $651.47 (Feb 25). The $651–$662 zone is the institutional ceiling.
- At/below current price: 360K at $637.91 (Feb 24) and 350K at $637.11 (Feb 24). The $637 bear trigger aligns with these prints.
- Above the resistance cluster: 450K at $697.55 (Feb 3) and higher prints at $714–$715 from January. A breakout above $665 targets these levels.
- Ex-dividend: March 16 ($2.10)
NFLX — Netflix ($95.57)
📈 Bullish Above: $100 | 📉 Bearish Below: $90
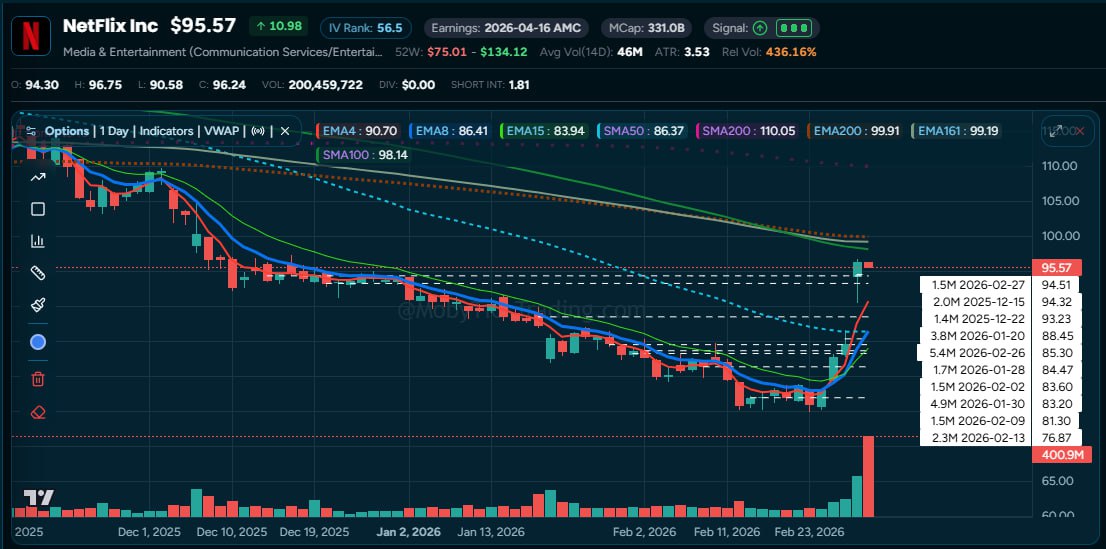
The chart tells the full story — weeks of institutional accumulation in the $76–$85 range, then the 5.4M share print at $85.30 on Feb 26, followed by the massive gap to $95.57 on 400.9M shares (436% relative volume) after the Warner Bros. bid withdrawal news:
- Post-gap zone: 1.5M at $94.51 (Feb 27), 2.0M at $94.32 (Dec 15), 1.4M at $93.23 (Dec 22). New institutional activity forming at $93–$95.
- The print that mattered: 5.4M at $85.30 (Feb 26) — $457M committed the day before news broke. This is now a key reference level below.
- Accumulation floor: 4.9M at $83.20 (Jan 30), 3.8M at $88.45 (Jan 20), 2.3M at $76.87 (Feb 13). Institutions built positions over four weeks before the catalyst.
- The $100 bullish trigger sits right at the SMA100 ($98.14) and EMA161 ($99.19) — a close above would be technically significant.
UNH — UnitedHealth Group ($292.14)
📈 Bullish Above: $295 | 📉 Bearish Below: $280
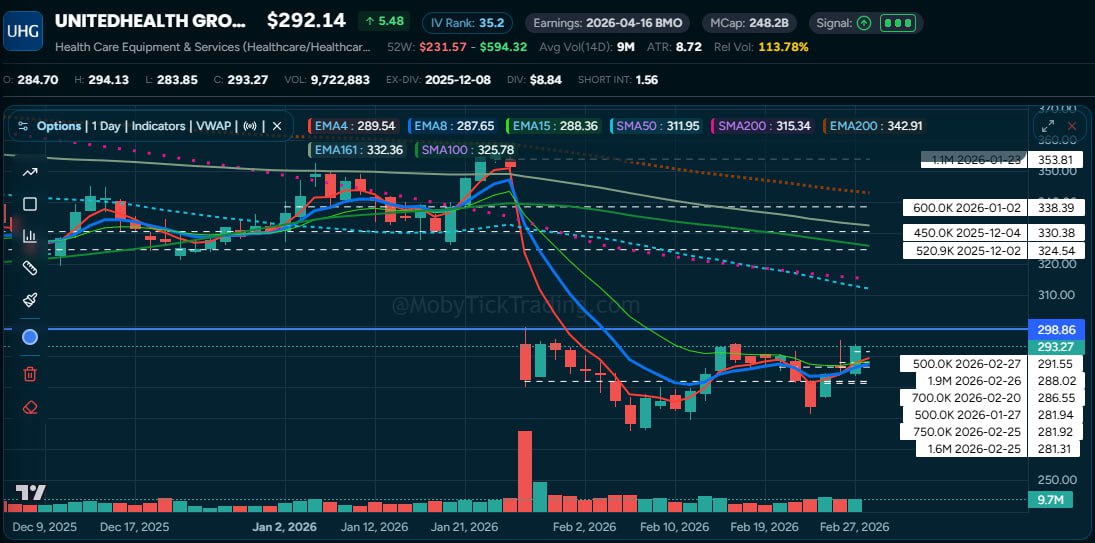
- UNH has dropped from $360 to $292, trading well below all moving averages. The chart shows institutional prints at two key zones:
- Recent cluster at $281–$292: 1.9M at $288.02 (Feb 26) — the $550M single print we tweeted about — plus 500K at $291.55 (Feb 27), 700K at $286.55 (Feb 20), and 1.6M at $281.31 (Feb 25). Institutions are active at these levels.
- Overhead from earlier: 600K at $338.39 (Jan 2), 450K at $330.38 (Dec 4), 520.9K at $324.54 (Dec 2), and 1.1M at $353.81 (Jan 27). These are the legacy levels from before the decline — now major overhead resistance.
- The $280 bear trigger aligns with the 1.6M print at $281.31. Below that is open air.
- Horizontal support at $298.86 visible on the chart — a level from previous trading range.
ORCL — Oracle ($144.69)
📈 Bullish Above: $155 | 📉 Bearish Below: $142.50
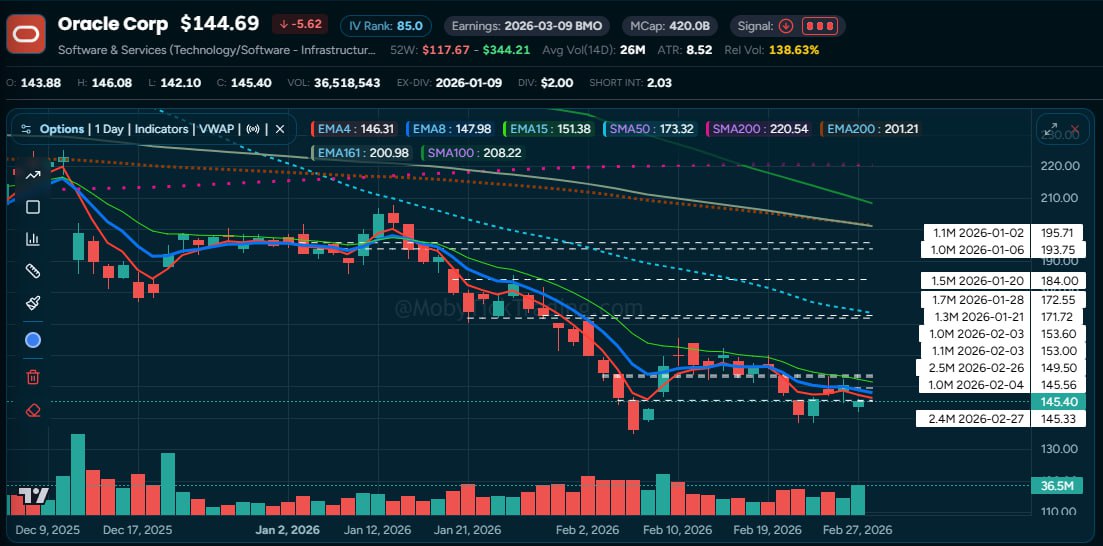
- ORCL is in a deep downtrend from $344 to $144.69. But the dark pool prints at the bottom are notable:
- At current price: 2.4M at $145.33 (Feb 27) — a $350M print right at the Friday close. Plus 1.0M at $145.56 (Feb 4). Institutions are showing up at these levels.
- Just above: 2.5M at $149.50 (Feb 26), 1.0M at $153.60 (Feb 3), 1.1M at $153.00 (Feb 3). The $149–$155 zone has institutional interest — the bullish trigger at $155 would clear this cluster.
- Further above: 1.7M at $172.55 (Jan 28), 1.3M at $171.72 (Jan 21), 1.5M at $184.00 (Jan 20). These are where institutions were active before the decline continued.
- ⚠️ Earnings: March 9 BMO — major catalyst ahead. IV Rank: 85.0.
NVO — Novo Nordisk ($37.49)
📈 Bullish Above: $41 | 📉 Bearish Below: $37
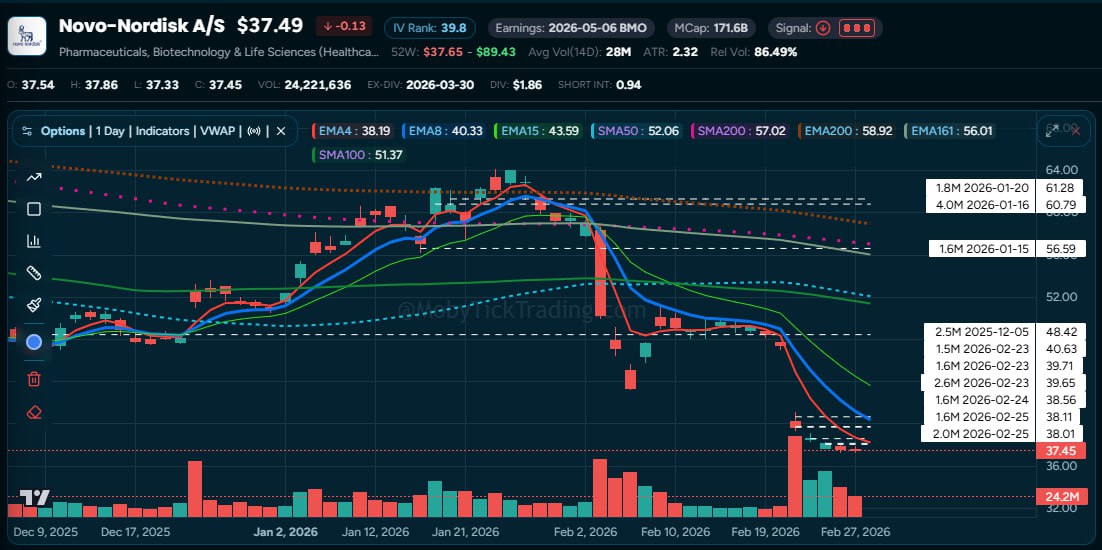
- NVO sits at its 52-week low ($37.49) after the CagriSema Phase 3 crash. The chart shows a dramatic shift in institutional activity:
- Pre-crash prints (January): 4.0M at $60.79 (Jan 16), 1.8M at $61.28 (Jan 20), 1.6M at $56.59 (Jan 15). These positions are significantly underwater.
- Post-crash prints (Feb 23–27): 2.6M at $39.65, 1.5M at $40.63, 1.6M at $39.71 on crash day (Feb 23). Then 1.6M at $38.56 (Feb 24), 2.0M at $38.01 and 1.6M at $38.11 (Feb 25). Over 13 million shares in five days at $38–$41.
- The key level: $40 — a strong close above it suggests the post-crash prints are accumulation. The bullish trigger at $41 would confirm.
- Below $37, the bear trigger activates with limited historical print data below — uncharted territory.
- Ex-dividend: March 30 ($1.86)
WMT — Walmart ($127.75)
📈 Bullish Above: $128.25 | 📉 Bearish Below: $121
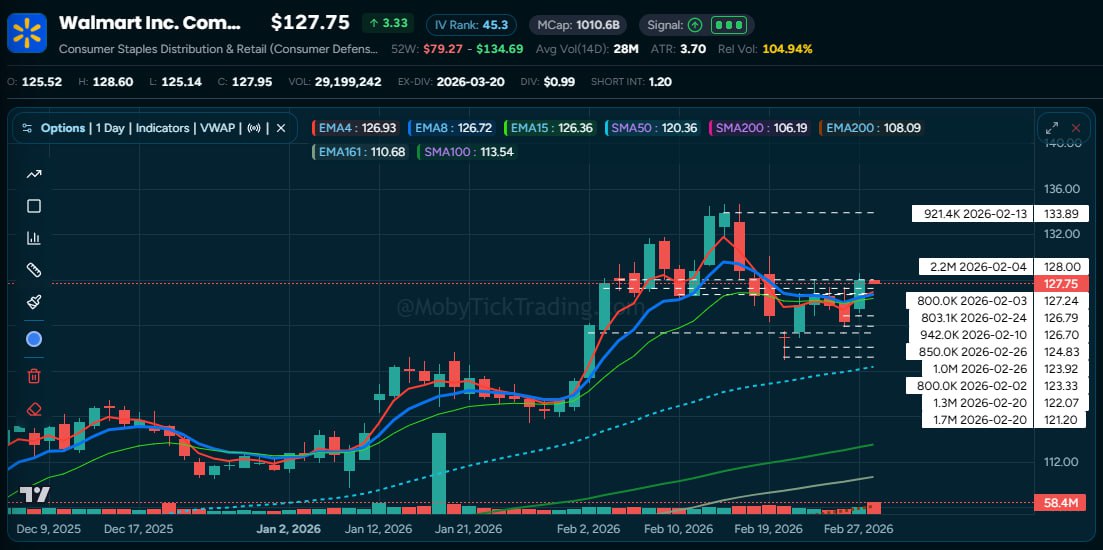
- WMT pulled back from $134 highs and is consolidating in the $122–$128 range. The chart shows:
- Overhead: 921.4K at $133.89 (Feb 13) and 2.2M at $128.00 (Feb 4) — the $128 level is the ceiling, and the bullish trigger at $128.25 sits right above it.
- Current zone: 800K at $127.24 (Feb 3), 803.1K at $126.79 (Feb 24), 942K at $126.70 (Feb 10), 850K at $124.83 (Feb 26), and 1.0M at $123.92 (Feb 26). Institutions are active throughout this range.
- Support floor: 1.3M at $122.07 (Feb 20) and 1.7M at $121.20 (Feb 20). The $121 bear trigger aligns with this cluster.
- Ex-dividend: March 20 ($0.99)
RTX — RTX Corporation ($202.80)
📈 Bullish Above: $205 | 📉 Bearish Below: $196
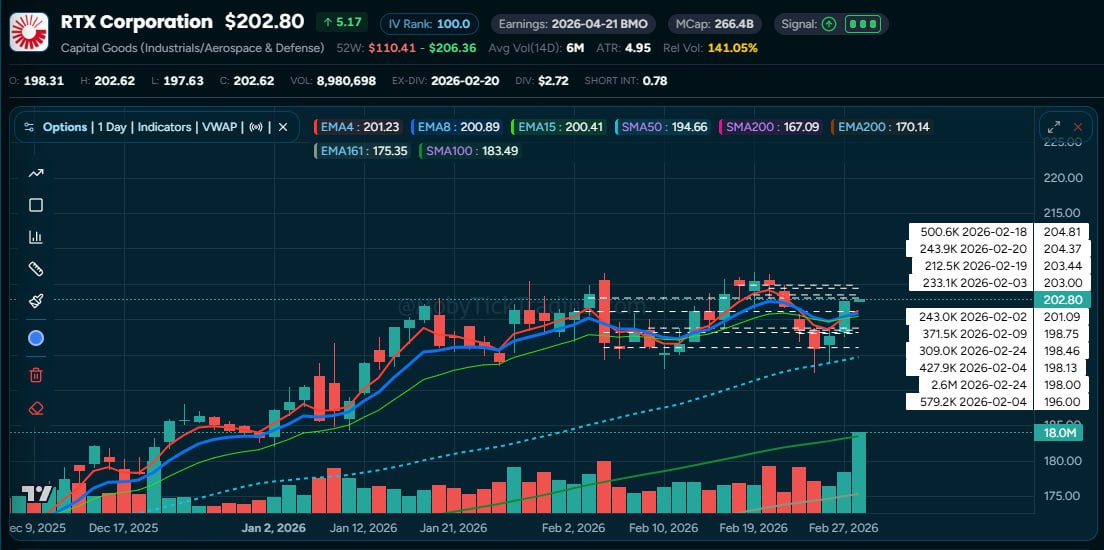
- RTX (Aerospace & Defense) has surged from $110 to $202.80, near its 52-week high of $206.36. IV Rank: 100. The chart shows institutional prints stacking at current levels:
- At current price: 2.6M at $198.00 (Feb 24) — the largest recent print — plus 427.9K at $198.13 (Feb 4), 309K at $198.46 (Feb 24), and 371.5K at $198.75 (Feb 9). Heavy institutional interest at $198.
- Above: 500.6K at $204.81 (Feb 18), 243.9K at $204.37 (Feb 20), 212.5K at $203.44 (Feb 19), and 233.1K at $203.00 (Feb 3). The $203–$205 zone is the next institutional cluster — the bullish trigger at $205 sits here.
- Below: 579.2K at $196.00 (Feb 4) and 243K at $201.09 (Feb 2). The $196 bear trigger aligns with the Feb 4 print.
- Earnings: April 21 BMO
CVX — Chevron ($187.10)
📈 Bullish Above: $188 | 📉 Bearish Below: $180
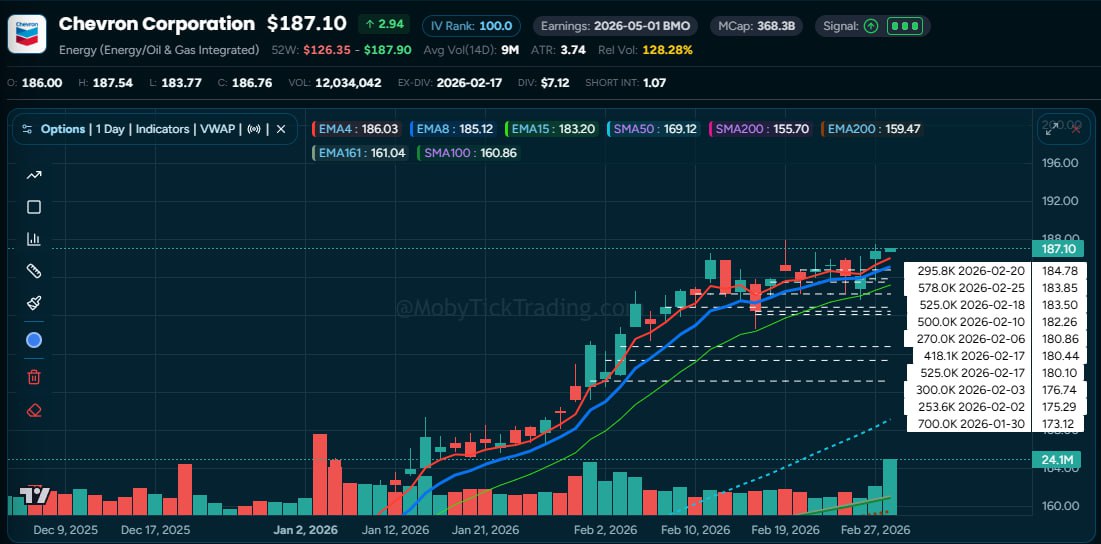
- CVX is at its 52-week high of $187.90, up from $126 in December. IV Rank: 100. The chart shows a clear uptrend supported by institutional prints:
- At/near current price: 295.8K at $184.78 (Feb 20), 578K at $183.85 (Feb 25), 525K at $183.50 (Feb 18), 500K at $182.26 (Feb 10). Institutions are active in the $182–$185 zone just below current price.
- Below: 418.1K at $180.44 (Feb 17), 525K at $180.10 (Feb 17), 300K at $176.74 (Feb 3), and 700K at $173.12 (Jan 30). The $180 bear trigger has institutional prints around it.
- The bullish trigger at $188 would mark a new 52-week high breakout. The prints have been stepping up steadily — institutions have been riding this move.
- Ex-dividend: 2026-02-17 ($7.12 annual). Earnings: May 1 BMO.
XLE — Energy Select Sector SPDR ($55.92)
📈 Bullish Above: $56.25 | 📉 Bearish Below: $54
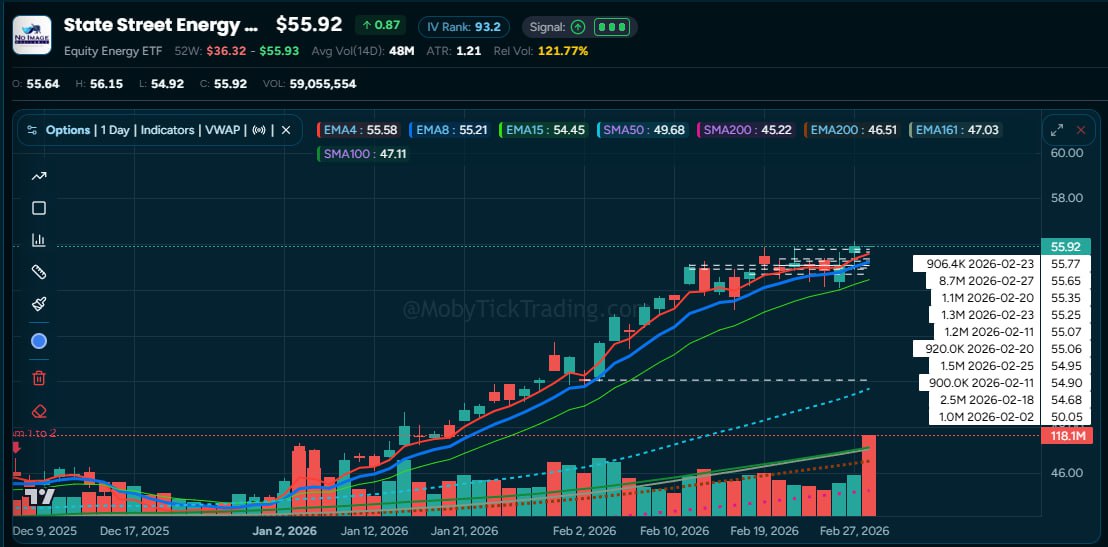
- XLE is at its 52-week high, up from $36.32. The biggest story this week: 8.7M shares at $55.65 on February 27 — $484M in a single print.
- At current price: The 8.7M print at $55.65, plus 906.4K at $55.77 (Feb 23), 1.3M at $55.25 (Feb 23), 1.2M at $55.07 (Feb 11). Institutional prints are stacking at the highs — the $55–$56 zone is packed.
- Just below: 920K at $55.06 (Feb 20), 1.5M at $54.95 (Feb 25), 900K at $54.90 (Feb 11), 2.5M at $54.68 (Feb 18). The $54–$55 zone acts as support.
- Deeper support: prints at $50–$51 from early February — the old floor.
- The bullish trigger at $56.25 would be a fresh breakout above the 8.7M print level. The bear trigger at $54 sits at the lower edge of the recent print cluster.
MRVL — Marvell Technology ($81.35)
📈 Bullish Above: $82.50 | 📉 Bearish Below: $77
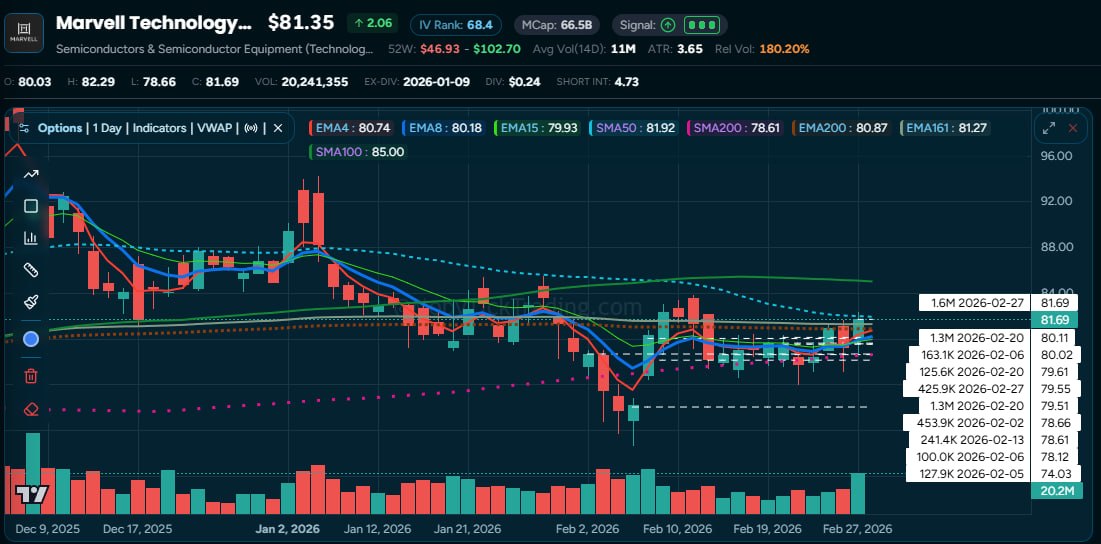
MRVL is a classic accumulation setup ahead of the March 5 earnings report. The chart shows institutions quietly building positions in the $78–$82 range:
- At current price: 1.6M at $81.69 (Feb 27) — the highest price print in the 30-day data. Institutions paying up to the top of the range right before earnings.
- Accumulation zone: 1.3M at $80.11 (Feb 20), two identical 1.25M prints at $79.51 and $80.11 on the same day (Feb 20) — $199.5M from a single institution. Plus 425.9K at $79.55 (Feb 27), 453.9K at $78.66 (Feb 2), 241.4K at $78.61 (Feb 13).
- Below: 127.9K at $74.03 (Feb 5) and 100K at $78.12 (Feb 6) — the low-water marks from early February.
- The bullish trigger at $82.50 sits just above the latest print at $81.69. A close above would confirm the breakout from this accumulation range.
- ⚠️ Earnings: March 5 after close. EPS estimate: $0.79. Revenue estimate: $2.21B. Relative volume: 180%. Short interest: 4.73%.
👀 What to Watch This Week
- Monday, March 2: ISM Manufacturing PMI
- Tuesday, March 3: No high-impact scheduled data
- Tuesday, March 4 (after close): Broadcom (AVGO) Q1 earnings — AI infrastructure bellwether
- Wednesday, March 5: ISM Services PMI
- Thursday, March 5 (after close): Marvell Technology (MRVL) Q4 earnings — our deep dive ticker. Also Costco (COST) Q2 earnings
- Ongoing: Tariff policy developments. Fed rate expectations (94.1% probability of March hold).
- Ex-dividend dates this week: GOOGL (Mar 9), META (Mar 16), WMT (Mar 20), NVO (Mar 30)
- ORCL earnings: March 9 BMO — worth tracking even though it falls outside this week’s range
🔎 Deep Dives
MRVL — Marvell Technology: Accumulation Before the Catalyst
Current: $81.35 | 30-Day DP: 14.8M shares / $1.17B / 39 entries | Earnings: March 5 after close | EPS Est: $0.79 | Revenue Est: $2.21B
Marvell Technology has been quietly accumulating dark pool prints for the past month, with activity intensifying as we approach the March 5 earnings date. The chart shows a textbook accumulation pattern — institutions have been building positions in the $78–$82 range while the stock consolidated between its 200 EMA ($80.87) and SMA50 ($81.92).
The largest prints of the period landed on February 20 — two identical 1.25 million share prints at $79.51 and $80.11 within the same session, totaling $199.5M. This kind of size and precision suggests a single institution building a position ahead of the catalyst.
Most recently, February 27 saw 1.6 million shares printed at $81.69 — the highest price point in the 30-day data set, right at the session close.
Key Institutional Levels:
- $78–$79 zone: 2.4M+ shares — accumulation floor
- $80–$81 zone: 3.4M shares — the heaviest cluster, right at current price
- $81.69: Latest print (1.6M shares Feb 27) — institutions paying up to the top of the range
- $74–$75 zone: 415K shares — the floor from early February
Marvell’s custom AI chip business (Amazon, Google custom silicon) is the key growth driver. Analysts expect 21.4% revenue growth and 31.7% EPS growth. The concentration of prints at $78–$82 ahead of the report tells us institutions are positioned.
MRVL is a great institutional setup to go long. There is increasing volume and pushing up through prints after splashing back and forth through recent prints going back to February 2nd.
Without earnings, I would look at something like this as a trade setup:
Multiply the ATR by 2.5 which is 3.65 x 2.5 about $9 and look for an option spread roughly $9 above the current price. Since it’s trading at 81.35 as of the market close, I would look at the $90 strike. Making it a call debit spread to mitigate risk, we could look at the 90/91 or 90/92 Call Debit Spread CDS and go out 2-3 months. This gives the option more time. A rule of thumb is to not pay more than 1/3 of the width of the strike. When the price crosses the first strike ($90) look at taking some profit. If the stock moves quite a bit beforehand, you can take some money off the table at your pre-defined target.
NVO — Novo Nordisk: Post-Crash — Accumulation or Capitulation?
Current: $37.49 | 30-Day DP: 20.8M shares / $853M / 17 entries | 52-Week Range: $37.65–$89.43 | Earnings: May 6 BMO
Novo Nordisk sits at its 52-week low after the CagriSema Phase 3 trial results sent the stock from $45+ to under $38 in a single session on February 23. The question: is this capitulation or accumulation?
Before the crash, institutional prints clustered at $56–$61 — a 4.0M share print at $60.79 on January 16 and a 1.8M print at $61.28 on January 20. Those positions are significantly above current price.
But since the crash, the activity has been relentless. In five trading days (Feb 23–27), institutions printed over 13 million shares in the $37–$41 range:
- Feb 23: 2.6M at $39.65, 1.5M at $40.63, 1.6M at $39.71 — $224M+ on crash day
- Feb 24: 1.6M at $38.56 — two identical 800K prints, 7 minutes apart
- Feb 25: 2.0M at $38.01, 1.6M at $38.11 — printing at the lows
Key Institutional Levels:
- $37.30 zone: 3.2M shares — current support floor
- $38.01–$38.56: 12.4M shares — the post-crash activity zone
- $39.63–$40.63: 8.3M shares — overhead from crash-day prints
- $47.79: 1.3M shares — the gap between new and pre-crash levels
The key level to watch: a strong close above $40 would suggest the post-crash prints represent accumulation. Below $37, limited institutional history below — uncharted territory. Ex-dividend March 30 ($1.86).
NFLX — Netflix: When Institutions Know First
Current: $95.57 | 30-Day DP: 67.6M shares / $5.6B / 174 entries | Earnings: April 16 AMC
Netflix had the most dramatic week of any stock in our coverage, and it serves as this week’s education piece — a real-time case study in how dark pool data reveals institutional positioning before the news hits.
The Timeline
- January 28 – February 25: Institutions print 50+ million shares in the $76–$85 range over four weeks. The largest: 4.85M at $83.20 (Jan 30), 4.87M at $76.87 (Feb 13)
- Wednesday, February 26 (market hours): 5.36M share dark pool print at $85.30 — $457 million
- Wednesday, February 26 (10:52 PM UTC / 5:52 PM ET): Bloomberg reports Netflix drops Warner Bros. Discovery bid
- Thursday, February 27: NFLX gaps from $84.59 → opens $94.30, closes $96.24 (+13.8%). Volume: 400.9M shares (436% of average)
What the Data Shows
The 5.36 million share print was not random. It was the culmination of weeks of institutional activity in the $76–$85 range — someone committed $457 million to Netflix hours before a major corporate announcement. The data was on the tape before the headlines hit.
Now look at what happened after the gap: 4.97M shares printed at $96.24 and 2.19M at $96.25 on Friday — institutions immediately establishing positions at the new level.
Key Institutional Levels
- $76–$77: 5.1M shares — the accumulation floor
- $80–$85: 23.7M shares — the primary accumulation range
- $85.30: The 5.36M share print before the news — key reference level
- $93–$96: 4.5M shares — new post-gap institutional activity
The Lesson
Institutions don’t react to news — they position ahead of it. They have the resources, the analysts, and the information flow to move before the rest of the market. Dark pool data doesn’t tell you what they know — it shows you where they’re putting their money. That’s your edge.
Charts show you the past. Dark pool data shows you what institutions are doing right now. When you see unusual size at specific price levels — especially ahead of known catalysts — pay attention. The Netflix story this week is proof that the data leads the news.
💬 Got a Ticker?
Got a ticker you want us to analyze? Reply to this email and we’ll take a look.
📩 Get This Report Every Sunday
This weekly report is completely free. Subscribe at mobyticktrading.com/weekly-report to get institutional dark pool levels, trade setups, and educational content every Sunday before the market opens.
About MobyTick Trading
MobyTick Trading provides institutional-grade dark pool and block trade intelligence to retail traders. Charts show you the past — MobyTick shows you what institutions are doing RIGHT NOW.
- 10,000+ stocks tracked in real-time
- 5+ years of historical dark pool data
- 91% accuracy rate on trade callouts
- Heatmaps, scanners, alerts, and more
🔥 Start your 7-day free trial
Disclaimer: This newsletter is for educational and informational purposes only. It does not constitute financial advice, investment recommendations, or a solicitation to buy or sell any securities. Dark pool data represents historical trades and does not predict future price movements. Always do your own research and consult with a qualified financial advisor before making investment decisions. Past performance is not indicative of future results.