Physical Address
304 North Cardinal St.
Dorchester Center, MA 02124
Physical Address
304 North Cardinal St.
Dorchester Center, MA 02124

The S&P 500 is 9% off its highs, oil is at $97, and the Nasdaq is in correction territory. We scanned 100 massive dark pool block trades from last week to answer the question everyone's asking: is this the bottom? Here's what billions in institutional money is telling us.
The S&P 500 just closed at 6,343 — now over 9% off its highs. The Nasdaq is in correction territory. Oil is hovering near $97 a barrel. And everyone’s asking the same question: is this the bottom?
At MobyTick, we don’t guess. We follow the money. And this week, the dark pool data is painting a picture that’s more nuanced than the headline panic suggests. Let’s break it down.
Before we dive into the dark pool prints, let’s set the stage. Three forces are driving this selloff simultaneously:
That’s the narrative. Now let’s look at what the institutions are actually doing with their money.
We scanned every dark pool block trade over 400,000 shares from March 24–30. There were 100 massive prints totaling tens of billions in institutional flow. Here’s where the money went:
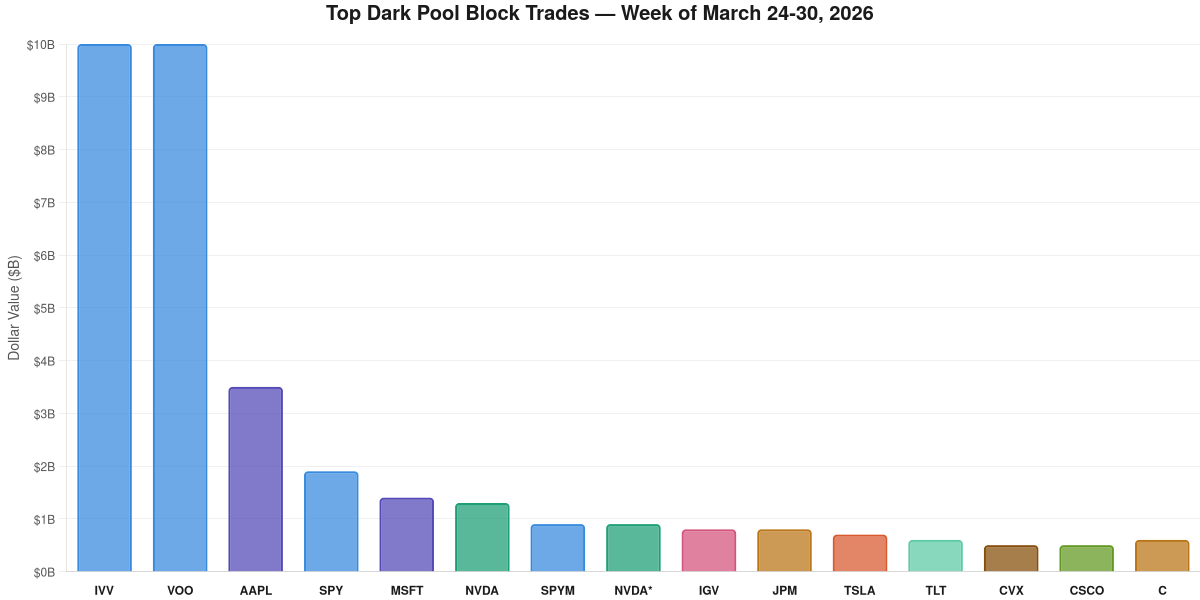
The dominant theme: index rebalancing and defensive positioning. IVV and VOO each printed approximately $10 billion on March 25th alone — these are massive institutional index reconstitution flows. But the individual stock prints tell a more interesting story.
But here’s the signal buried in the noise: look at the defensive flows. TLT (long-term bonds) printed $561M. BIL (T-bills) printed $532M. AGG (aggregate bonds) printed over $1.2B across multiple days. Institutions are hedging. They’re active in equities and parking cash in safety trades simultaneously.
This is where it gets really actionable. MobyTick’s ray system identifies the specific price levels where institutions have placed large block trades, creating support and resistance zones that technical analysis alone can’t see.
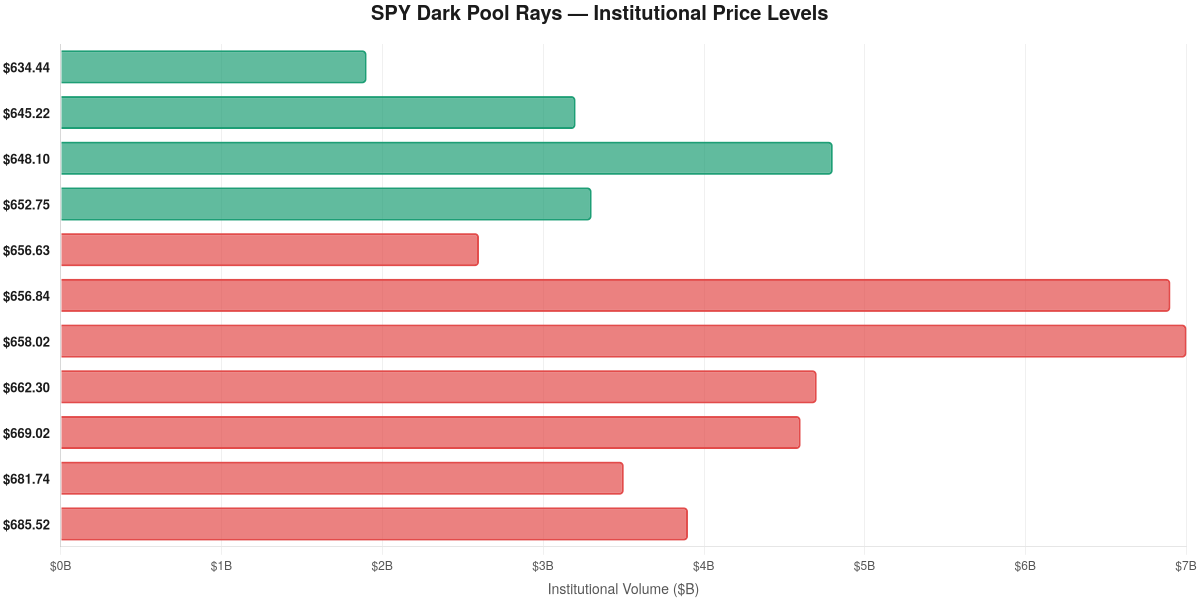
The verdict: 16 out of 20 SPY rays are broken.
That tells you how violent this decline has been. Institutions put money to work at $685, $681, $669, $662, $658, $656 — and price has sliced through every single one of those levels. Those broken rays now act as overhead resistance. Any rally attempt will face institutional sellers looking to get out at breakeven.
| Level | Volume | Status | Significance |
|---|---|---|---|
| $634.44 | $1.9B | ✅ Holding | Immediate dark pool support — Monday’s institutional floor |
| $645.22 | $3.2B | ✅ Unbroken | First major overhead resistance |
| $648.10 | $4.8B | ✅ Unbroken | Heavy overhead — key to any recovery |
| $652.75 | $3.3B | ✅ Unbroken | Upper resistance ceiling |
| $656.63 | $2.6B | ❌ Broken | Former support turned resistance |
| $658.02 | $7.0B | ❌ Broken | Massive broken level — strong resistance |
The critical level is $634.44. This is fresh support from March 30th with $1.9 billion in institutional volume behind it. As long as this level holds, the dark pool data suggests institutions are drawing a line in the sand here.
Here’s the week mapped out — daily highs and lows against the key dark pool levels:
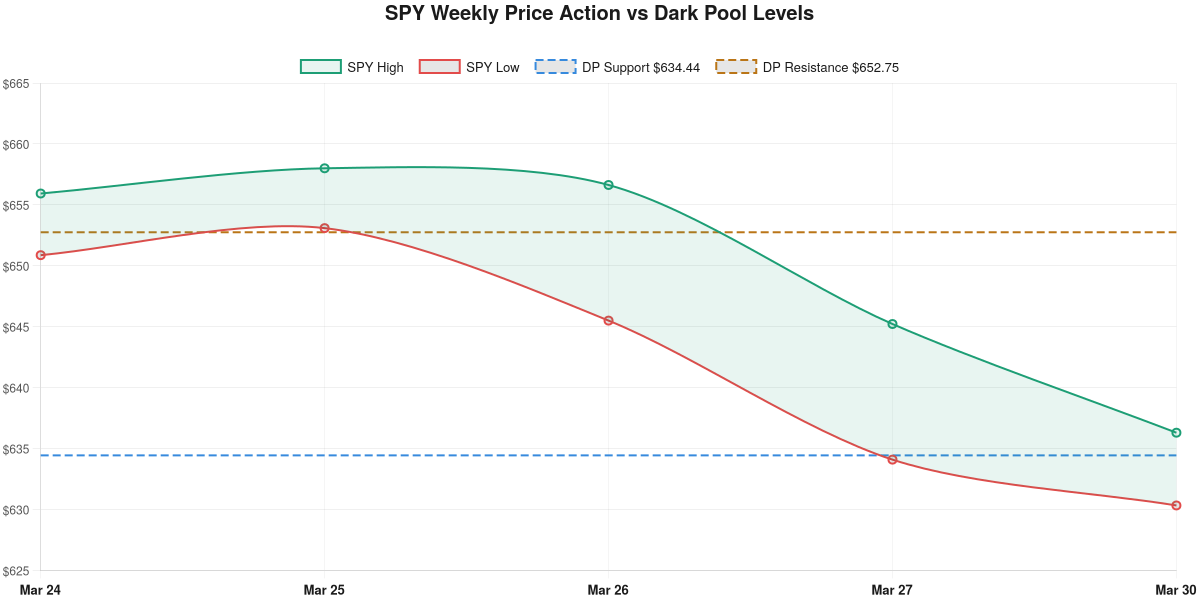
Notice the pattern: each day’s range is compressing toward the $634.44 support. Monday’s (March 24) range was $650–$656. By Thursday (March 27), it had dropped to $634–$645. Monday March 30 tightened further around $630–$636. Price is being funneled toward a decision point.
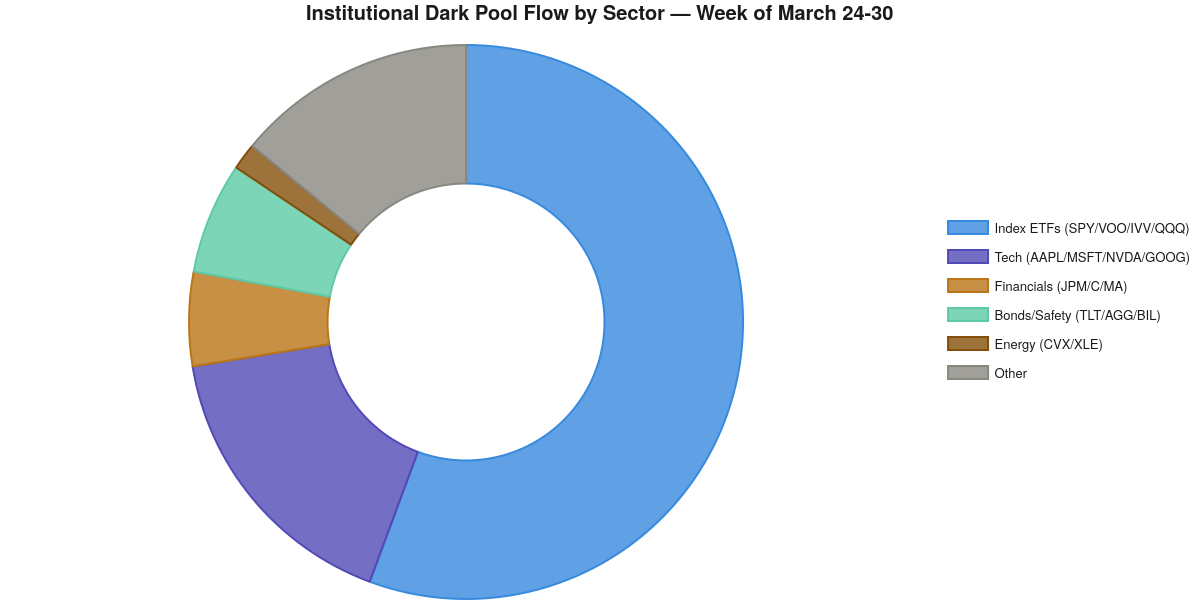
Beyond individual trades, the sector-level view reveals the institutional positioning strategy:
Two names deserve special attention because they’re telling a story about tech and risk appetite:
NVDA has 19 out of 20 rays broken. The only support level is Monday’s $165.17 ($355M print). Every other institutional entry from $177 down to $172 has been broken. This stock is in a free fall through dark pool support — institutions have been catching falling knives all month. NVDA is now in official bear market territory, down over 21% from highs.
QQQ is even more alarming. All 20 rays are broken except one at $562.66, and the current price ($561.15) is already testing below it. If this level breaks, there is no dark pool support below in the recent data. Watch this like a hawk.
Here’s our honest take, based strictly on what the dark pool data is telling us:
We’re not at the bottom yet, but we’re approaching an institutional accumulation zone. The dark pool data shows institutions testing price levels and building positions — but they’re doing it with one foot out the door (hence the bond activity). The April 6th deadline is the catalyst that will determine whether $634 holds or we get a flush toward $600.
The dark pool doesn’t lie. It doesn’t trade on emotion or headlines. It shows you where billions of dollars are being placed by the world’s largest institutions — and right now, they’re telling us they see value at these levels, but they’re not yet confident enough to go all-in.
That’s the kind of signal that typically precedes a bottom — but the “when” depends entirely on the geopolitical resolution. Until then, watch the rays, follow the prints, and let the institutions show you the way.
Want real-time dark pool data and institutional price levels for every stock? Start your MobyTick trial today and see what the smart money sees.
Data sourced from MobyTick’s proprietary dark pool database covering 10,000+ stocks with 5+ years of historical block trade data.