Physical Address
304 North Cardinal St.
Dorchester Center, MA 02124
Physical Address
304 North Cardinal St.
Dorchester Center, MA 02124

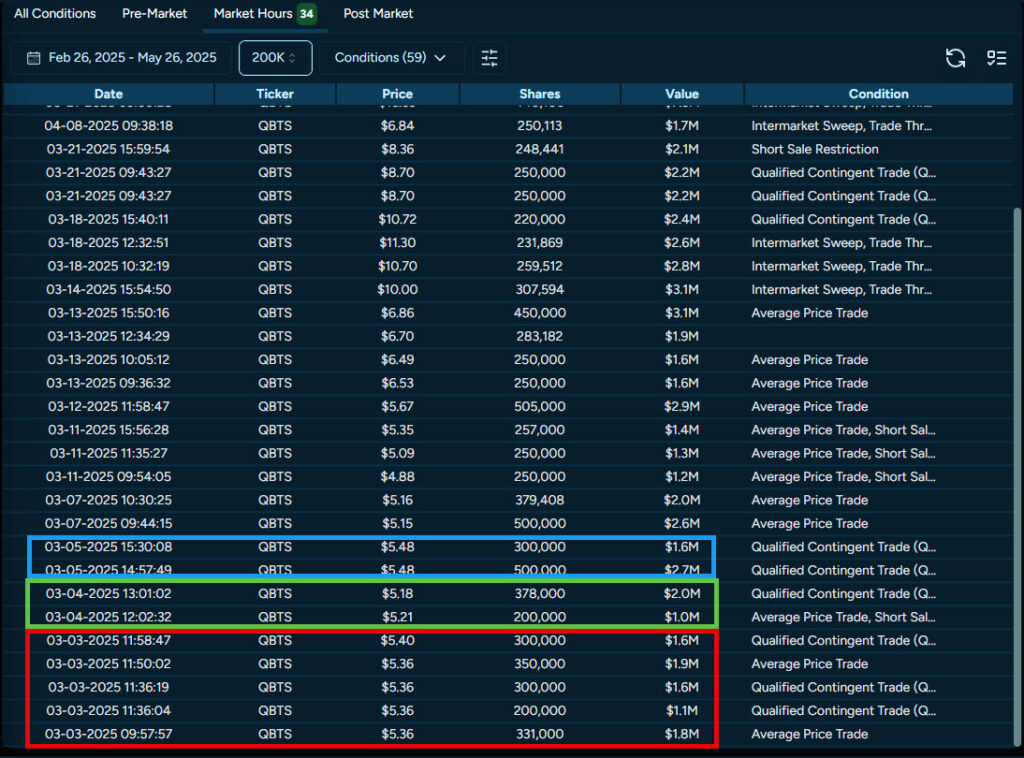
March 3rd, 2025. While most retail traders were focused on the latest market headlines and social media chatter, something extraordinary was happening in the shares of Quantum Computing Inc. (QBTS). Between 10am and noon, 1.48 million shares came across the tape in 5 transactions totaling $8 million. The next day, another 578,000 shares totaling $3 million. On March 5th, another $4.3 million. From the table below, you can see the institutional interest.
Most retail traders never even noticed. Those who did probably dismissed it as “just another big trade.” But for traders who understand how to read institutional footprints, this print was a flashing neon sign pointing toward a phenomenal trade setup with enormous profitability.
Within 79 days, the stock hit a high of 19.77 as more institutional trades came in and had generated over 300% returns for traders who knew how to position around it. A $1,000 investment turned into $4,000. A $5,000 position became $20,000. The smart money had spoken, and those who listened were rewarded handsomely, and that’s just trading the stock.
This is the complete story of how institutional intelligence and technical analysis combined to create a textbook example of retail traders profiting alongside the big money. More importantly, it’s a blueprint you can use to identify and capture similar opportunities in your own trading.
To understand why these prints were so significant, you need context. Quantum Computing Inc. isn’t Apple or Microsoft – it’s a small-cap stock that doesn’t typically see this level of institutional activity. When institutions move 1.48 million shares in a single morning totaling $8 million, they’re making a serious statement about their conviction.
This wasn’t a casual investment decision. This was strategic positioning by sophisticated money managers who had done their homework and were committed to building a substantial position. The scale tells us everything we need to know about their conviction level.
The Print Breakdown:
But here’s what separates profitable traders from the crowd: recognizing that this level of institutional activity doesn’t happen in a vacuum. Smart money doesn’t deploy $15 million into a small-cap stock without expecting significant returns. They had information, analysis, or catalysts that retail traders didn’t possess.
What made this setup so powerful wasn’t just the institutional prints – it was where they occurred. Looking at the QBTS daily chart, the March accumulation happened at a critical technical confluence that every experienced trader dreams of finding.
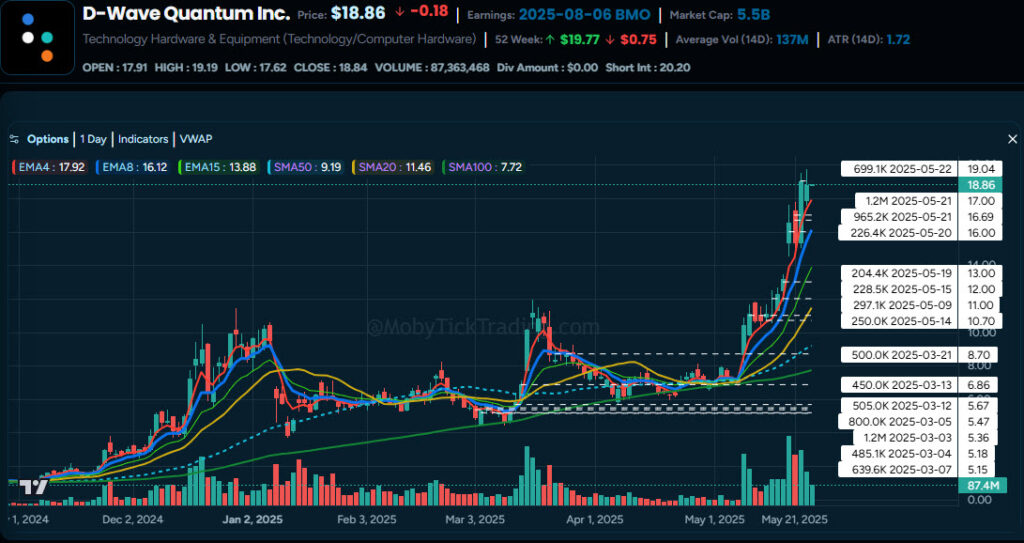
The Technical Foundation: The stock had pulled back to a major support level around $5.00, right at the 100-day Simple Moving Average. This wasn’t just any pullback – it was a test of one of the most respected long-term trend indicators in technical analysis.
The Timeline That Told the Story:
March 3-5: The Institutional Accumulation Phase
March 6-31: The Patience Test
May 8: The Catalyst Arrives
May 8-22: The Parabolic Phase
This timeline reveals the crucial lesson: institutional accumulation at key technical levels often precedes major moves, but patience is required while the setup develops.
Understanding institutional flow is only half the battle – execution separates profitable traders from those who just have good information. Here’s exactly how a disciplined trader would have approached the QBTS setup.
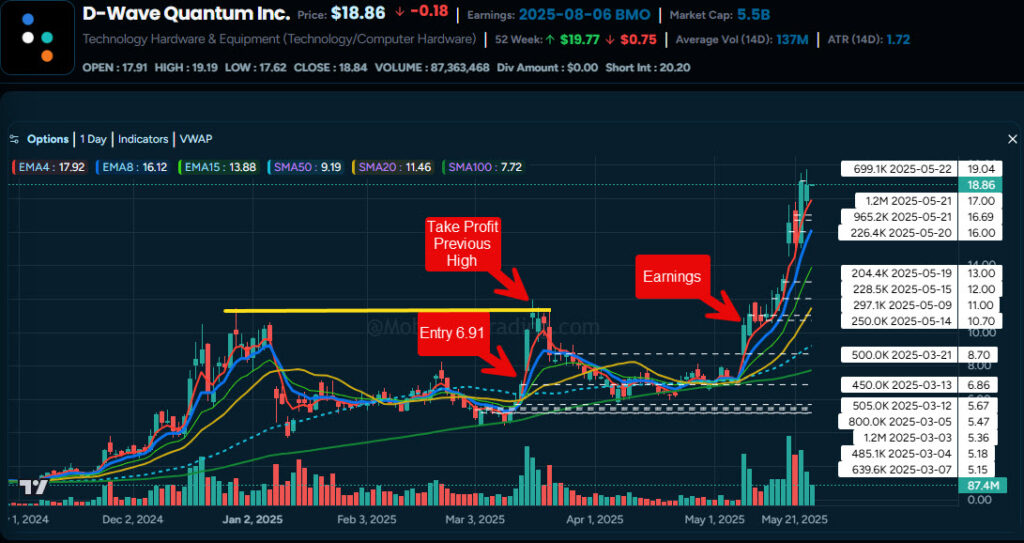
The Entry Strategy: End-of-Day Patience as a swing trader After watching the institutional accumulation complete and the sideways consolidation play out, the entry signal came on March 13th. Rather than chasing the breakout during market hours, experienced swing traders wait for the final minutes of the trading session to enter positions.
Why the closing minutes matter:
The Actual Entry:
Position Management: The Art of Taking Profits The initial move toward $11 provided the first profit-taking opportunity. Smart traders don’t get greedy – they secure partial profits at logical resistance levels, knowing that:
The Patience Test Continues: When QBTS failed to hold the $11 level and pulled back to the 100 SMA, this tested trader discipline. Those who had taken partial profits could afford to be patient through the consolidation, or could have exited the rest of their position on the initial breakdown from resistance.
No matter how compelling a setup appears, risk management remains paramount. The QBTS trade had several potential failure points that every trader must acknowledge.
Scenario 1: The Institutional Thesis Fails If the stock had broken below the institutional print levels around $5.00, it would have invalidated the entire setup. This represents approximately $2.00 of risk from the $6.91 entry – a manageable loss for most trading accounts.
Scenario 2: The Splash Continues Institutional accumulation sometimes takes much longer than anticipated. If QBTS had continued sideways for months instead of weeks, opportunity cost would have mounted while capital remained tied up in a non-performing position.
Scenario 3: Market-Wide Correction Even the best individual setups can be overwhelmed by broader market conditions. A significant market correction could have dragged QBTS down regardless of institutional support.
The Risk Management Reality: Professional traders accept that even 5-star setups can fail. The key is ensuring that when you’re right, the profits significantly outweigh the losses when you’re wrong.
March 3-5: Institutional Accumulation Phase
March 6-12: The Consolidation
March 13: The Breakout Signal
March 14-April: First Profit Wave
May 8: The Catalyst Arrives
May 8-22: The Parabolic Phase
1. Patience Pays Compound Interest The biggest profits come to those who can wait through institutional accumulation and consolidation phases. The 79 days from initial prints to peak required genuine patience, but delivered 300%+ returns.
2. Risk Management Is Non-Negotiable
Even with institutional backing and technical confluence, the trade could have failed. Proper position sizing and stop placement ensure survival to trade another day.
3. Take Profits at Technical Levels Previous highs, round numbers, and major moving averages provide logical profit-taking zones. You can always re-enter if the momentum continues.
4. Avoid the Institutional Splash Large prints don’t signal immediate moves. The most profitable approach is often waiting for accumulation to complete before positioning.
5. Price Action Validates Institutional Intelligence The retests of print levels ($5.36 support, $6.86 consolidation) confirmed these as legitimate institutional zones. These levels often provide future entry or exit opportunities.
6. Institutions Buy Strength, Not Just Weakness The continued institutional buying from $11 to $19 shows that smart money doesn’t just buy bottoms – they add to winning positions throughout uptrends.
The Ultimate Lesson: When institutional flow aligns with technical analysis at key support levels, the combination creates some of the highest-probability setups in the market. But only disciplined execution and patient capital management convert this intelligence into consistent profits.
The QBTS opportunity was there for anyone to see – if they knew where to look. But here’s the reality most retail traders face: How do you systematically identify these setups among thousands of stocks trading every day?
The Manual Approach Problems:
The Time Factor: Even if you had unlimited time to research, the QBTS setup required monitoring:
For a working trader managing multiple positions, this level of analysis across thousands of stocks simply isn’t feasible – until now.
What took us an entire case study to analyze – the institutional accumulation, technical confluence, and complete trade timeline – can now be identified in seconds, not hours.
The Opportunities Scanner: Instead of manually searching through 10,000 stocks, Moby Tick’s Opportunities section automatically identifies:
The Print Lookup Feature: Don’t just see that institutional activity occurred – see the complete picture:
The QBTS Discovery Process – Then vs. Now:
Traditional Method: Hours of manual research
Moby Tick Method: Minutes to setup identification
Why Traders Choose Moby Tick:
“In my first time using Moby Tick I was able to spot a massive dark pool print that came in premarket. The day after I traded that stock and made enough profit to pay for 3 years’ worth of Moby Tick platform. I was so impressed that I saw the value of this platform right away.”
– Iris C., Verified Customer
Stop spending countless hours searching for setups like QBTS while the institutional money moves on to the next opportunity. Join the traders who are already using systematic institutional flow analysis to identify high-conviction trades before they become obvious to the market.
The QBTS trade delivered 300%+ returns over 79 days, just on the stock. How many similar opportunities are you missing while manually scanning charts?
[Start Your 7-Day Free Trial – Complete Access to All Features →]
Discover exactly how institutional money is positioning across 10,000+ stocks with complete Print Lookup capabilities and automated Opportunities scanning. See why traders are calling Moby Tick “the software I can’t trade without.” Cancel anytime during your trial – no risk, just results.
Ready to find your next institutional-backed breakout in minutes instead of months?
Your 7-day trial includes everything: Opportunities Scanner, Print Lookup, technical integration, real-time alerts, and complete access to institutional flow data. Start identifying 5-star setups today.