Physical Address
304 North Cardinal St.
Dorchester Center, MA 02124
Physical Address
304 North Cardinal St.
Dorchester Center, MA 02124

What You’ll Learn (15-minute read)
This comprehensive guide reveals how to build a profitable trading strategy by following institutional money flow instead of fighting it. You’ll discover:
✓ Real proof with specific trades: How following a $285M institutional print led to 300%+ returns in 10 days (UNH case study with exact entry/exit points)
✓ Pattern recognition framework: The exact specifications that signal genuine institutional conviction (3+ prints of 400K+ shares within specific price ranges)
✓ Time-saving system: How to scan 10,000+ stocks in under 10 seconds versus 83+ hours of manual chart review
✓ Complete strategy blueprint: Step-by-step process from filtering opportunities to entry timing, risk management, and realistic performance expectations
✓ Historical data advantage: Why 5+ years of institutional data provides context that today’s price action alone cannot reveal
Who this is for: Traders who want actionable, data-driven strategies backed by institutional positioning—not get-rich-quick schemes or vague technical analysis.
Time investment: 15 minutes to read, potentially 840+ hours saved annually in your trading practice.
In the world of trading, success often comes down to one critical advantage: knowing where the big players are positioning their capital before the rest of the market catches on. While retail traders scramble to interpret headlines and social media sentiment, institutional investors quietly accumulate or distribute positions worth millions of dollars through dark pools and off-exchange transactions. The question isn’t whether smart money moves markets—it’s how you can identify and capitalize on these movements before they become obvious to everyone else.
Here’s the reality: manually scanning charts, reading endless news articles, and trying to interpret market movements after they happen is not only exhausting—it’s inefficient. What if you could filter through 10,000+ stocks in seconds to find exactly where institutions are positioning millions of dollars? What if you could see 5+ years of historical institutional data revealing the actual support and resistance levels that matter?
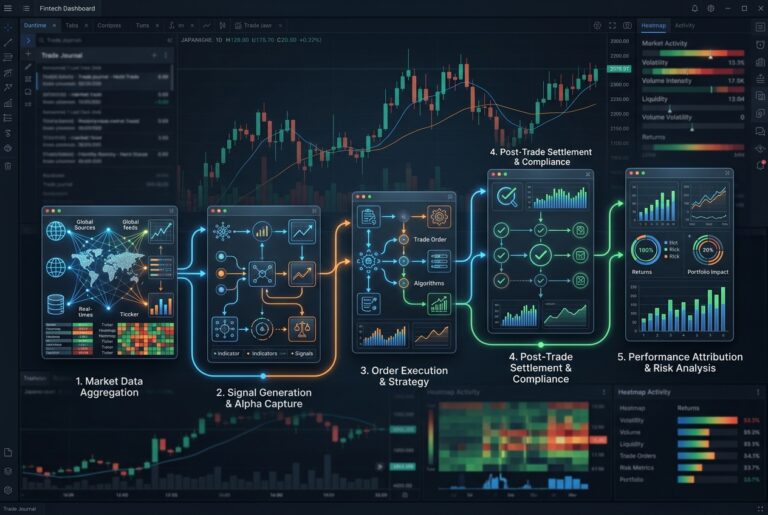
Building a trading strategy around smart money flow transforms you from a reactive trader chasing price movements to a proactive strategist positioning alongside the institutions that actually move markets. Here’s how to construct a robust strategy that leverages institutional order flow data to gain a legitimate edge in today’s markets.
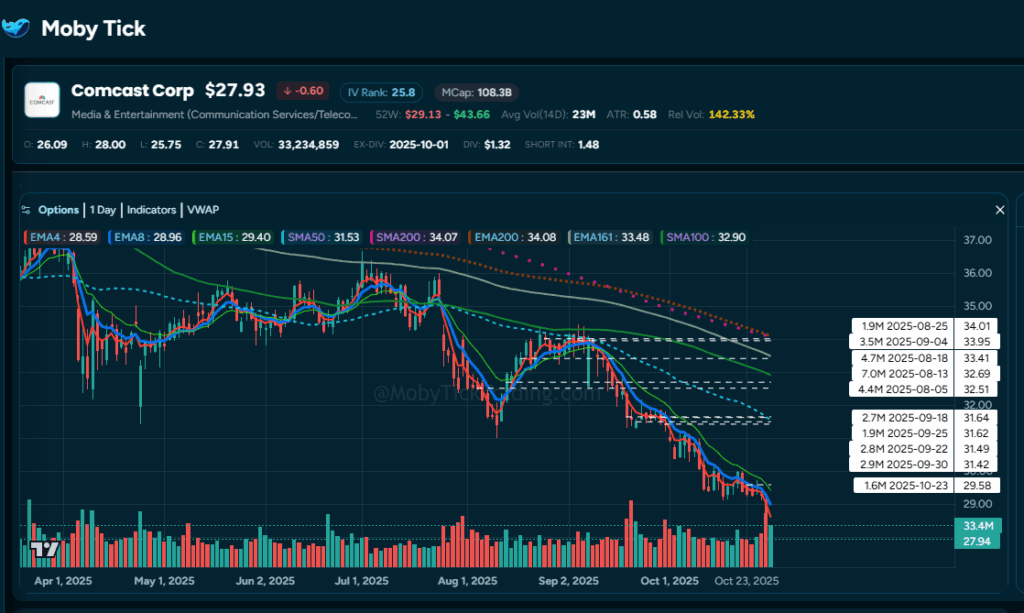
Understanding the Foundation: What Is Smart Money Flow?
Smart money flow refers to the movement of capital by institutional investors, hedge funds, market makers, and other sophisticated entities with deep pockets and insider knowledge. These players don’t trade based on Twitter rumors or CNBC headlines—they conduct thorough research, have access to superior data, and position themselves well in advance of major price movements.
The challenge for retail traders has always been visibility. Institutions deliberately execute their largest trades in dark pools specifically to avoid tipping their hand to the broader market. However, while these trades happen away from public exchanges, they leave footprints—block trade prints that reveal where billions of dollars are being positioned.
The key principle: Institutions accumulate during negative sentiment and distribute during positive sentiment. Price moves first, then news explains why.
Real-World Proof: The UNH Trade
Let’s examine a real trade that demonstrates the power of following institutional flow:
The Setup (Mid-July 2025)
UnitedHealth Group (UNH) showed massive block trades totaling hundreds of millions of dollars between $295-$317 over several weeks—clear institutional accumulation. On July 15th, UNH broke below this zone at $291.71 with increasing volume. This wasn’t random—institutions were finished accumulating and beginning to distribute. The stock plummeted to $237.77 by August 1st—a devastating $54 drop.
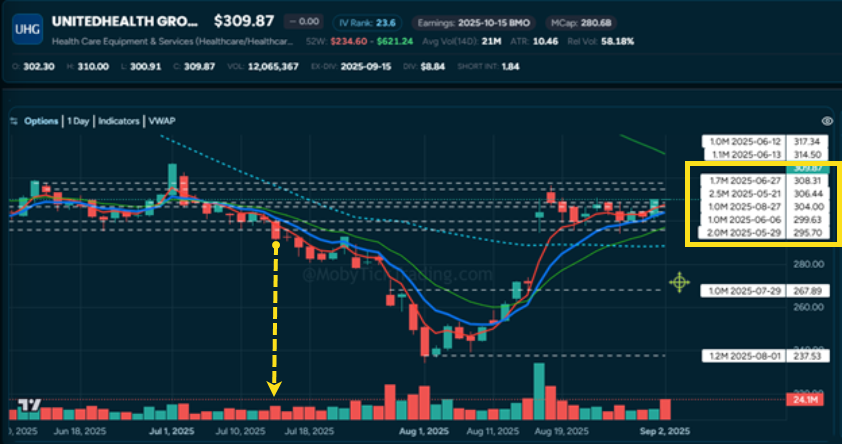
The Accumulation Signal (August 1)
At $237.53, a massive 1.2 million share trade hit the dark pools—valued at $285 million. This wasn’t panic selling; this was calculated accumulation by someone with extremely deep pockets while retail sentiment reached peak pessimism.
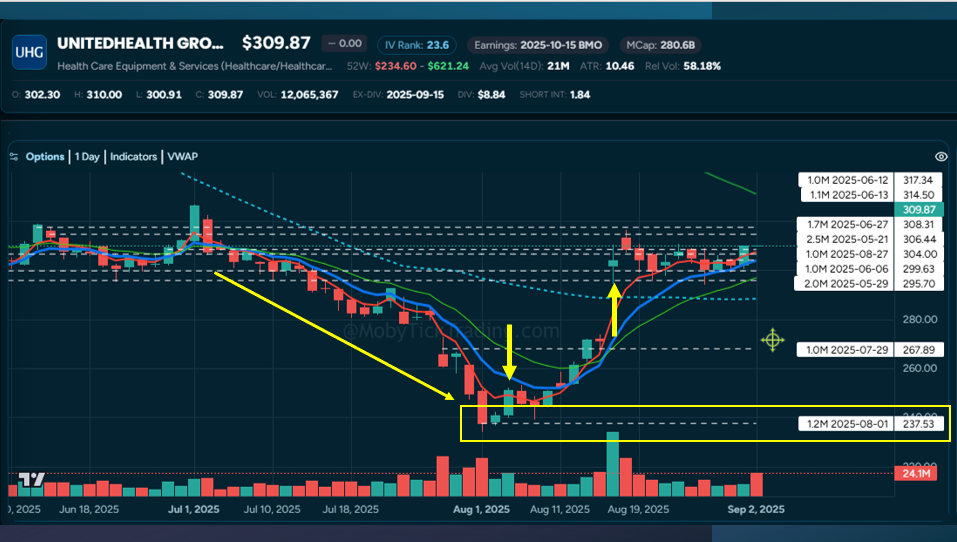
The Payoff (August 15)
Ten days after savvy traders following institutional flow entered long positions, UNH gapped up $32.52 on news that Warren Buffett’s Berkshire Hathaway had invested $1.4-1.6 billion in the company. Traders following institutional positioning captured gains exceeding 300% while retail investors who sold into the earlier panic were left behind.
The Lesson: The institutional footprints were visible weeks before the announcement. By the time retail traders reacted to headlines, institutions had already positioned—and those tracking the flow were positioned right alongside them.
For the full details on this trade, check out our article on Following Institutional Money Flow: The Market Edge Retail Traders Miss.
Step 1: Learn to Read Institutional Patterns
Understanding what you’re looking at is crucial. Here’s how to identify genuine institutional conviction:
What Constitutes a “Cluster”?
A meaningful cluster typically shows:
Example Pattern:
This shows institutions consistently buying in the $126.80-$128.00 range—that zone becomes significant support.
Accumulation vs. Distribution
Accumulation signals:
Distribution signals:
Timeframe Matters
Match print size to your trading style:
Step 2: Filter and Focus—From 10,000 to 10 in Seconds
With over 10,000 stocks trading daily, you can’t manually scan every chart for institutional activity.
Traditional Manual Scanning:
The Smart Approach:
Practical Filtering Strategy
Start broad, then narrow:
Initial Filter: Stocks showing 400K+ share prints in last 30 days → ~200-300 stocks
Price Action Filter: Stocks up on the day and above recent institutional clusters for long entries (down on the day and below prints for short entries) → ~80-100 stocks
Technical Alignment: Stocks at key moving averages or support/resistance → ~30-40 stocks
Timeframe Match: Select based on your trading style → 10-15 high-probability setups
Real-World Example: Monday morning, you filter for stocks showing 1M+ share prints in the last 14 days, currently trading above those print levels, and showing bullish technical patterns. Within 10 seconds, you have several candidates. You review them in 15 minutes and identify your potential setups.
What would have taken an entire weekend of research now takes less time than brewing coffee.
For a deeper understanding of how these indicators work, check out our guide on Understanding Block Trade Indicators and Dark Pool Prints.
Step 3: Combine Smart Money with Technical Analysis
Smart money data isn’t meant to replace technical analysis—it’s meant to enhance it. The most powerful setups occur when institutional flow aligns with technical patterns and key price levels.
The Confluence Approach
Highest probability setups require 3+ confirmations:
Example Setup:
Entry: Above $129 with stops below $126.50
Risk: $2.50 per share
Target: Previous high at $142
Reward: $13+ per share
Risk-Reward Ratio: 1:5+
When Signals Conflict
Step 4: Time Your Entries and Manage Risk
Understanding where institutions are positioned is valuable, but timing and risk management determine your profitability.
Entry Timing Strategies
Conservative Entry (Higher win rate, lower risk-reward):
Aggressive Entry (Lower win rate, higher risk-reward):
Scaled Entry (Balanced approach):
Stop Placement Principles
Never place stops exactly at institutional print levels—Institutions test these zones. Place stops 1-2% below accumulation clusters.
Use ATR (Average True Range) for context—If ATR is $3, don’t place stops $1 below institutional zones. Give the trade room based on volatility.
Time-based stops—If the setup doesn’t play out in your expected timeframe, exit regardless of price.
Position Sizing Based on Conviction
When Institutional Zones Fail
Critical Rule: When price breaks below major institutional accumulation with volume, don’t average down—exit immediately.
Zones fail because institutions were early, market conditions changed, or new information altered their thesis. When institutional levels break with volume, stops cascade and moves accelerate. Honor your stops without hesitation.
What to Expect (And What to Avoid)
Top 3 Mistakes
Realistic Performance Expectations
Win rates with proper execution:
You don’t need a 90% win rate. A 60% win rate with 1:3 risk-reward ratios is extremely profitable.
Setup frequency:
Realistic annual returns:
Market Context Matters
Not all conditions are equal:
Putting It All Together: A Real-World Example
Let’s walk through how a smart money flow strategy works in practice:
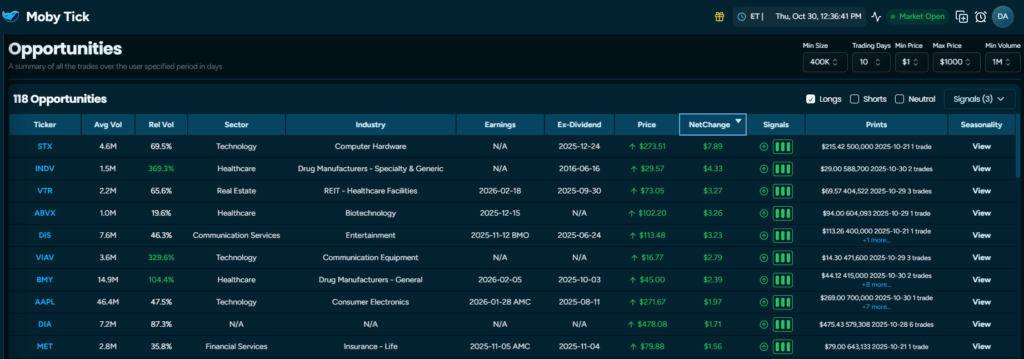
Monday Morning: Finding Opportunities (10 minutes)
You start your trading week by logging into Moby Tick and accessing the Opportunities section. You apply the filtering strategy from Step 2 with your preferred parameters, and the platform scans 10,000+ stocks, returning 45 candidates showing significant institutional activity. You apply additional technical filters and narrow to 12 high-probability setups.
Monday Afternoon: Setup Analysis (15 minutes)
You review your 12 candidates for:
Three setups meet all criteria. You add them to your watchlist.
Mid-Week: The Alert (5 minutes daily monitoring)
Wednesday morning, you receive an alert: Three separate institutional block trades totaling 650,000 shares just printed in one of your watchlist stocks at $127.50—right at a technical support level you identified.
You pull up the Print Lookup feature to analyze the full institutional picture:
The Setup:
Wednesday Afternoon: Entry Execution
Price moves above $128.50 on strong volume. You enter 285 shares at $128.75, placing your stop at $124.50.
Week 2: Trade Management
Week 3: Exit Strategy
Result: Within two weeks, your initial risk of $1,000 turned into $2,621 realized profit on the first exit, with 71 shares still running.
Total Time Investment:
Compare this to manually scanning charts for 10+ hours and potentially missing the opportunity entirely.
Leveraging Technology: The Moby Tick Difference
Building a successful smart money flow strategy requires access to real-time institutional data and the tools to analyze it efficiently.
The Data Advantage: 5+ Years of Institutional Intelligence
Access to historical institutional data dating back to January 2020 means you’re not just seeing today’s activity—you’re understanding long-term patterns. This historical depth allows you to:
Key Platform Capabilities
1. Print Lookup Feature
Search across 10,000+ stocks and ETFs instantly to find institutional activity. Generate custom lists based on minimum block trade sizes, specific date ranges, single ticker deep-dives, or multi-ticker monitoring.
2. Real-Time Block Trade Indicator (BTI)
Monitor live institutional trades as they happen across all timeframes. The BTI provides conviction-level institutional trading signals the moment they occur—not hours or days later.
3. One-Click Trade Setup Identification
The platform’s watchlists and market dashboard provide instant visibility into stocks showing fresh institutional accumulation, with real-time updates throughout the trading day and pre-filtered opportunities based on your criteria.
Time Savings in Action
Consider your typical trading preparation:
That’s 2+ hours back in your day—every single trading day. Over a year, that’s 500+ hours saved.
As outlined in our Be Richer philosophy, successful trading isn’t just about making money—it’s about building a sustainable approach that enhances your entire life. By following institutional positioning rather than constantly consuming news, you save significant time and mental energy.
Conclusion: Work Smarter, Trade Better
The difference between consistently profitable traders and those who struggle isn’t work ethic or hours spent analyzing charts—it’s having access to the right information and knowing how to act on it efficiently.
The Math Is Simple:
That’s the equivalent of 105 full workdays you’re getting back—time you can spend with family, building other income streams, or simply enjoying life.
By building your strategy around smart money flow and leveraging platforms with 5+ years of historical institutional data across 10,000+ stocks, you shift from fighting against institutional players to following their lead. You’re not smarter than hedge funds with teams of analysts—but you can be just as informed about where they’re positioning their capital.
Stop guessing where the market might go based on lagging indicators and start positioning where the smart money is already committed. The institutions aren’t psychic—they simply do their homework, position accordingly, and the market follows. By tracking their footprints through dark pool data and block trades, you get a front-row seat to market movements before they unfold.
The question isn’t whether smart money moves markets—it demonstrably does. The real question is: Are you going to keep trading blind and exhausted, or are you ready to see what the institutions see while reclaiming hundreds of hours of your life?
Ready to transform your trading by following institutional footprints instead of fighting them? Start your 7-day free trial and discover how institutional intelligence can change your trading and your life.
Summary
Ready to transform your trading by following institutional footprints instead of fighting them? Explore how Moby Tick Trading can provide the smart money insights you need to trade with confidence while reclaiming your time.