Physical Address
304 North Cardinal St.
Dorchester Center, MA 02124
Physical Address
304 North Cardinal St.
Dorchester Center, MA 02124
category: Trading
tags:
Estimated Reading Time: 8 minutes
TL;DR: Institutional "smart money" hides 40% of its trading volume in dark pools to avoid moving the market. By the time the retail crowd sees a price move, the institutions have already positioned themselves. This guide reveals a professional 5-step framework to detect these hidden prints, filter the noise using the Moby Tick Block Trade Indicator, and execute trades alongside the world’s largest hedge funds.
Retail traders are often fighting with one hand tied behind their backs. While you’re staring at a 5-minute candle and a basic RSI indicator, institutional desks are moving hundreds of millions of dollars through "dark pools": private exchanges designed to keep their intentions hidden from the public eye.
In 2026, the game has only become faster. If you aren't tracking institutional money flow, you aren't seeing the full picture. You are trading based on a fraction of the available data.
To win in today's market, you need to master how to read dark pool prints. These prints are the "footprints" left behind by whales. At Moby Tick Trading, we specialize in making this "hidden" data visible in real-time. Here is the exact framework our top-tier traders use to identify institutional positioning and turn it into a profitable day trading strategy.
The first step in understanding dark pool data is knowing what to look for. Not every off-exchange trade is significant. A $50,000 trade in Apple (AAPL) is noise; a $150 million block trade is a signal.
Institutions use dark pools specifically to execute large orders without causing a massive spike or drop in the "lit" markets (like the NYSE or NASDAQ). When these trades are finally reported to the tape, they appear as "prints."
What to look for:

The biggest problem with dark pool data is the sheer volume of information. If you try to read the raw tape, you’ll be buried in thousands of meaningless transactions. Speed is your competitive advantage here. You need to identify the "smart money" within seconds, not hours.
This is where Moby Tick’s real-time detection comes into play. Our Block Trade Indicator filters out the small retail trades and highlights only the high-conviction institutional moves.
Why real-time filtering matters:
By filtering the noise, you reduce "analysis paralysis" and focus only on the trades that have the power to move the market.
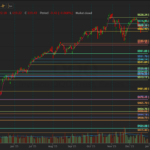
A dark pool print is not just a data point; it is a psychological and financial anchor. When an institution buys $200 million worth of a stock at $150.00, that price level becomes incredibly important.
If the price stays above the print, that institution is in profit, and they will likely defend that level as support. If the price drops below a massive sell print, that level becomes heavy resistance.
How to map the level:
Using our Interactive Dashboard, you can visualize these levels across different timeframes to see exactly where the "big money" is clustered.

Never trade a dark pool print in a vacuum. The most successful day trading strategy involves looking for "convergence": when multiple indicators point to the same conclusion.
If you see a massive $100M dark pool buy print (Equity), you should immediately check the broader tape. Is volume expanding on the lit exchange? Is price accepting above the institutional level? When the print, price action, and volume agree, the probability of follow-through jumps.
Checklist for Convergence:
The final step is execution. The goal isn't to buy the exact moment a print hits the tape: it's to buy when the market confirms the institution's direction.
The Entry Strategy:
By using this 5-step framework, you stop guessing where the market is going and start following the players who actually have the capital to move it.

In the world of day trading, information has a half-life. A dark pool print discovered 30 minutes late is often useless because the move has already happened.
Moby Tick Trading was built for the time-constrained professional who needs an "edge" without spending 12 hours a day staring at a terminal. Our software does the heavy lifting:
Stop trading in the dark. Whether you are looking for ETF analysis tools or real-time block trade alerts, we provide the institutional-grade data you need to compete.
The difference between a struggling trader and a professional is the quality of their data. Join the elite group of traders who use Moby Tick to track the smart money.
Don't let the institutions hide their hand. Master how to read dark pool prints and start trading with clarity. 📈