Get institutional levels on your chart in 2 minutes
What You’ll Learn
This guide gets you from zero to seeing dark pool levels on your TrendSpider chart as fast as possible. No fluff — just the essentials to get started.
Step 1: Add the Indicator after purchase
- Open any chart in TrendSpider
- Click the Indicators button (or press
I) - Search for “Dark Pool Levels” by MobyTick
- Click to add it to your chart
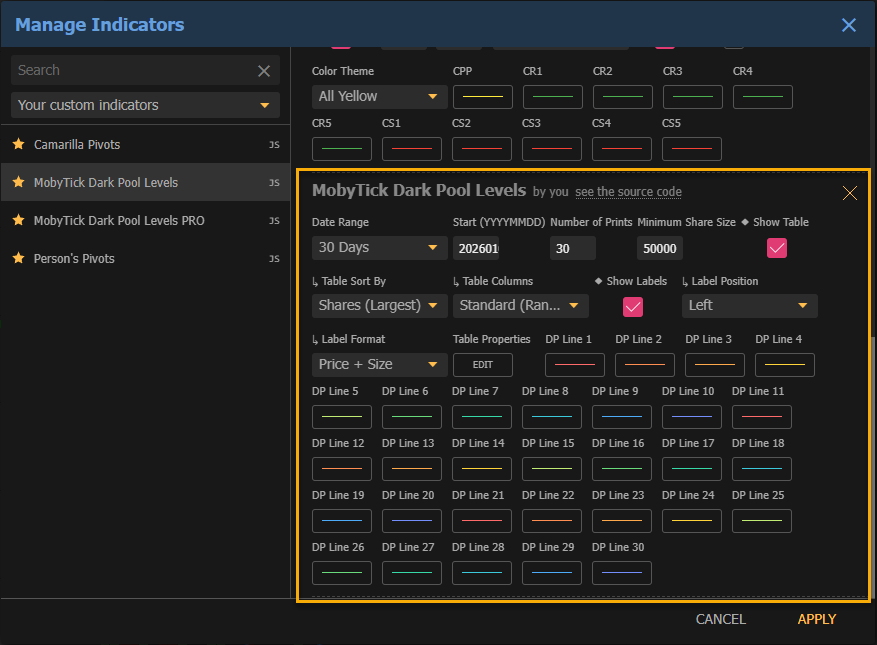
- Review initial settings and click Apply
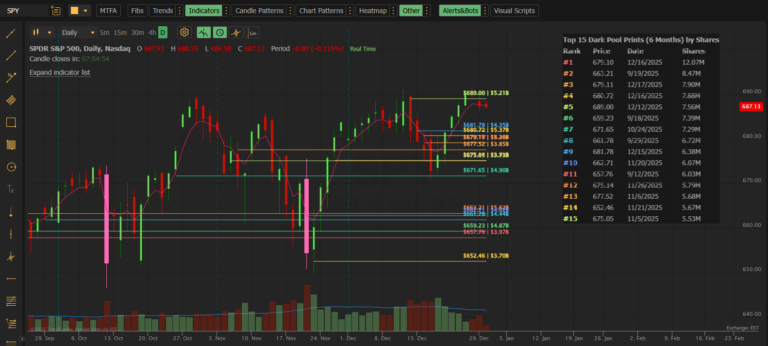
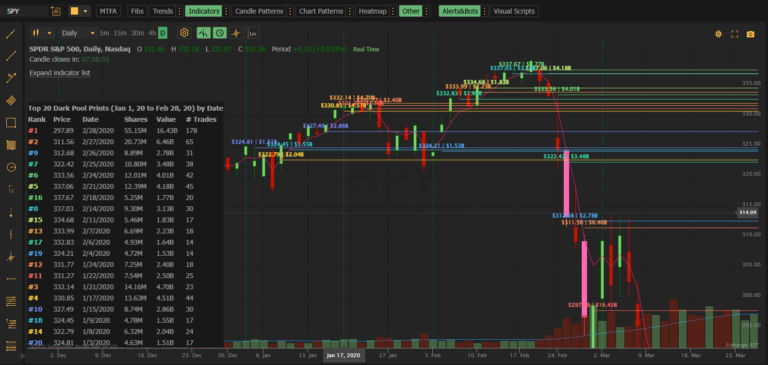
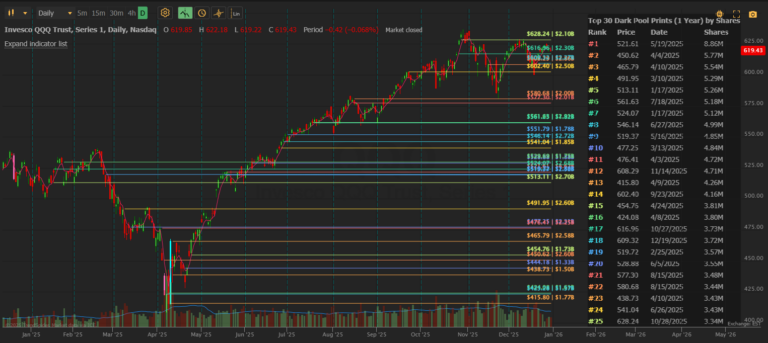
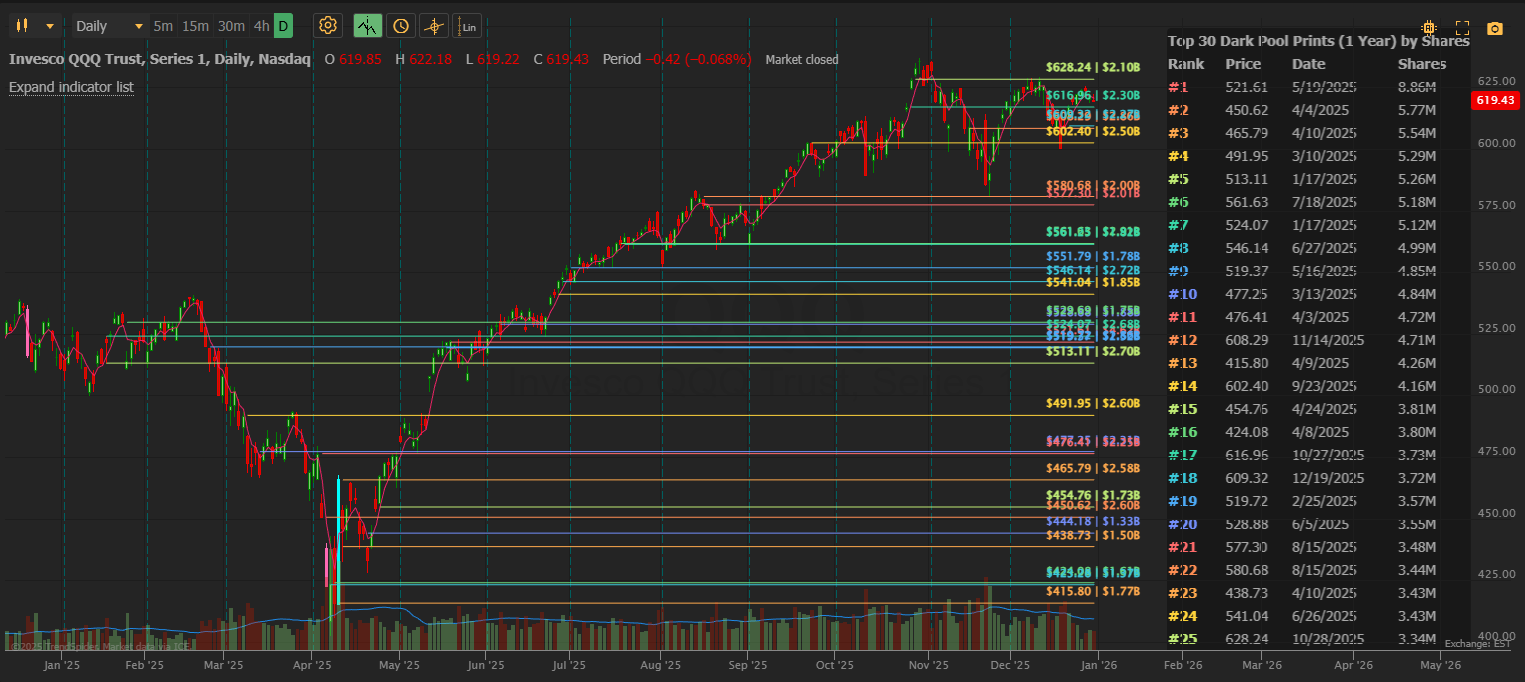
You should immediately see horizontal lines and a data table appear.
Step 2: Understand What You’re Seeing
The Lines
Each horizontal line represents an actual institutional dark pool trade:
| Color | Meaning |
|---|---|
| Red / Orange | Largest trades by share volume |
| Yellow / Green | Medium-sized trades |
| Blue / Purple | Smaller trades |
Lines start at the date the trade occurred and extend to the right.
The Table
The table in the top-right shows details for each level:
| Column | Meaning |
|---|---|
| Rank | #1 = largest trade by shares |
| Price | Exact execution price |
| Date | When it traded |
| Shares | Total shares at this level |
Step 3: Quick Settings for Your Trading Style
Click the indicator name to open settings, then choose based on how you trade:
Day Trading
| Setting | Value |
|---|---|
| Date Range | Today or Week |
| Number of Prints | 10-15 |
| Minimum Share Size | 50,000 |
Swing Trading
| Setting | Value |
|---|---|
| Date Range | 30 Days or 60 Days |
| Number of Prints | 20-25 |
| Minimum Share Size | 100,000 |
Position Trading / Investing
| Setting | Value |
|---|---|
| Date Range | 90 Days or 1 Year |
| Number of Prints | 30 |
| Minimum Share Size | 200,000+ |
Step 4: Reading the Levels
Support: When price drops toward a dark pool level, watch for a bounce. Institutions often defend their positions.
Resistance: When price rises toward a dark pool level, watch for rejection. This could be a distribution zone.
Clusters: Multiple lines close together = high-conviction institutional zone.
Step 5: Pro Move — Layer Two Instances
For powerful analysis, add the indicator twice:
| Instance | Settings |
|---|---|
| First | Date Range = Today, Minimum Size = 50K |
| Second | Date Range = 30 Days, Minimum Size = 200K |
Now you see today’s fresh activity against the major historical levels — a powerful confluence signal.
Watch the video to see it in action!
You’re Ready!
You’re now seeing what institutions are doing — in near real-time.
Next steps:
- Read the full feature guide for advanced strategies
- Check the FAQ if you have questions
- Explore Dark Pool Levels PRO for 60-second updates and historical analysis
Quick Troubleshooting
| Problem | Solution |
|---|---|
| No lines showing | Increase Date Range to 30+ days, decrease Minimum Share Size |
| Lines bunched at left edge | Zoom out on your chart or decrease Date Range |
| Too many lines | Increase Minimum Share Size, decrease Number of Prints |
For more help, see the full FAQ & Troubleshooting page.
Need help? Contact support at support@mobyticktrading.com