Physical Address
304 North Cardinal St.
Dorchester Center, MA 02124
Physical Address
304 North Cardinal St.
Dorchester Center, MA 02124
Reading time: 7 minutes
Five-minute workflow: Filter significant prints → mark price levels → compare with the chart → review clusters and reactions → build a defined-risk trade plan.
Moby Tick tracks more than $200 billion in daily dark pool and block-trade activity across 9,000+ U.S. stocks. That is a large amount of market activity that most retail traders never review before the opening bell.
You do not need hours to use this data.
You need a repeatable process.
In five minutes, you can identify the most relevant dark pool price zones for your watchlist, compare them with current price action, and prepare conditional scenarios before regular trading begins.
The goal is not to predict institutional intent. A print confirms that shares changed hands at a specific price. It does not confirm whether the trade represented buying, selling, accumulation, distribution, hedging, or portfolio rebalancing.
Treat each level as an area to monitor. Then let price action determine whether the zone behaves like potential support, potential resistance, or neither.
Your first minute is for context.
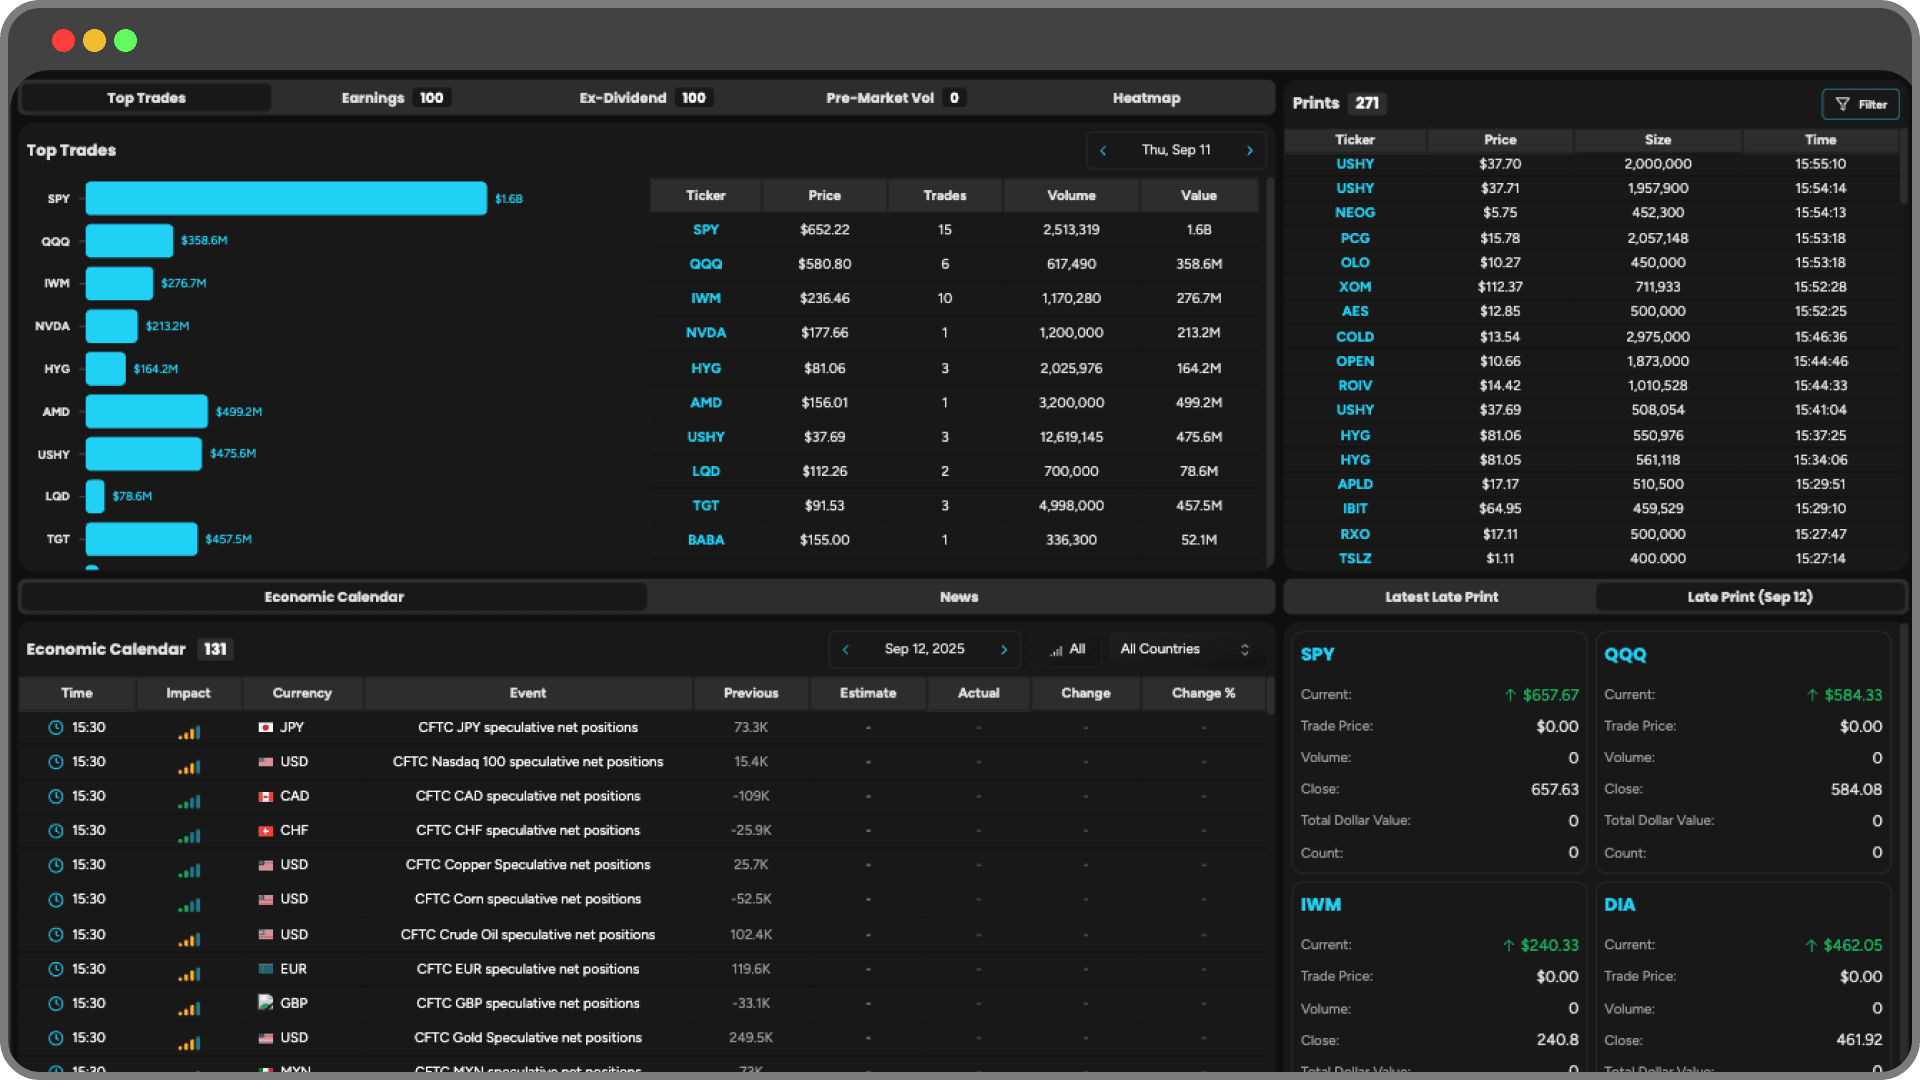
Open the Moby Tick Interactive Dashboard before searching individual tickers. Review the overnight market tone, premarket movers, current volume leaders, and the largest reported block trades.
You are looking for stocks that already have a reason to be on your radar.
Prioritize names with:
Do not start by scanning every print in the market. That creates noise. Start with a focused list of perhaps five to ten stocks that fit your trading style.
Premarket liquidity can be thin. A stock may move sharply on relatively little volume. That makes the location of prior dark pool activity useful for planning, but it does not make the level predictive by itself.
The second minute is for filtering.
A 500,000-share print may be meaningful in one stock and routine in another. Absolute share size is only the starting point. Compare the print with the stock’s normal liquidity, average volume, price, and market capitalization.
Moby Tick’s Block Trade Indicator lets you customize minimum share thresholds, monitor selected symbols or watchlists, and receive real-time alerts when qualifying trades appear.
Use a filter that fits the stock you are studying. For example:
The purpose of filtering is simple: remove activity that is unlikely to change your analysis.
A large print still does not tell you who initiated the trade. It tells you that substantial volume was executed at a specific price. That price is now worth investigating.
The third minute is for location.
Use Print Lookup to review the selected ticker’s historical activity. Note:
Do not draw a single line and assume the market will respect it exactly. Large orders can be executed across a price range. Data can also include multiple prints associated with broader execution activity.
Mark a zone instead.
For example, if several significant prints occurred between $98.80 and $100.10, record that range as a monitoring zone. The width should reflect the stock’s volatility and the concentration of the prints.
A dark pool zone deserves more attention when:
This is confluence. It is not certainty.
A cluster shows repeated activity in a price area. It does not prove that institutions are defending the zone today.

The fourth minute is where dark pool data meets technical structure.
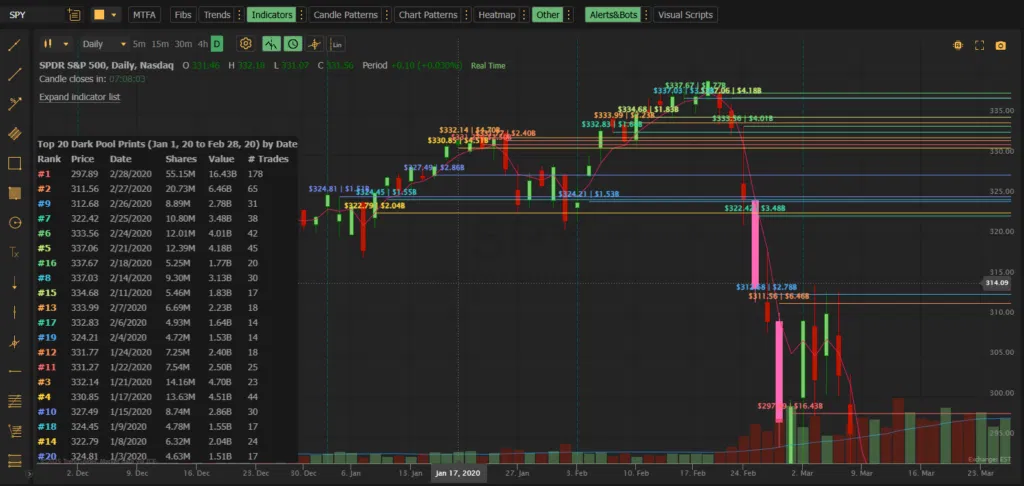
Open the chart and compare your marked zones with:
Now classify the areas as potential support or potential resistance based on location.
A significant print cluster below current price may become a support area if price later pulls back and stabilizes there.
That does not mean the zone must hold. Watch for evidence such as:
A significant print cluster above current price may become a resistance area if price rallies into it and struggles to continue.
Watch for:
The reaction matters more than the label.
If price moves through a potential support zone and accepts below it, the area may no longer function as support. If price breaks above a potential resistance zone and holds, that area may become a new reference point on a retest.
You are not trading the print alone. You are observing how price behaves when it reaches a location where significant activity previously occurred.
The fifth minute is for execution planning.
Do not enter simply because a large print appears on your screen. Define your conditions before the market opens.
A practical plan should include:
For a potential long setup, you might wait for price to reclaim a marked zone and hold it on a retest. Your invalidation could be a decisive move back below the zone.
For a potential short setup, you might wait for price to reject a resistance area and fail to reclaim it. Your invalidation could be sustained acceptance above the zone.
These are examples of conditional planning. They are not signals or guarantees.
Use your own risk limits. A dark pool level can fail quickly, especially during a market-wide move, news release, or volatility spike.
Once you identify the strongest candidates, add them to a Moby Tick Watchlist.
Create separate lists if useful:
Then configure alerts for price entering a zone or for a new block trade matching your criteria. Alerts reduce the need to monitor thousands of symbols manually.
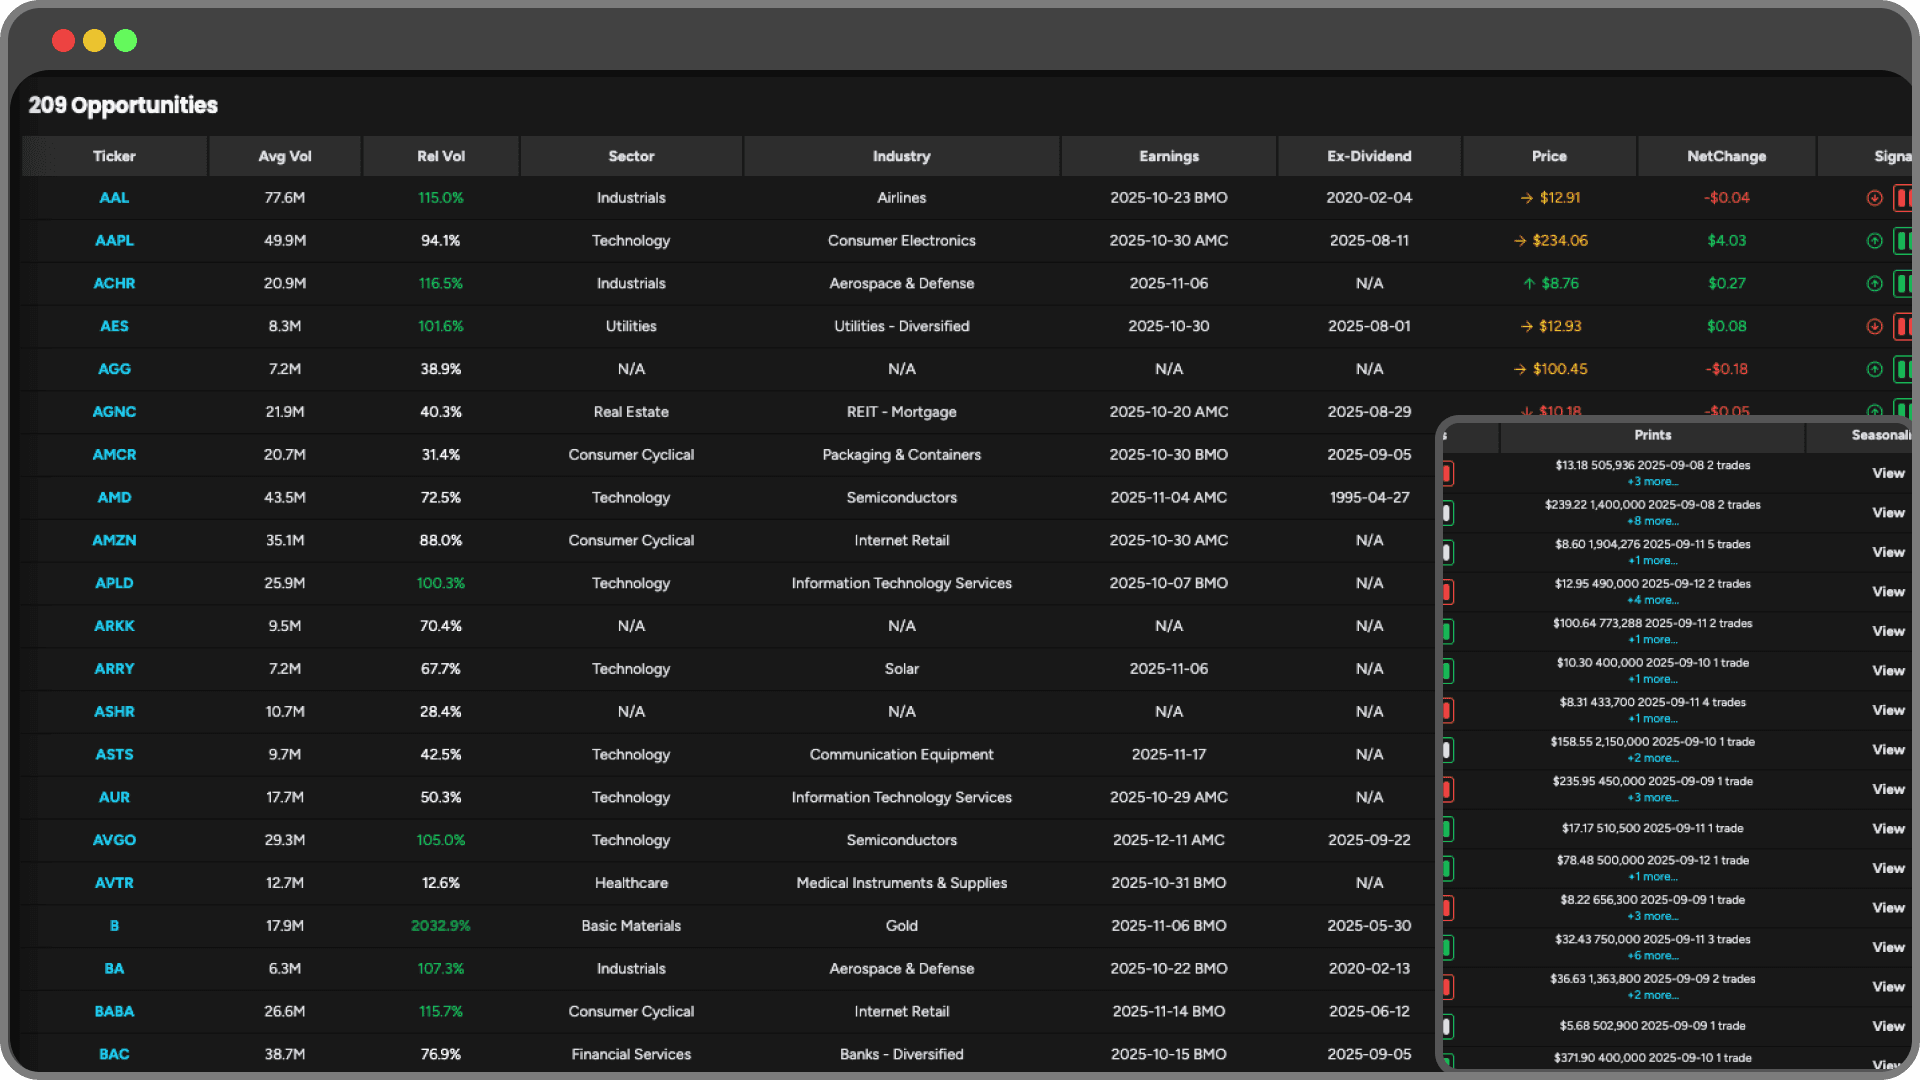
The Opportunities Scanner can also help narrow the market by applying filters for trade size, lookback period, price range, sector, and unusual activity. Use it to build a research list, not to bypass chart review.
Every completed trade has a buyer and a seller. A print alone does not identify which side was more motivated or what either party plans to do next.
Use prints to identify activity at a price. Do not convert them into confirmed directional signals.
One large trade can be important, but it can also be isolated. Clusters and repeated reactions usually provide more context than a single transaction.
Price rarely respects institutional activity to the exact cent. Use zones that account for volatility and execution ranges.
A premarket price near a dark pool zone is a reason to prepare. It is not a reason to enter automatically.
Wait for regular-session price action to show whether the area is being accepted, rejected, or ignored.
The most interesting level on your chart can fail. Define your invalidation before entering and size the position around the amount you are willing to lose: not around the size of the opportunity.
Before the open, ask:
This process takes approximately five minutes once you are familiar with the platform.
The edge is not seeing a dark pool print before anyone else. The edge is interpreting the information with discipline, separating activity from intent, and preparing a risk-defined response before the market accelerates.
Explore the Moby Tick Block Trade Indicator, Interactive Dashboard, Opportunities Scanner, and Watchlists to build your premarket workflow.
Start with Moby Tick’s trading platform and review institutional activity across 9,000+ U.S. stocks in real time.
This article is for educational purposes only. Dark pool and block-trade data are not guarantees of future price movement. Always conduct your own analysis and use a risk-management plan appropriate for your circumstances.