Physical Address
304 North Cardinal St.
Dorchester Center, MA 02124
Physical Address
304 North Cardinal St.
Dorchester Center, MA 02124
does tradingview have dark pool data: Everything you need to know. MobyTick covers it with real institutional data.
TradingView is one of the most widely used charting platforms in retail trading, so it is a fair question whether its data feeds include dark pool prints. The short answer is no: TradingView does not offer native, trade-level off-exchange print data, and its consolidated volume bars do not separate lit exchange executions from dark pool or ATS activity. This guide explains what TradingView does provide, where the gap comes from in the U.S. market structure, and how traders combine TradingView charts with dedicated print data sources to see where institutions were active. It also covers how MobyTick subscribers can generate custom Pine Script to put dark pool data directly on a TradingView chart.
Dark pool data is most useful when it helps answer practical questions: where were institutions active, is the activity unusual versus normal history, and does that activity line up with broader sector or chart context? That is the frame this guide uses.
Retail traders get into trouble when they treat a dark pool print like a magical buy or sell signal. A better use is understanding where executed size actually happened, then combining that with normal charting, sector context, and disciplined trade selection.
Dark pool data refers to trade reports from Alternative Trading Systems (ATS) and broker-dealer internalizers, where orders are matched away from public exchange order books. In the U.S., these executions are printed to a FINRA Trade Reporting Facility and, for many off-exchange venues, carry the XADF or TRF identifier rather than an exchange code like XNAS or ARCX. The prints are published after execution, so you see size and price but never a resting order book. That post-trade tape is the raw material for identifying large prints, block trades, and repeated institutional flow at specific levels.
TradingView delivers consolidated last-sale and quote data through vendors such as Cboe One, Nasdaq Basic, and various exchange direct feeds depending on your subscription. Volume on a TradingView candle is aggregate share volume, which does include off-exchange reported prints rolled into the total, but it is not broken out by venue or exchange code. There is no field in the standard chart, screener, or Pine Script environment that isolates ATS executions, TRF reports, or block-sized prints. In practice this means you can see that volume was elevated, but not where institutions were active.
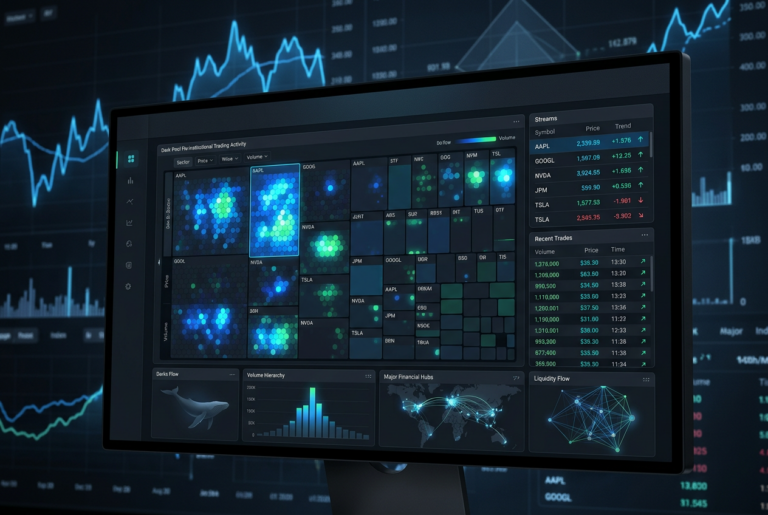
Venue-level trade condition and exchange-code data sits behind separate licensing tiers, and parsing it requires tick-by-tick processing rather than aggregated OHLCV bars. Most charting platforms optimize for low-latency bar delivery across tens of thousands of symbols, which means discarding per-print metadata like reporting facility, trade condition flags, and sale size classification. Dedicated dark pool tools such as MobyTick (https://mobyticktrading.com) and the visual layer at DarkPoolHeatmap (https://darkpoolheatmap.com) process that tick stream specifically to preserve print-level detail. The two data models serve different purposes and are usually run side by side.
TradingView does not surface dark pool prints natively, but there is a bridge for traders who want that context on their own charts. MobyTick subscribers can generate custom Pine Script indicators that plot institutional dark pool activity directly on TradingView.
Through the TradingView Script Generator, available in MobyTick’s Print Lookup feature on the Remora plan or higher, you select your own tickers (up to 50), set a minimum block trade size and timeframe, and choose a visual theme. The generator then produces Pine Script code that you copy into TradingView’s Pine Editor, where it overlays large prints and institutional levels on your chart. The scripts carry five-plus years of print history, so the plotted levels reflect where meaningful size has repeatedly transacted rather than a single session.
One thing to know before you start: the scripts refresh by regeneration, not by a live feed. TradingView has not yet approved a real-time interactive integration, so the data in a script reflects its most recent generation. Traders who trade intraday often regenerate each morning, while swing and position traders usually refresh weekly. The full step-by-step walkthrough is in the TradingView integration guide.
The public chart is only part of the story. Dark pool data helps reveal where larger participants were active away from the public order book. That can matter because institutions often build or unwind positions in ways that do not show up clearly on a standard chart until later.
Used well, dark pool data helps traders prioritize names, identify better support and resistance context, and notice sector rotation earlier. Used badly, it just becomes another source of overconfidence. The difference is process.
Open your TradingView profile and review the market data subscriptions attached to your account. Note whether you are on delayed data, Cboe One, or a full exchange package, since each affects the completeness of consolidated volume. None of these tiers add off-exchange print separation, but knowing your feed prevents you from misreading volume discrepancies as missing dark pool data. Document the feed you use so comparisons against a print-level source are apples to apples.
This matters because traders who use does tradingview have dark pool data well are usually building context, not chasing noise. The goal is to let institutional activity improve your process before a move becomes obvious on a simple chart.
Load a liquid large-cap symbol and compare TradingView’s daily volume against the consolidated tape figure from a second source. You will typically find the totals reasonably close because off-exchange prints are included in the aggregate. Then try to filter for prints above a size threshold in the screener or Pine Script. The absence of any venue, trade condition, or sale-size field is the practical confirmation that trade-level dark pool analysis is not available natively.
This matters because traders who use does tradingview have dark pool data well are usually building context, not chasing noise. The goal is to let institutional activity improve your process before a move becomes obvious on a simple chart.
Bring in a tool that parses the tape at the print level and tags reporting facility codes such as XADF. MobyTick (https://mobyticktrading.com) surfaces large prints and block trades with time, price, and size, which is the layer TradingView omits. The goal is not to replace your charts but to answer a different question: at which price levels did significant institutional activity get reported? Keep both windows open so you can cross-reference timestamps.
This matters because traders who use does tradingview have dark pool data well are usually building context, not chasing noise. The goal is to let institutional activity improve your process before a move becomes obvious on a simple chart.
Take the prices where clustered or unusually large prints were reported and draw them as horizontal lines on your TradingView chart. These become dark pool levels, reference prices where meaningful size changed hands off-exchange. Label each line with the date and approximate notional so you can judge relevance weeks later. Over time you will build a chart that carries both public price structure and a record of where institutions were active.
This matters because traders who use does tradingview have dark pool data well are usually building context, not chasing noise. The goal is to let institutional activity improve your process before a move becomes obvious on a simple chart.
A long list of prints is hard to rank by eye, which is why a visual density layer helps. DarkPoolHeatmap (https://darkpoolheatmap.com) aggregates print concentration by price so the heaviest zones stand out against ordinary flow. Focus your manual charting effort on the top few density bands per symbol rather than plotting every print. This keeps your TradingView layout readable and reduces the temptation to treat every off-exchange execution as significant.
This matters because traders who use does tradingview have dark pool data well are usually building context, not chasing noise. The goal is to let institutional activity improve your process before a move becomes obvious on a simple chart.
Set a fixed time, typically after the close, to pull the day’s notable prints, update your levels, and note how price interacted with existing dark pool levels. Record whether a level saw repeated prints, was traded through without reaction, or coincided with elevated flow in related names. A written log turns scattered observations into a dataset you can evaluate over months. Without this step, print data becomes anecdotal rather than analytical.
This matters because traders who use does tradingview have dark pool data well are usually building context, not chasing noise. The goal is to let institutional activity improve your process before a move becomes obvious on a simple chart.
A trader notices a mega-cap ticker printing double its twenty-day average volume on TradingView, yet the candle range is narrow and there is no news. The chart alone offers no explanation. Pulling print-level data reveals several block trades reported through the TRF within a tight price band, consistent with off-exchange institutional activity rather than aggressive lit-market participation. The volume anomaly and the narrow range now fit a coherent read of where size was transacted.
What makes this practical is that the same logic can be checked across ticker pages, sector pages, and broader heatmap activity instead of forcing every name into the same simplistic interpretation.
Over three sessions, a mid-cap industrial name shows clusters of large prints reported within roughly thirty cents of the same price. On TradingView, that area looks like ordinary consolidation with no distinguishing feature. Once the print clusters are drawn as a dark pool level, the trader has a documented reference where substantial size was reported repeatedly. Subsequent revisits to that band can then be evaluated against the volume behavior recorded there.
What makes this practical is that the same logic can be checked across ticker pages, sector pages, and broader heatmap activity instead of forcing every name into the same simplistic interpretation.
A trader monitoring semiconductor names sees nothing unusual on individual TradingView charts. A heatmap view across the group, however, shows print density rising simultaneously in five related tickers during the same afternoon window. That cross-symbol pattern points to coordinated institutional flow at a sector level, a signal that only becomes visible when print data is aggregated across names rather than viewed one chart at a time.
What makes this practical is that the same logic can be checked across ticker pages, sector pages, and broader heatmap activity instead of forcing every name into the same simplistic interpretation.
Most mistakes come from trying to force certainty out of data that is really best used as context. That is why the strongest workflows combine institutional activity with ordinary trade planning instead of replacing it.
These are simple habits, but they are what keep dark pool data useful. Without process, traders tend to turn institutional context into random confirmation bias.
Start on DarkPoolHeatmap.com to see which sectors are elevated. Then move into ticker pages to inspect recent print activity and relative context. If a name keeps showing up with unusual activity, mark the main levels and compare them to your chart.
That process works better than randomly browsing prints because it gives you a top-down filter: sector first, ticker second, levels third, execution last.
Does TradingView have dark pool data in any subscription tier?
No. As of now, no TradingView plan, including Premium and Expert tiers, exposes trade-level off-exchange print data, venue codes, or ATS identifiers. Off-exchange executions are folded into consolidated volume totals, but there is no way to isolate them in charts, screeners, or Pine Script. Traders who need print-level detail pair TradingView with a dedicated source such as MobyTick.
Is TradingView’s volume wrong if it lacks dark pool separation?
The totals are generally not wrong, just undifferentiated. Consolidated feeds include off-exchange reported share volume in the aggregate figure, so daily totals are usually close to the full tape. What is missing is attribution: you cannot tell how much came from lit exchanges versus ATS venues, or which individual prints were block-sized. That distinction is what dark pool analysis depends on.
Can Pine Script be used to detect dark pool prints?
Not with TradingView’s native data, because Pine Script operates on aggregated OHLCV bars and has no access to per-print venue, trade condition, or sale-size fields. But there is a workaround: MobyTick generates custom Pine Script indicators with your selected tickers’ dark pool data already built in. The script plots large prints and institutional levels directly on the chart, and you refresh it by regenerating the script, since TradingView has not yet approved a live, self-updating integration. See the TradingView integration guide for the setup.
How should dark pool levels be interpreted alongside a TradingView chart?
Treat them as reference prices where meaningful size was reported, not as directional signals. A level marks a location where institutional activity was documented; how price behaves on a later revisit is a separate observation you should record. Combining TradingView’s structure with print density from DarkPoolHeatmap (https://darkpoolheatmap.com) gives context, but interpretation still depends on your own tested framework and risk rules.
Does TradingView Have Dark Pool Data? What You Can and Cannot See becomes useful when it helps you understand where institutions were active and how unusual that activity really is. The data is not the trade. It is the context that helps you make better decisions before the trade.
If you build that habit, dark pool data becomes a filter for better watchlists, cleaner level identification, and stronger trade context. If you skip the process, it turns into noise very quickly.
See live institutional activity for free on DarkPoolHeatmap.com, or start your MobyTick trial if you want deeper history, alerts, and a stronger institutional workflow.
Want more dark pool education and weekly institutional context? Subscribe to the free weekly report.