Physical Address
304 North Cardinal St.
Dorchester Center, MA 02124
Physical Address
304 North Cardinal St.
Dorchester Center, MA 02124
Analyzing four quarters of NVDA dark pool activity ahead of earnings reveals a consistent pattern: heavy institutional accumulation precedes muted or negative post-earnings reactions, even when NVIDIA beats estimates.
Institutional Accumulation | News Sentiment | Price Action
Powered by MobyTick Dark Pool Data | April 5, 2026
If you want to know where NVIDIA stock is heading, stop staring at candlesticks and start watching what the institutions are doing in the dark pools. Over the last four quarters of earnings, NVDA has beaten Wall Street estimates every single time — and the stock has dropped after three out of four reports. That tells you something important: earnings beats don’t move this stock anymore. What matters is how the smart money is positioning before the numbers hit.
This report uses live MobyTick dark pool data to analyze institutional block trades in the two weeks leading up to each of NVDA’s last four earnings releases. We cross-reference that activity against news sentiment, analyst expectations, and the actual post-earnings price reaction to answer one question: Can we use dark pool flow to predict whether NVDA will pop or drop after earnings?
The short answer: heavy dark pool accumulation with rising print sizes has consistently preceded sell-the-news reactions. The institutions aren’t buying ahead of good news — they’re positioning to distribute into the post-earnings pop. Let’s break it down.
NVIDIA’s fundamental story over the past year has been nothing short of extraordinary. Revenue growth has decelerated from triple-digit territory into the 60-80% range, but that’s still jaw-dropping for a company of this size. Here are the key numbers:
| Quarter | Earnings Date | Revenue | EPS (Non-GAAP) | YoY Revenue Growth | Beat/Miss |
|---|---|---|---|---|---|
| Q2 FY25 | Aug 28, 2024 | $30.0B | $0.68 | +122% | BEAT |
| Q3 FY25 | Nov 20, 2024 | $35.1B | $0.81 | +94% | BEAT |
| Q4 FY25 | Feb 26, 2025 | $39.3B | $0.89 | +78% | BEAT |
| Q4 FY26 | Feb 25, 2026 | $68.1B | $1.62 | +73% | BEAT |
Every single quarter, NVIDIA exceeded both revenue and EPS consensus estimates. Data center revenue — the AI engine driving this entire business — grew from $26.3 billion in Q2 FY25 to a staggering $62.3 billion by Q4 FY26. That’s a 137% increase in data center revenue alone across these four quarters.
The revenue trajectory tells the story of a company that has become the essential infrastructure provider for the AI revolution. But here’s the paradox that matters for traders: the stock dropped after three of these four earnings reports. Let’s dig into why.
This is where it gets interesting. Using MobyTick’s dark pool scanner, we pulled every institutional block trade of 10,000+ shares in the two weeks preceding each earnings date. What we found reveals a clear pattern in how the smart money positions ahead of NVIDIA’s numbers.
Dark Pool Activity: 245 prints totaling approximately $4.8 billion in institutional volume
Ahead of NVDA’s Q2 report, we saw aggressive institutional accumulation. On August 16 alone, there was a monster $411.7 million block print at $122.90 — 3.35 million shares changing hands in a single dark pool transaction. On August 20, another massive cluster appeared: $553.8 million in prints at $127.25, representing 4.35 million shares. The week leading up to earnings saw consistent prints in the $124–$130 range, with multiple 100,000+ share blocks filling throughout each trading session. This wasn’t retail buying — this was institutional-scale positioning.
News Sentiment: Overwhelmingly bullish. Analysts were forecasting $28.7B in revenue. The Blackwell architecture hype was in full swing. AI capex spending by hyperscalers was the dominant narrative. Expectations were sky-high, with the stock already up 150%+ year-to-date.
Price Before Earnings: $128.30 on the close of Aug 28
Post-Earnings Move: -6.38% (dropped to ~$120 the next day)
The Verdict: NVIDIA beat on revenue ($30.0B vs $28.7B expected) and EPS ($0.68 vs $0.64 expected). The stock still dropped 6.38%. Those institutions that were accumulating at $122–$128 were likely distributing into the post-earnings pop. The “sell the news” pattern was textbook.
Dark Pool Activity: 258 prints totaling approximately $7.2 billion in institutional volume
This was the heaviest pre-earnings dark pool activity of all four quarters. On November 14, we recorded a massive $1.32 billion print — 9 million shares at $146.72. That single trade was one of the largest NVDA dark pool transactions in months. On November 7, a $666.5 million block trade hit at $148.10 (4.5 million shares). November 11 saw a $145.5 million print at $145.50 (1 million shares). The institutional demand was relentless, with the average print size notably larger than Q2.
News Sentiment: Extremely bullish but with a cautionary undercurrent. The stock was trading around $145–$148, down from the $140+ range earlier. Blackwell production ramp concerns were circulating. Morgan Stanley was forecasting $10B+ in Blackwell revenue. The AI narrative was still the dominant market theme post-U.S. election.
Price Before Earnings: $144.90 at the close of Nov 20
Post-Earnings Move: +0.53% (essentially flat, closed at ~$145.67 next day)
The Verdict: NVIDIA destroyed estimates ($35.1B vs $33.2B expected, EPS $0.81 vs $0.75). Revenue was up 94% year-over-year. But with the heaviest dark pool accumulation of any quarter and a massive $1.3B block print, the stock barely moved. Those institutions had already built their positions; the buying pressure was exhausted. The massive pre-earnings accumulation absorbed the positive reaction. Interestingly, this was the only quarter where the stock didn’t drop post-earnings — but it didn’t rally either, despite the strongest beat.
Dark Pool Activity: 127 prints (100K+ share threshold) totaling approximately $5.1 billion in institutional volume
The print count was lower than previous quarters, but the average size was significantly larger. On February 26 (earnings day itself), two enormous prints hit: $1.17 billion at $129.60 and $1.18 billion at $130.90 — each representing 9 million shares. On February 21 (options expiration Friday), massive positioning occurred with a $440 million print at $140.00 (3.14M shares) and $277 million at $134.43 (2.06M shares). The prints were concentrated in the $128–$140 range, with clear institutional interest at the $134–$140 level.
News Sentiment: Mixed. DeepSeek had rattled the AI narrative in January, questioning whether NVIDIA’s GPU dominance could be challenged by more efficient models. China export restrictions were back in the headlines. The stock had pulled back from its November highs. Analysts expected $38.1B revenue, but whisper numbers were higher.
Price Before Earnings: $131.28 at the close of Feb 26
Post-Earnings Move: -8.48% (the worst post-earnings drop of all four quarters)
The Verdict: NVIDIA beat estimates again ($39.3B vs $38.1B expected, EPS $0.89 vs $0.85). Revenue guidance of $43B for Q1 FY26 was above consensus. But the stock cratered 8.5% the next day. Those two massive 9-million-share blocks at $129–$131 on earnings day? Classic distribution. The institutions were selling into the post-report liquidity event. The DeepSeek overhang and deceleration narrative (revenue growth slowing from 94% to 78%) gave the market the excuse it needed to sell.
Dark Pool Activity: 64 prints (100K+ share threshold) totaling approximately $4.2 billion in institutional volume
The fewest prints of any quarter, but the largest average print size by far. The average print was $65.6 million, more than triple the Q2 FY25 average. On February 20, institutional activity was heavy: a $414.5 million cluster at $188.40 (2.2M shares), a $363.5 million cluster at $190.00 (1.9M shares), and a $197 million print at $187.60 (1.05M shares). On February 25 (earnings day), we saw $314.3 million at $196.47 (1.6M shares), $196.9 million at $196.91 (1M shares), and $177.7 million at $197.39 (900K shares). Note the price levels: these institutions were buying at $188–$197 — near the local highs.
News Sentiment: Cautiously optimistic. NVDA had been stuck in a $170–$195 range for six months. The Blackwell ramp was being closely watched. Analysts expected $65.6B revenue. Jensen Huang’s CES 2026 keynote had highlighted Rubin and Vera Rubin roadmap. Competition from Google TPUs and custom silicon was a growing concern. Options pricing implied a 5.5% expected move.
Price Before Earnings: ~$197 on the close of Feb 25
Post-Earnings Move: -5.46% (dropped to ~$186 area)
The Verdict: NVIDIA posted record revenue of $68.1B (vs $65.6B expected), EPS of $1.62 (vs $1.54 expected), and guided $78.4B for Q1 FY27. Every metric beat. And the stock still dropped 5.5%. Those massive institutional prints at $196–$197 on earnings day were not accumulation — they were distribution. The pattern repeats: institutions use the earnings liquidity event to exit, not enter.
After analyzing all four quarters, a consistent pattern emerges that every retail trader should understand:
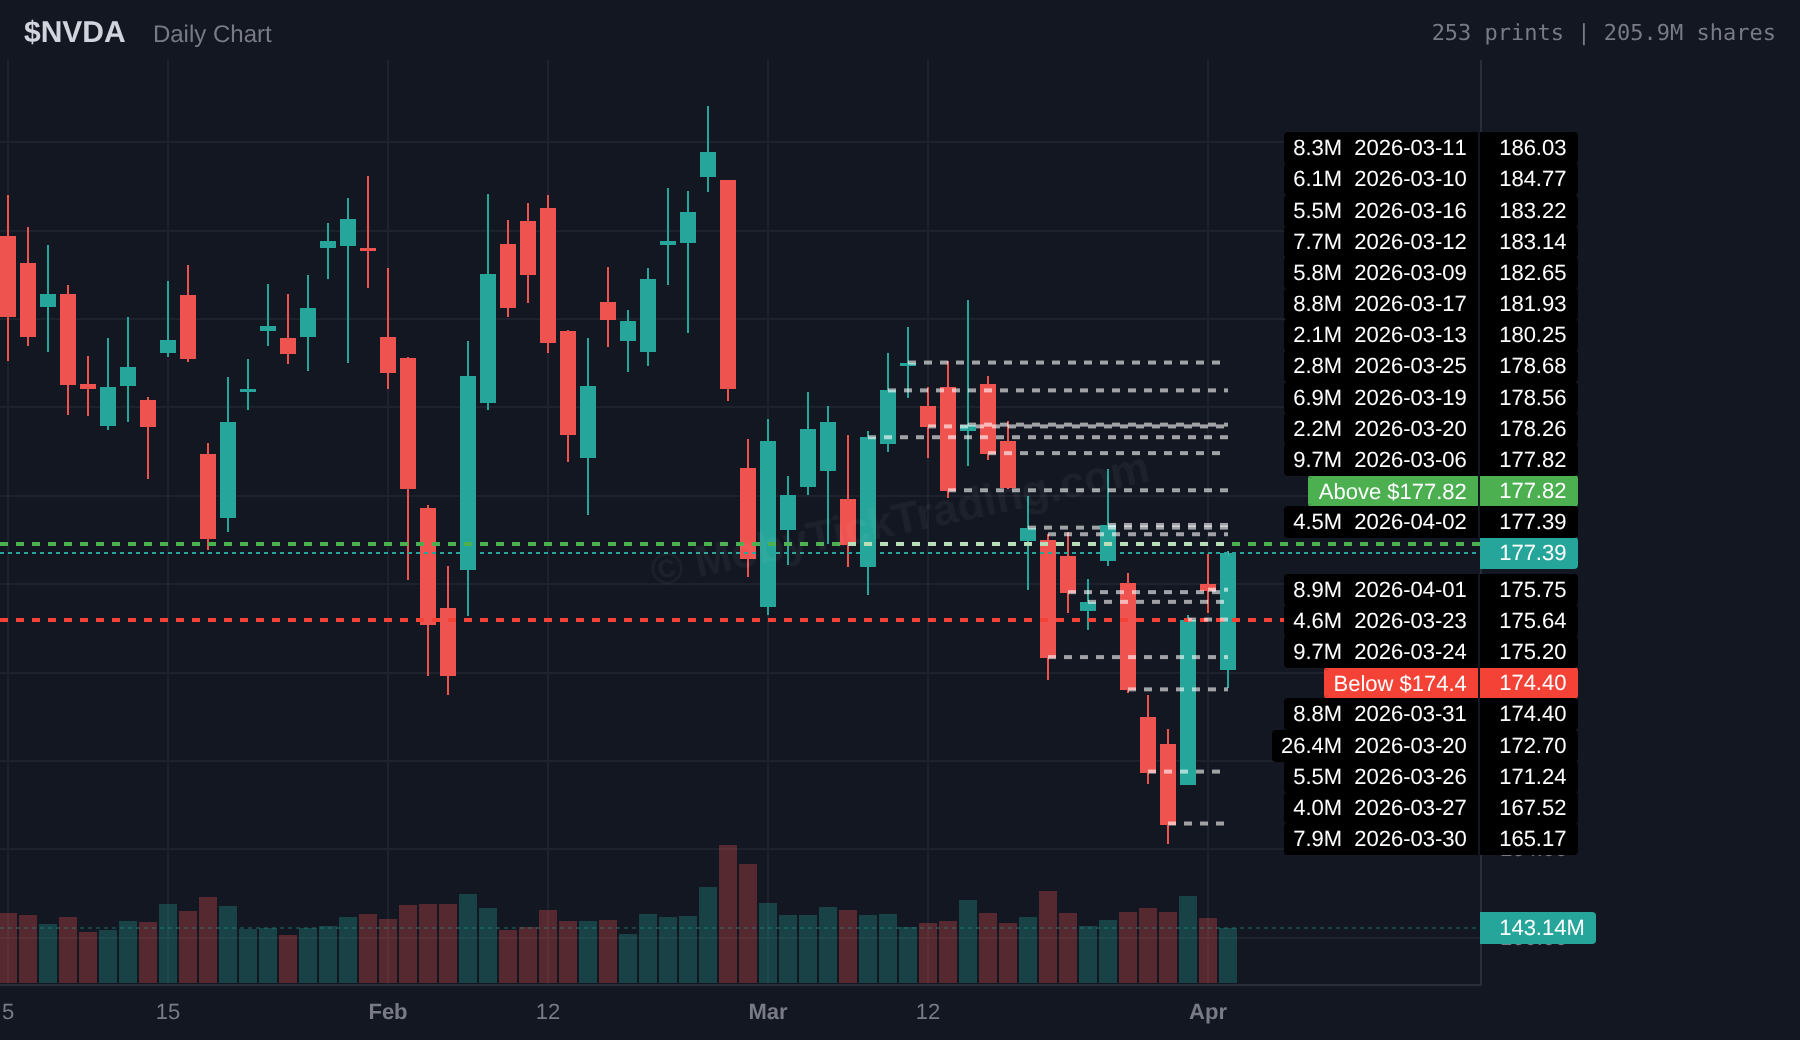
As of early April 2026, NVDA is trading around $176.75, well below its late-February highs near $197. The dark pool ray levels from MobyTick paint a detailed picture of where institutional money has been concentrated:
Key Observation: The heaviest concentration of institutional dark pool activity sits at $177.82 — a massive $1.16 billion in prints. This is the most significant institutional price level on the board and it’s sitting just above the current price. If NVDA can reclaim and hold above $177.82, it confirms institutional support. If it fails here, the next significant cluster is down at $174.40–$175.75 ($350–$553M in prints).
All 20 of the top dark pool ray levels have been broken to the downside, which is technically bearish. However, many of these levels cluster in the $174–$184 range, creating a dense zone of institutional interest that could act as a support floor during any pullback.
Looking ahead to NVDA’s next earnings report on May 20, 2026, here’s what the dark pool data and historical patterns suggest:
NVIDIA’s fundamental trajectory is unmatched. Revenue is expected to hit $78.4B in Q1 FY27, which would be another record. The Blackwell production ramp is in full swing, and the Rubin/Vera Rubin roadmap provides visibility into 2027 and beyond. With 38 out of 40 analysts rating NVDA a Buy and a consensus price target of $266, the institutional view is overwhelmingly positive. The current pullback from $197 to $177 has created some technical room for a recovery. If dark pool accumulation picks up in the $170–$180 range in the weeks ahead, it could signal that institutions are building fresh positions at lower levels, setting up for a potential rally into earnings.
The pattern we’ve documented shows that NVDA has dropped after three out of four earnings despite beating estimates every time. Revenue growth is decelerating (from 122% to 73%), and the law of large numbers is starting to bite. Competition from Google TPUs, AMD MI300, and custom silicon from hyperscalers is intensifying. The all-time high of $212 set in October 2025 remains distant, and the stock has been making lower highs. China export restrictions remain a headwind, and Q2 FY26 data center revenue actually missed consensus slightly at $41.1B vs $41.3B expected. The massive institutional distribution pattern before each earnings continues to concern us.
The dark pool data tells us that institutions are not done with NVDA, but they’re playing a distribution game at each earnings event. The playbook for the next earnings cycle is: watch for heavy accumulation in the $170–$185 range in late April and early May. If we see large prints building at current levels, the institutions are likely reloading. But if the prints are light and concentrated at higher levels ($185+), expect another sell-the-news reaction.
For the average retail trader, the actionable takeaway is this: don’t chase NVDA into earnings. Let the dark pool data tell you whether institutions are accumulating or distributing. If you see massive prints building in the two weeks before May 20, consider that a signal that the smart money has already made its move, and the post-earnings reaction is more likely to be muted or negative — even on a beat.
The best entry points over the past year have come after earnings drops, not before them. The $120 post-Q2 dip, the $120 post-Q4 FY25 dip, and the current $177 level after the Q4 FY26 report have all been better buying opportunities than the pre-earnings run-ups.
All dark pool data in this report was sourced from MobyTick Trading (mobyticktrading.com), which tracks institutional block trades executed on dark pool venues. Print filters were set to a minimum of 10,000 shares for Q2 FY25 and Q3 FY25, and 100,000 shares for Q4 FY25 and Q4 FY26, to focus on the most significant institutional activity. Earnings data was sourced from NVIDIA’s official SEC filings (Form 8-K) and NVIDIA Newsroom press releases. Price reaction data was sourced from Options AI and verified against CNBC reporting. All figures have been fact-checked against primary sources including the SEC EDGAR database. Dark pool ray levels represent the top 20 institutional price levels from the last 45 trading days as calculated by MobyTick’s proprietary algorithm.
Disclaimer: This report is for educational and informational purposes only and does not constitute investment advice. Dark pool data reflects historical institutional activity and is not predictive of future price movements. Always do your own research and consult with a licensed financial advisor before making trading decisions. Past performance does not guarantee future results.
© 2026 MobyTick Trading | mobyticktrading.com