
MobyTick Weekly Dark Pool Report — Week of March 23–27, 2026
Last Week’s Callout Performance
Our Mar 16–20 setups vs Mar 23–27 results:
BULLISH: 8/11 triggered | 3 targets hit
BEARISH: 10/11 triggered | 22 targets hit
OVERALL: 18/22 setups triggered. Bearish dominated — fifth straight losing week for U.S. equities.
| Ticker | Bull Trigger | Bull Result | Bear Trigger | Bear Result |
|---|---|---|---|---|
| SPY | $662.50 | Triggered (high $662.62) — T0 | $642.50 | T2 — hit to $635 |
| QQQ | $595 | Triggered (high $595.08) — T0 | $578.50 | T4 — hit to $565 |
| IWM | $251.25 | T0 (high $253.07) | $240 | No trigger |
| NVDA | $180 | T0 (high $181.22) | $170 | T1 — hit $167.50 |
| AVGO | $325 | T0 (high $326.48) | $307.50 | T1 — hit $300 |
| MSFT | $390 | No trigger | $380 | T5 — all targets to $360 |
| XLE | $60.50 | T2 — hit $62.50 | $58 | T0 (low $57.66) |
| SMCI | $24 | T0 (high $24.19) | $20 | T0 (low $19.48) |
| UNH | $290 | No trigger | $275 | T4 — hit to $260 |
| AMZN | $210 | T1 — hit $212.50 | $205 | T2 — hit to $200 |
| GLD | $428 | No trigger | $411 | T3 — hit to $400 |
Highlights: MSFT bear side hit ALL 5 targets to $360 (−7% week). XLE was the only real bullish winner as energy surged. Many bull triggers barely triggered then reversed — classic bull trap week.
Market Overview — Correction Territory
The fifth consecutive losing week for U.S. equities — the longest weekly decline since 2022. The Dow Jones officially entered correction territory Friday, closing down nearly 800 points as escalating Iran tensions and surging oil prices rattled global markets.
Weekly Index Performance
- S&P 500 (SPY): −3.64% ($658.07 → $634.09)
- Nasdaq 100 (QQQ): −4.73% ($590.52 → $562.58)
- Russell 2000 (IWM): −1.65% ($247.17 → $243.10)
- Dow Jones (DIA): −2.57% ($463.30 → $451.39)
What Moved Markets
- Iran Escalation: Trump extended the negotiation deadline, but markets interpreted it as prolonged uncertainty. Asian and European markets sold off hard.
- Oil Surge: WTI crude settled at $99.64/barrel Friday (+5.5% on the day), approaching the $100 psychological level. USO ETF rallied from $110 to $124 on the week.
- Rate Hike Fears: Futures markets priced in a 52% probability of a Fed rate increase by year-end for the first time — the oil-driven inflation narrative is shifting the calculus.
- Dow in Correction: The DJIA closed at 45,167, more than 10% below its February record of 50,512.
- S&P 500: Down 8.74% from its late-January peak, approaching but not yet in correction territory.
- Flight to Safety: Gold (GLD) hit $420 intraweek before pulling back. Treasury bonds (TLT) declined as yields spiked on inflation fears.
Sector Rotation
- Energy (XLE): +8.06%
- Consumer Staples (XLP): 0.00%
- Healthcare (XLV): −2.25%
- Industrials (XLI): −2.99%
- Financials (XLF): −3.80%
- Comm. Services (XLC): −5.16%
- Technology (XLK): −5.51%
Energy is the clear outperformer with oil spiking. Tech and communications bore the brunt of the selloff. Consumer staples held flat as a defensive shelter.
▲ Bullish Setups (Above Trigger) — March 30 – April 3
| Ticker | Above | T1 | T2 | T3 | T4 | T5 | T6 | T7 |
|---|---|---|---|---|---|---|---|---|
| SPY | $648 | $650 | $652.50 | $655 | $657.50 | $660 | $665 | |
| QQQ | $570 | $572.50 | $575 | $580 | $582.50 | $585 | $590 | |
| IWM | $252.50 | $255 | $257.50 | $260 | $262 | $265 | ||
| TSM | $350 | $355 | $360 | $365 | $370 | $375 | $380 | |
| TER | $305 | $310 | $315 | $320 | $325 | $330 | $340 | |
| MU | $372.50 | $380 | $390 | $395 | $400 | $410 | $415 | |
| BP | $47 | $47.50 | $48 | $50 | $52.50 | $55 | ||
| AVGO | $312.50 | $315 | $317 | $320 | $322.50 | $325 | $330 | |
| TERN | $53.25 | $55 | $57.50 | $60 | ||||
| MCD | $312.50 | $315 | $317.50 | $320 | $322.50 | $324 | $325 | |
| UNH | $272.50 | $275 | $277.50 | $280 | $285 | $290 | ||
| META | $550 | $555 | $560 | $570 | $580 | $590 | $592.50 | |
| NVDA | $173 | $175 | $177.50 | $178.25 | $180 | $182.50 | $185 | $190 |
▼ Bearish Setups (Below Trigger) — March 30 – April 3
| Ticker | Below | T1 | T2 | T3 | T4 | T5 | T6 |
|---|---|---|---|---|---|---|---|
| SPY | $630 | $625 | $622.50 | $620 | $615 | $610 | $600 |
| QQQ | $560 | $557.50 | $555 | $550 | $540 | $530 | |
| IWM | $240 | $237.50 | $235 | $230 | $225 | $222.50 | $220 |
| TSM | $322.50 | $320 | $315 | $312.50 | $310 | $307.50 | $305 |
| TER | $290 | $285 | $280 | $275 | $270 | $260 | $250 |
| MU | $350 | $340 | $330 | $320 | $310 | $300 | $295 |
| BP | $44.75 | $44 | $42.50 | $42 | $40.50 | $40 | |
| AVGO | $297.50 | $295 | $290 | $285 | $280 | $275 | |
| TERN | $50 | $49 | $47.50 | $46.25 | $45 | $42.50 | |
| MCD | $304.75 | $302.50 | $300 | $295 | $292.50 | $290 | |
| UNH | $257 | $255 | $250 | $245 | $240 | $230 | $220 |
| META | $517.50 | $510 | $500 | $490 | $480 | $475 | $470 |
| NVDA | $165 | $162.50 | $160 | $158 | $155 | $150 | $140 |
Trade Setups with Dark Pool Charts
$SPY — $634.09
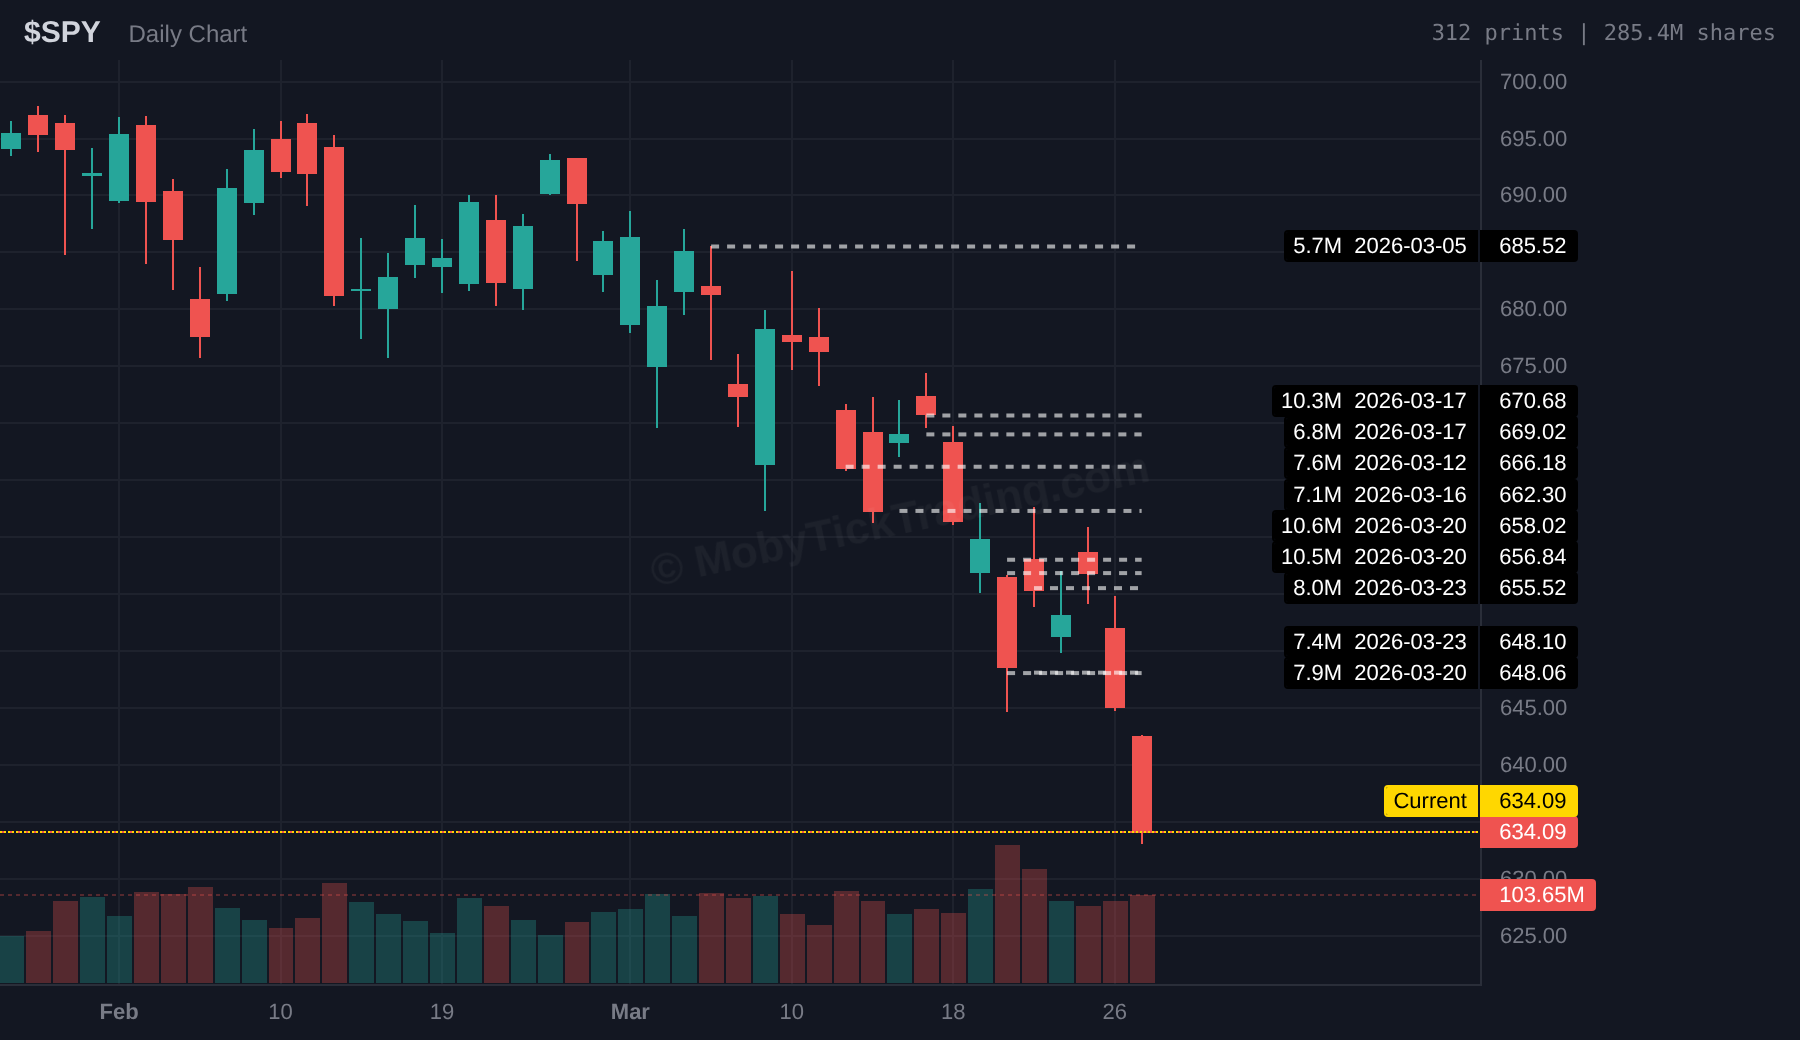
▲ Bullish above $648 → Targets: $650, $652.50, $655, $657.50, $660, $665
▼ Bearish below $630 → Targets: $625, $622.50, $620, $615, $610, $600
$QQQ — $562.58
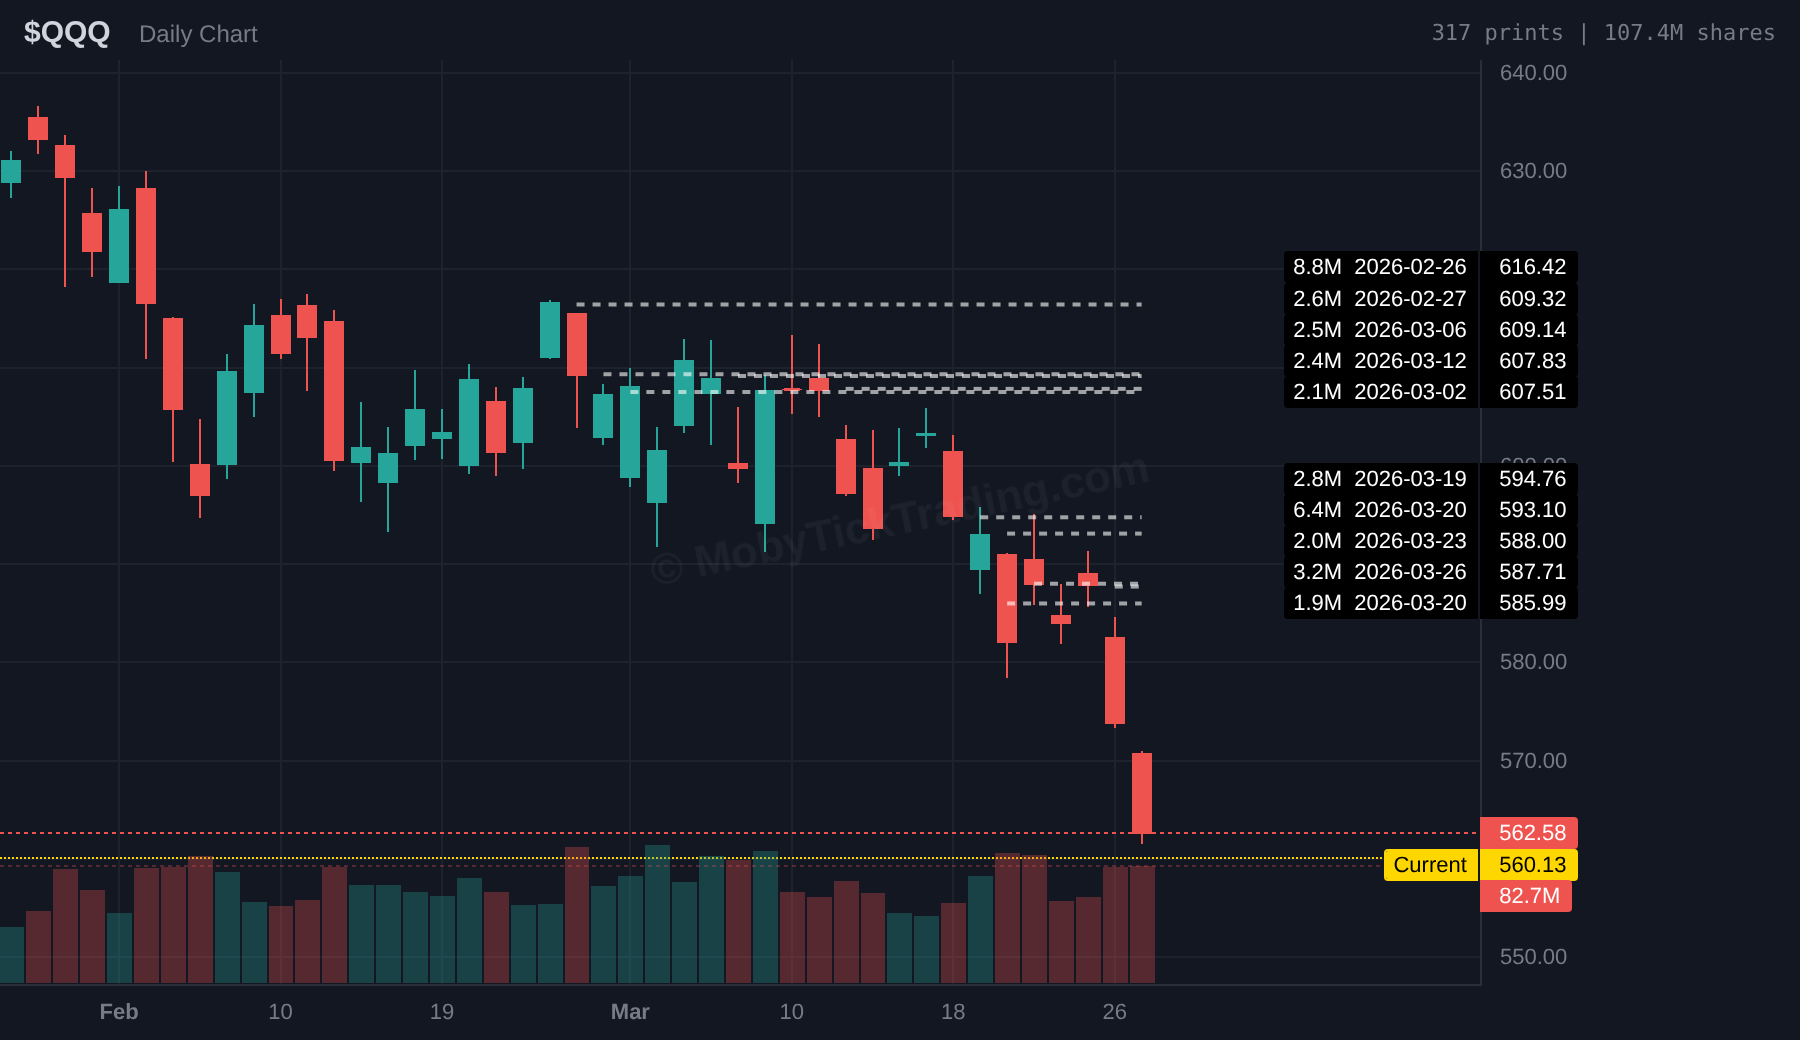
▲ Bullish above $570 → Targets: $572.50, $575, $580, $582.50, $585, $590
▼ Bearish below $560 → Targets: $557.50, $555, $550, $540, $530
$IWM — $243.10
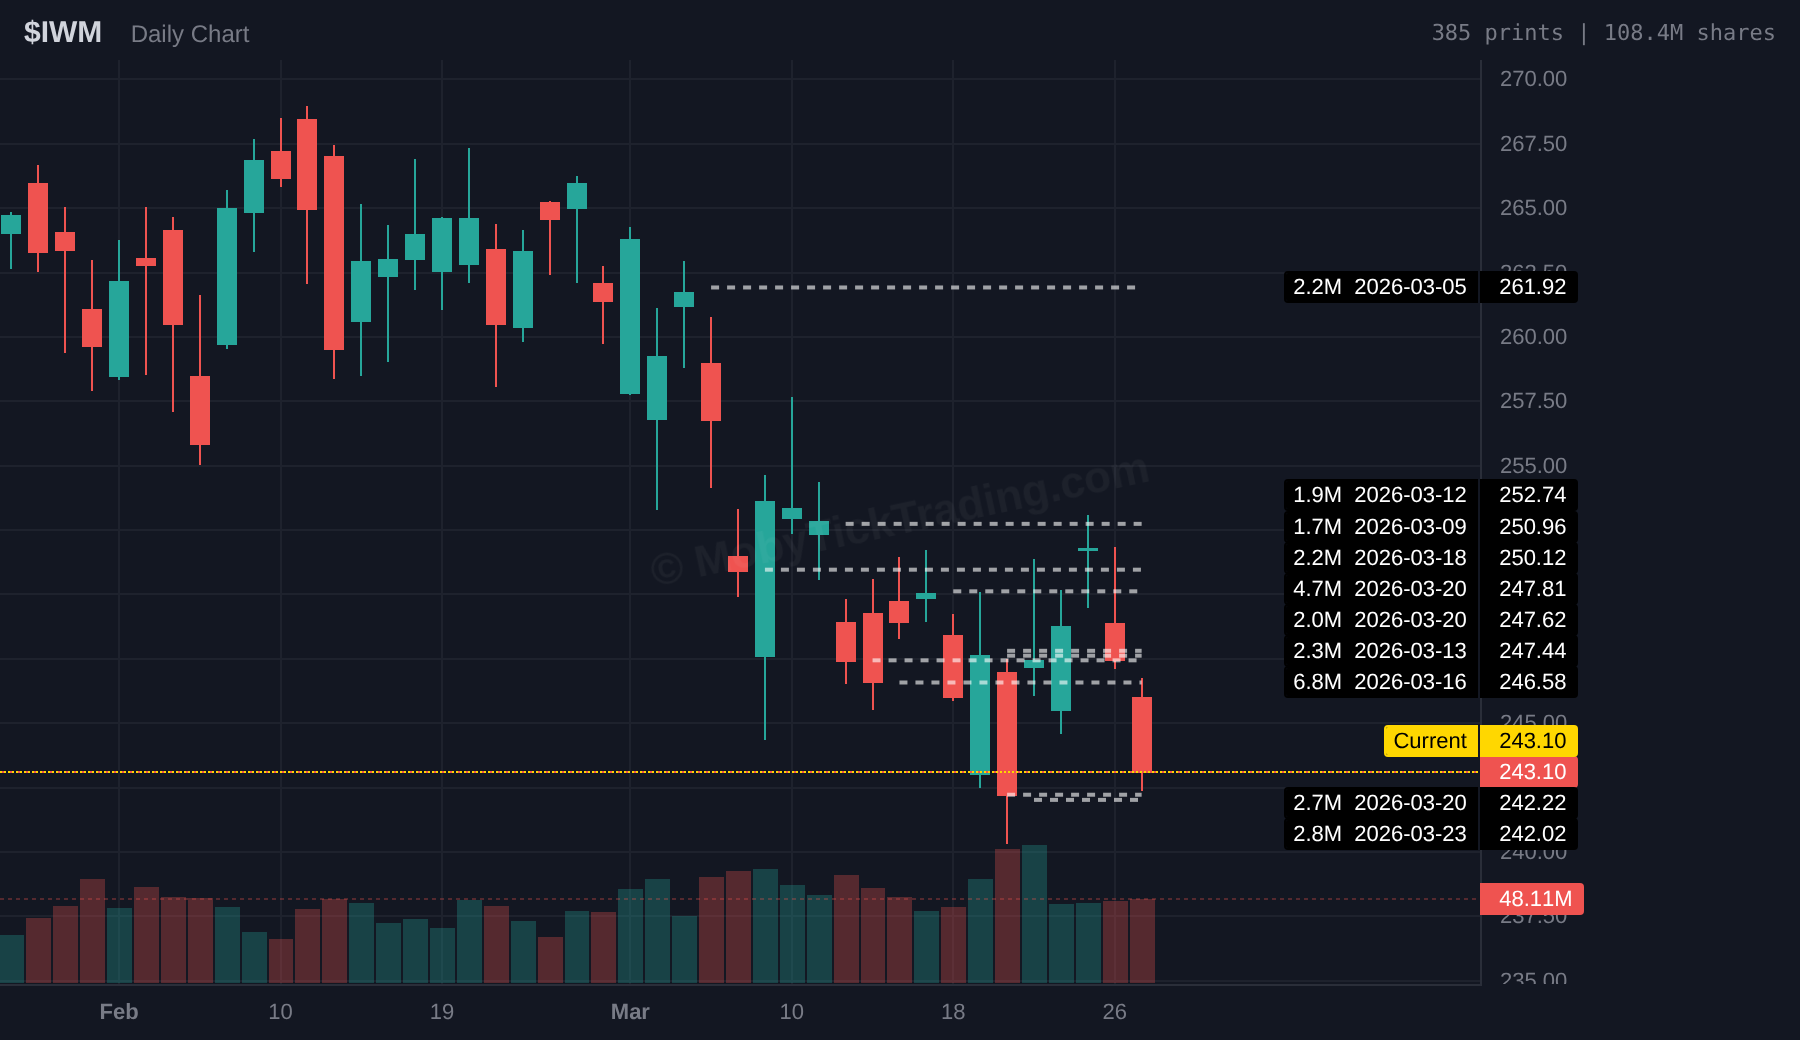
▲ Bullish above $252.50 → Targets: $255, $257.50, $260, $262, $265
▼ Bearish below $240 → Targets: $237.50, $235, $230, $225, $222.50, $220
$TSM — $324.60
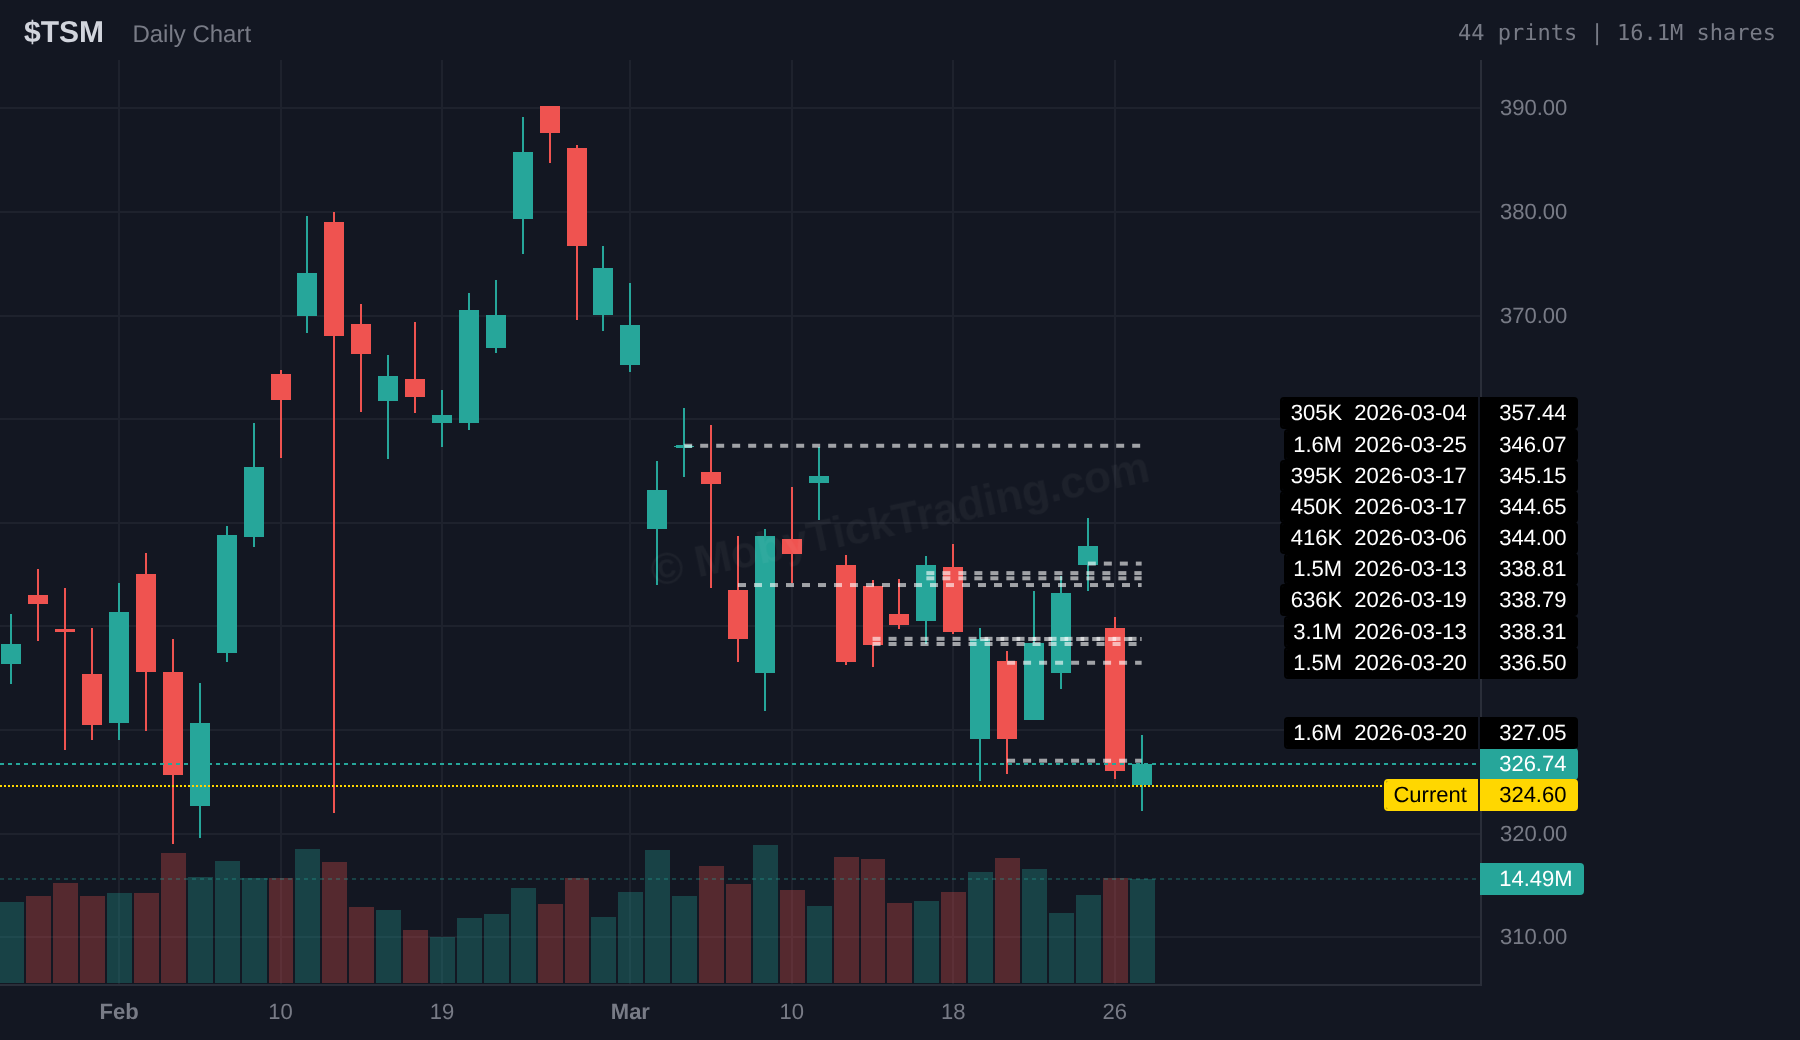
▲ Bullish above $350 → Targets: $355, $360, $365, $370, $375, $380
▼ Bearish below $322.50 → Targets: $320, $315, $312.50, $310, $307.50, $305
$TER — $292.00
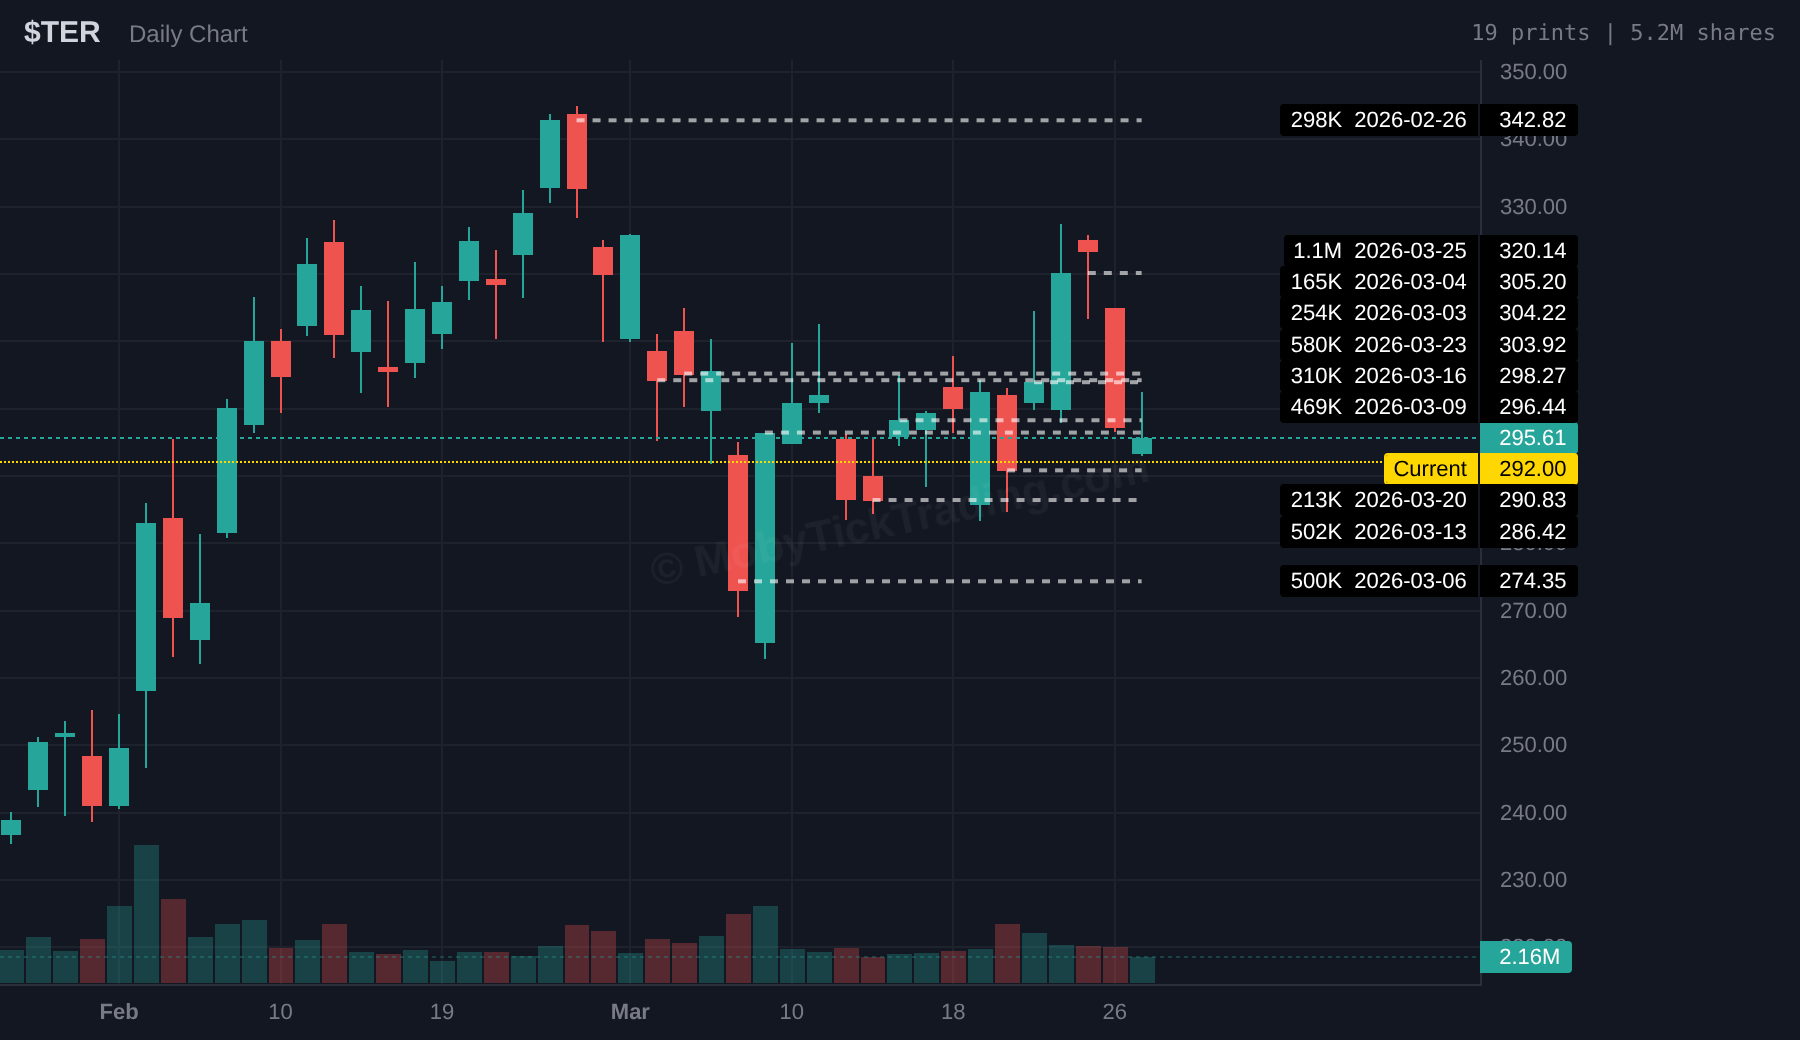
▲ Bullish above $305 → Targets: $310, $315, $320, $325, $330, $340
▼ Bearish below $290 → Targets: $285, $280, $275, $270, $260, $250
$MU — $352.45
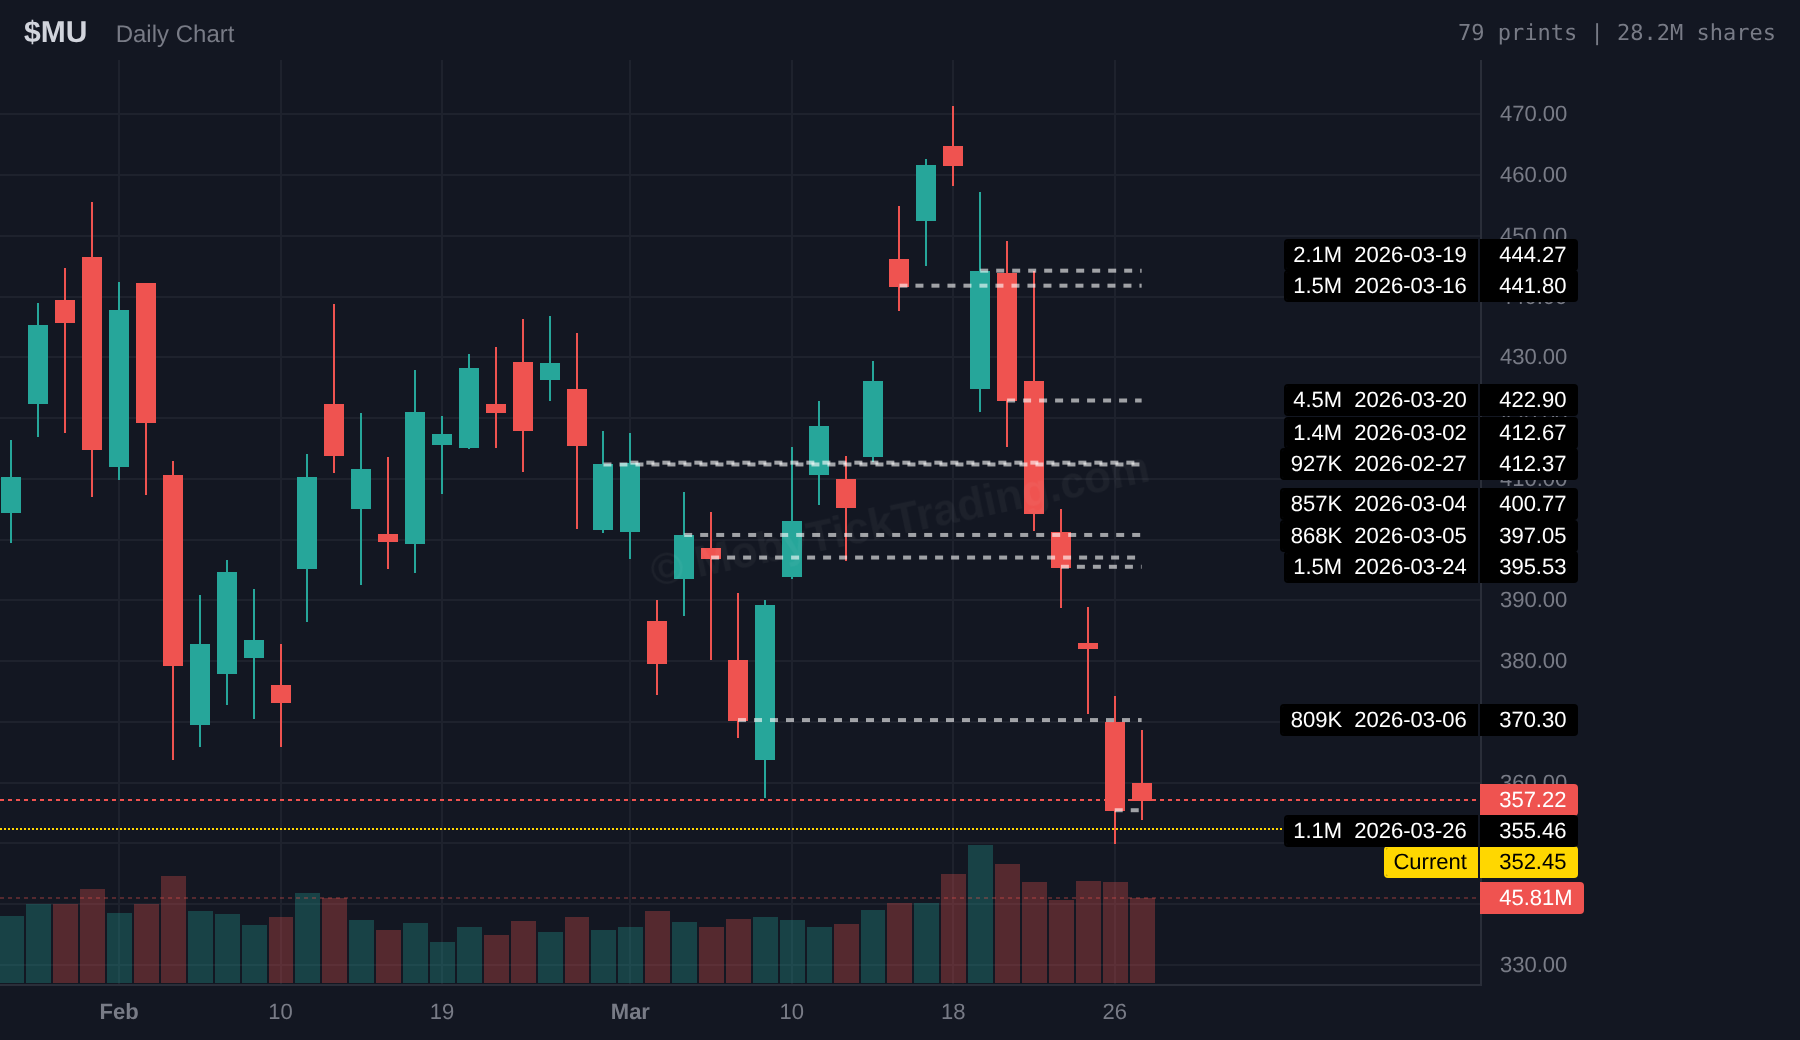
▲ Bullish above $372.50 → Targets: $380, $390, $395, $400, $410, $415
▼ Bearish below $350 → Targets: $340, $330, $320, $310, $300, $295
$BP — $46.59
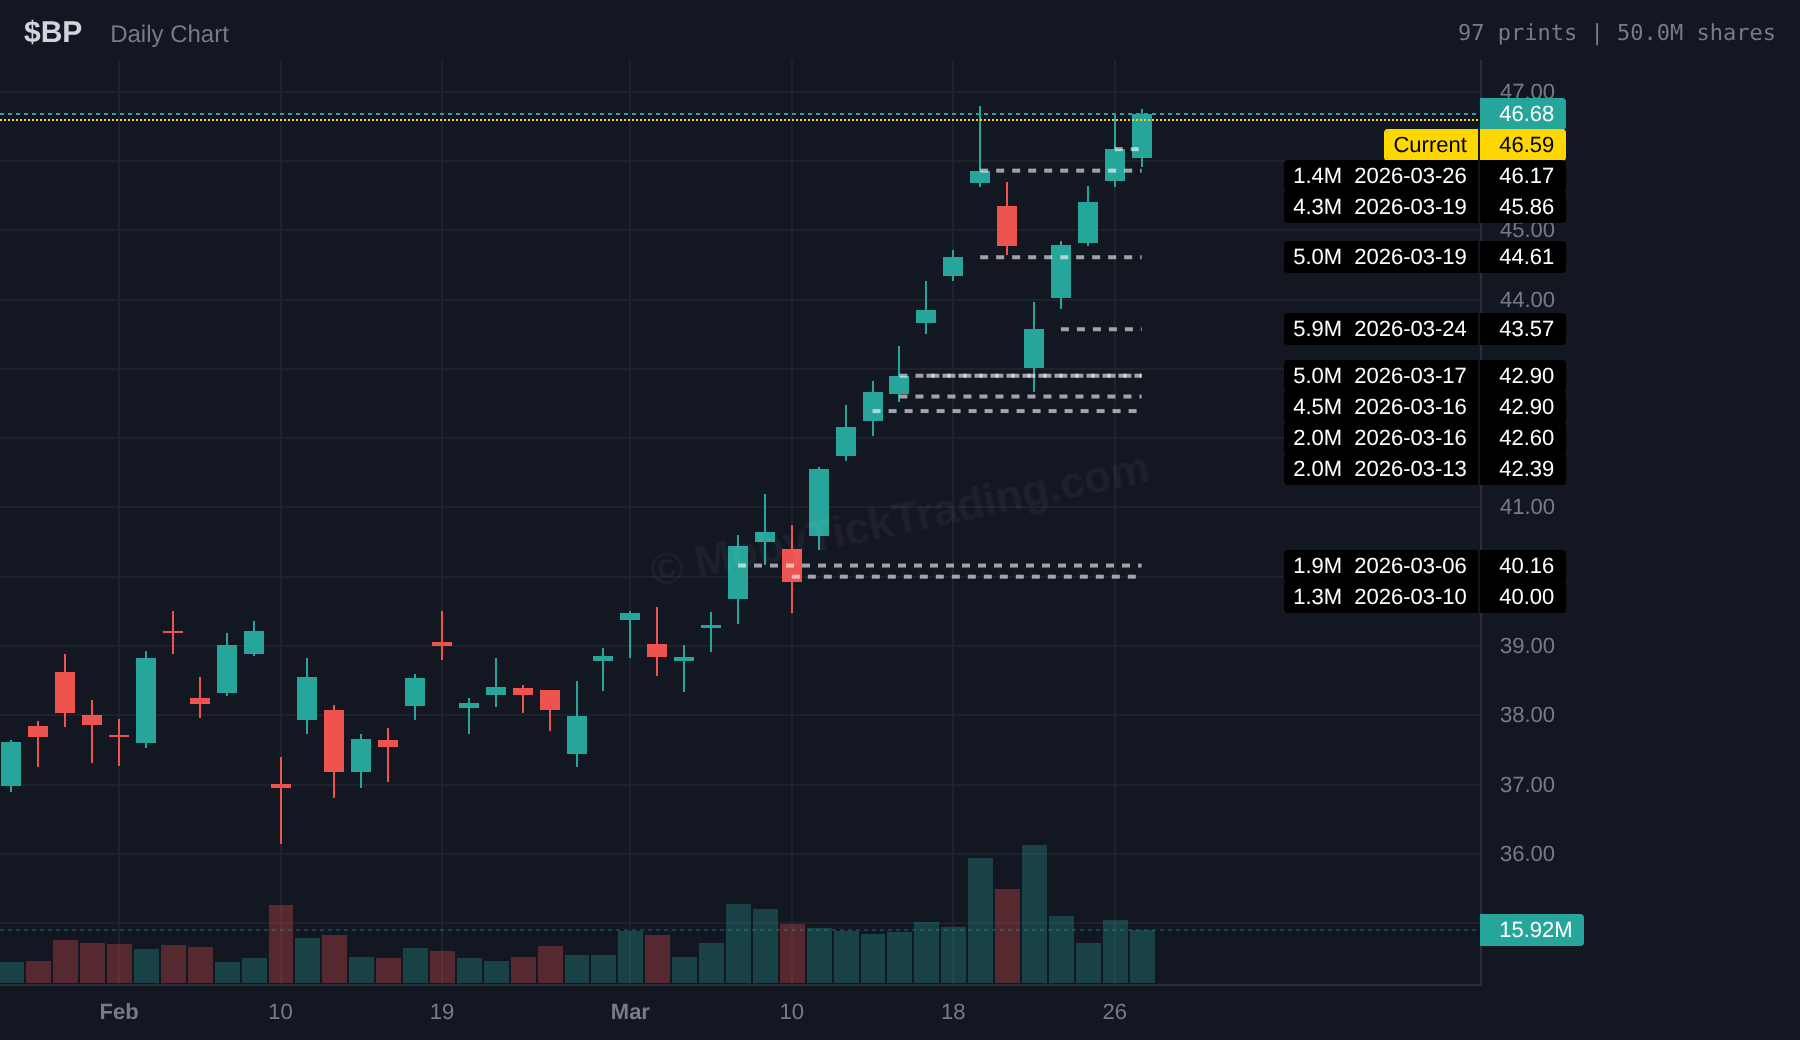
▲ Bullish above $47 → Targets: $47.50, $48, $50, $52.50, $55
▼ Bearish below $44.75 → Targets: $44, $42.50, $42, $40.50, $40
$AVGO — $298.29
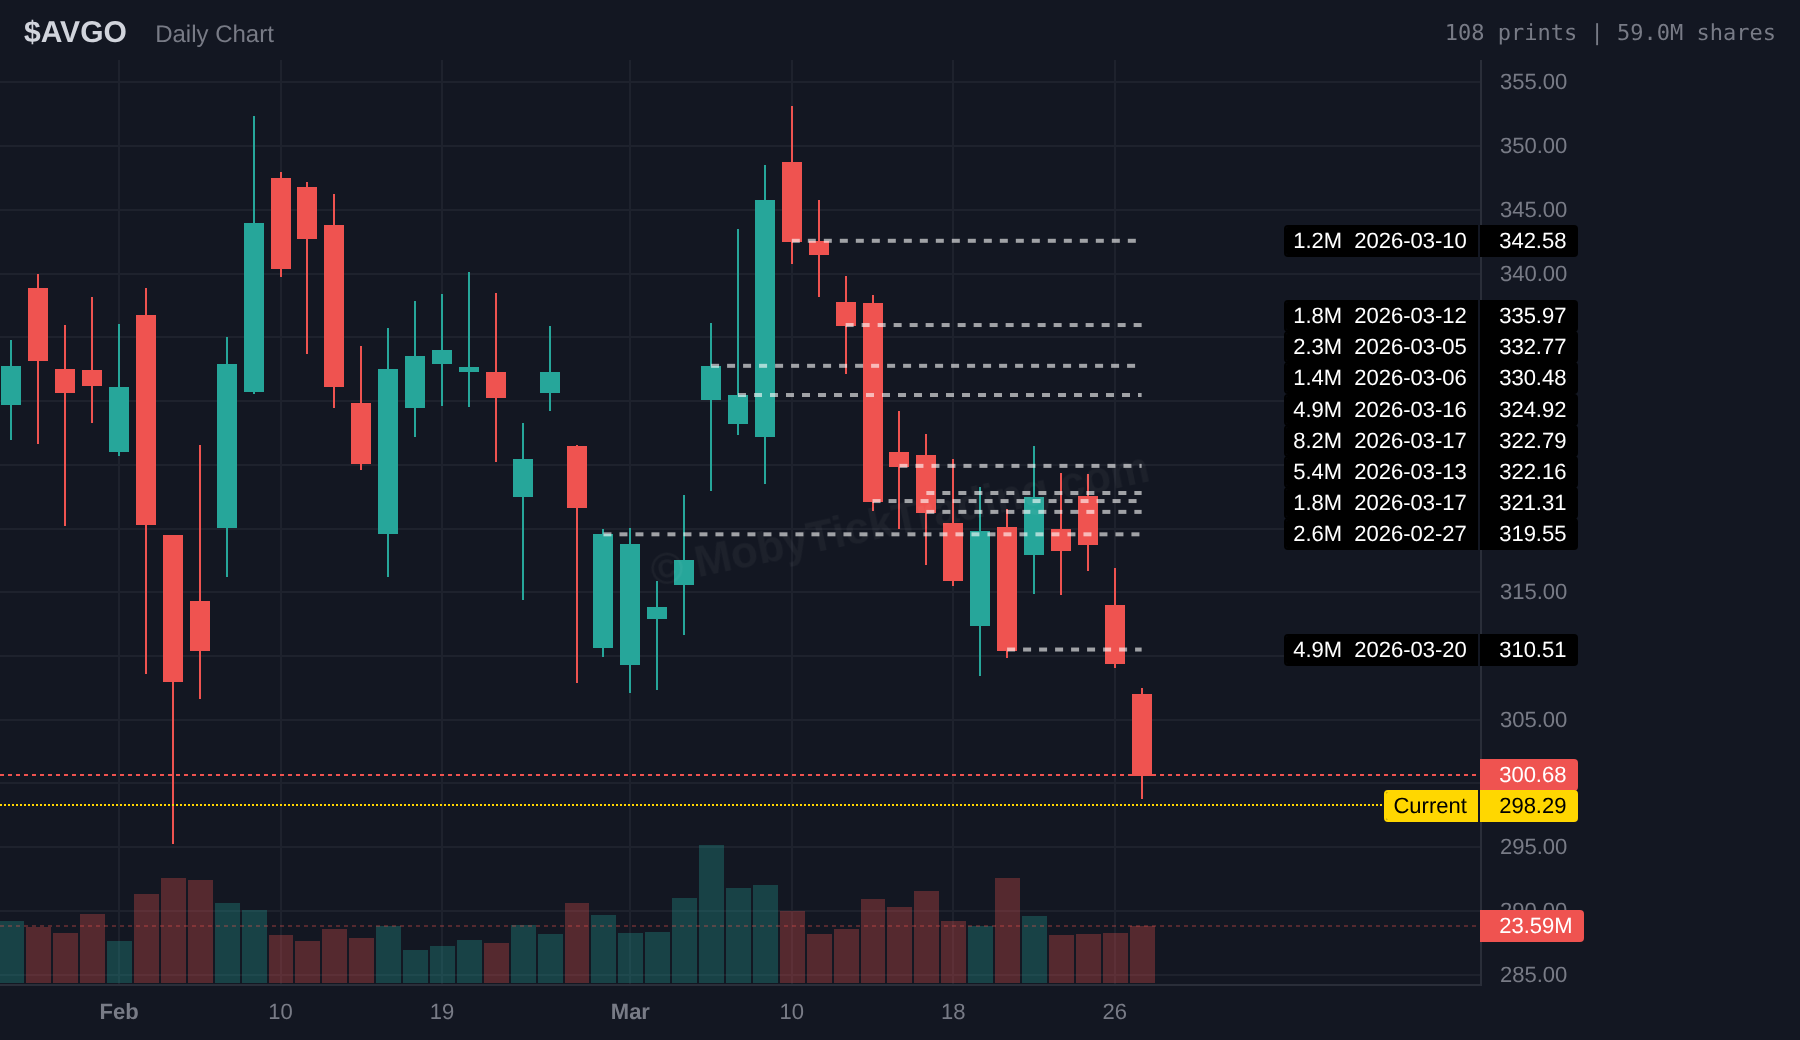
▲ Bullish above $312.50 → Targets: $315, $317, $320, $322.50, $325, $330
▼ Bearish below $297.50 → Targets: $295, $290, $285, $280, $275
$TERN — $52.93
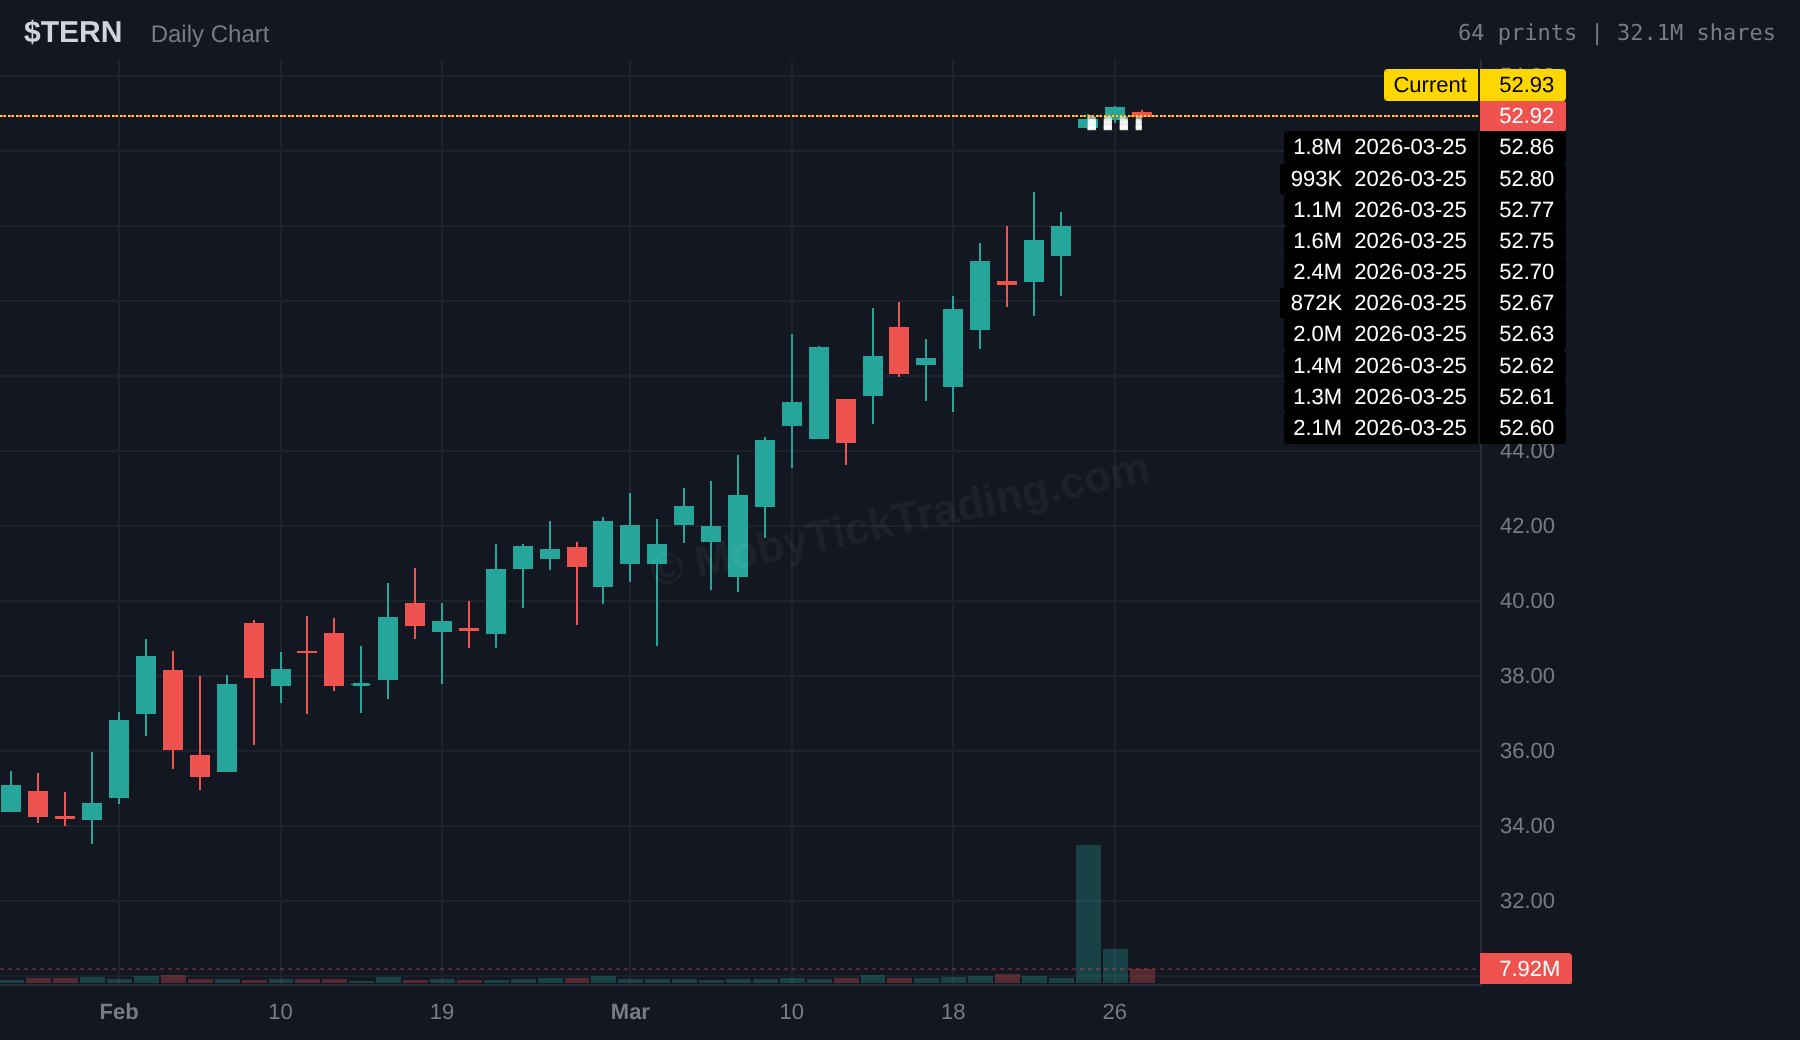
▲ Bullish above $53.25 → Targets: $55, $57.50, $60
▼ Bearish below $50 → Targets: $49, $47.50, $46.25, $45, $42.50
$MCD — $305.75
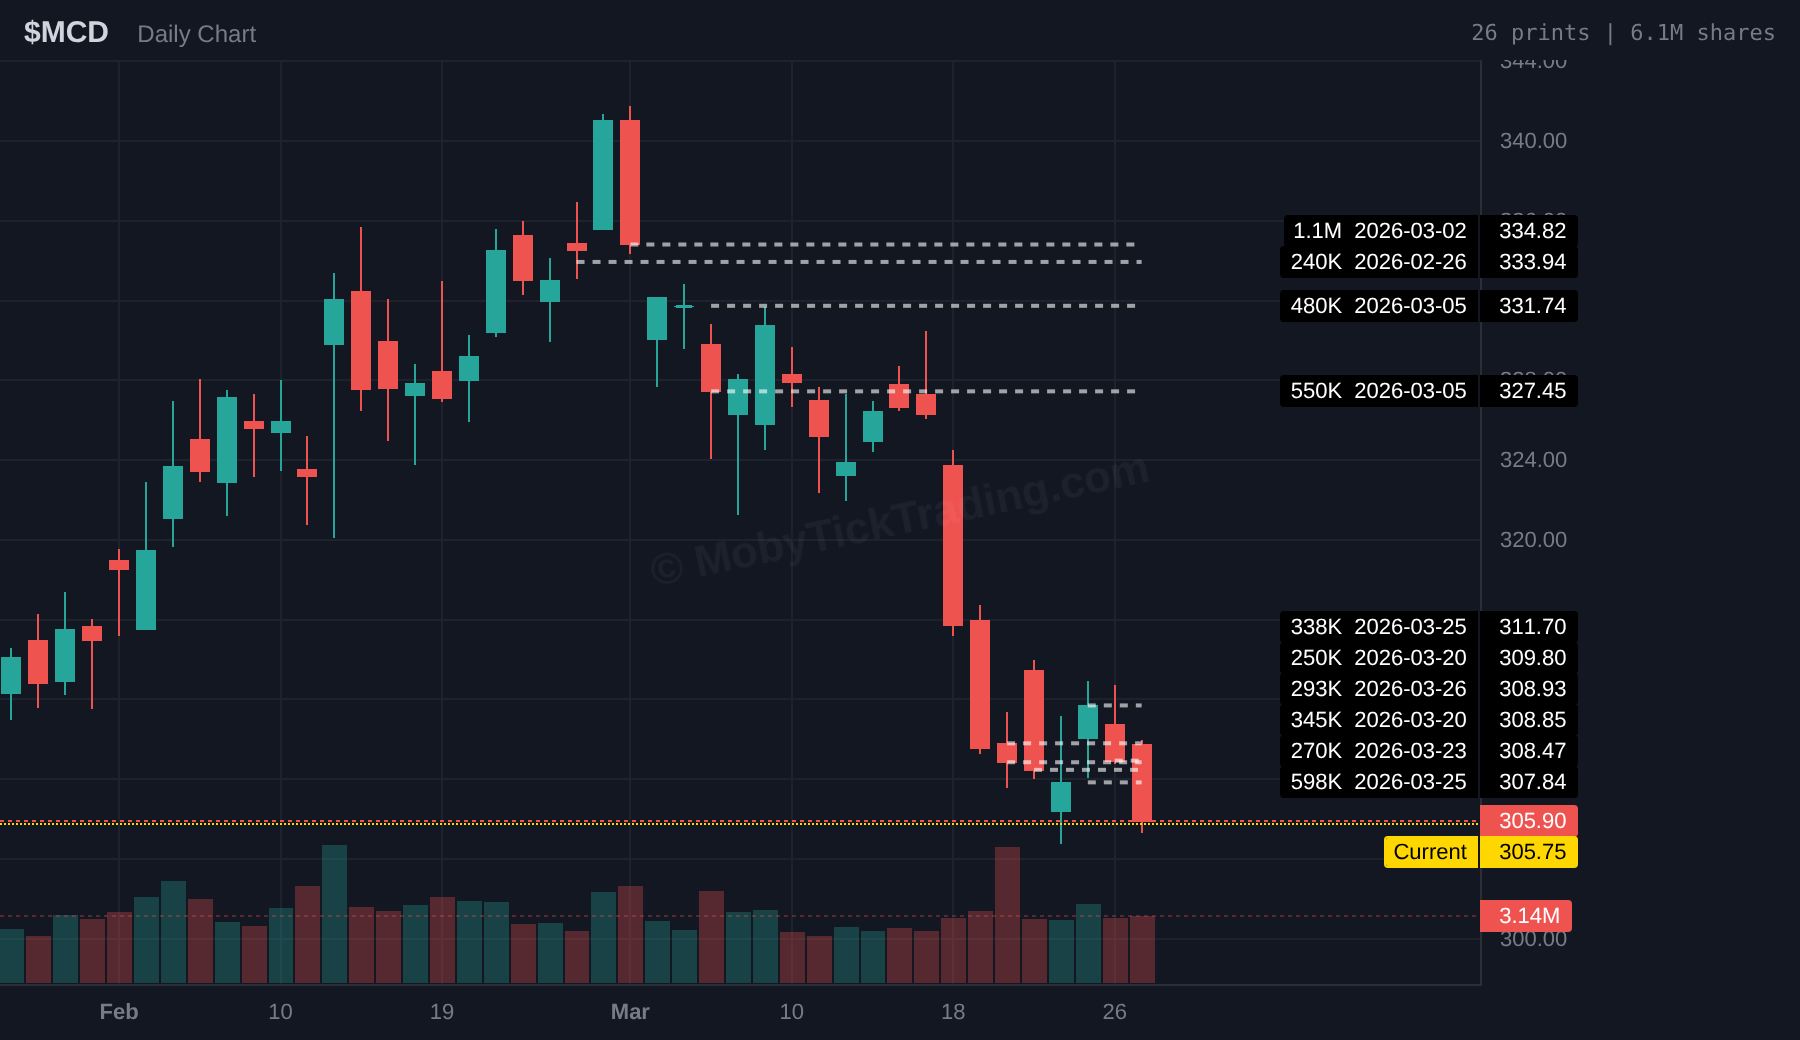
▲ Bullish above $312.50 → Targets: $315, $317.50, $320, $322.50, $324, $325
▼ Bearish below $304.75 → Targets: $302.50, $300, $295, $292.50, $290
$UNH — $257.51
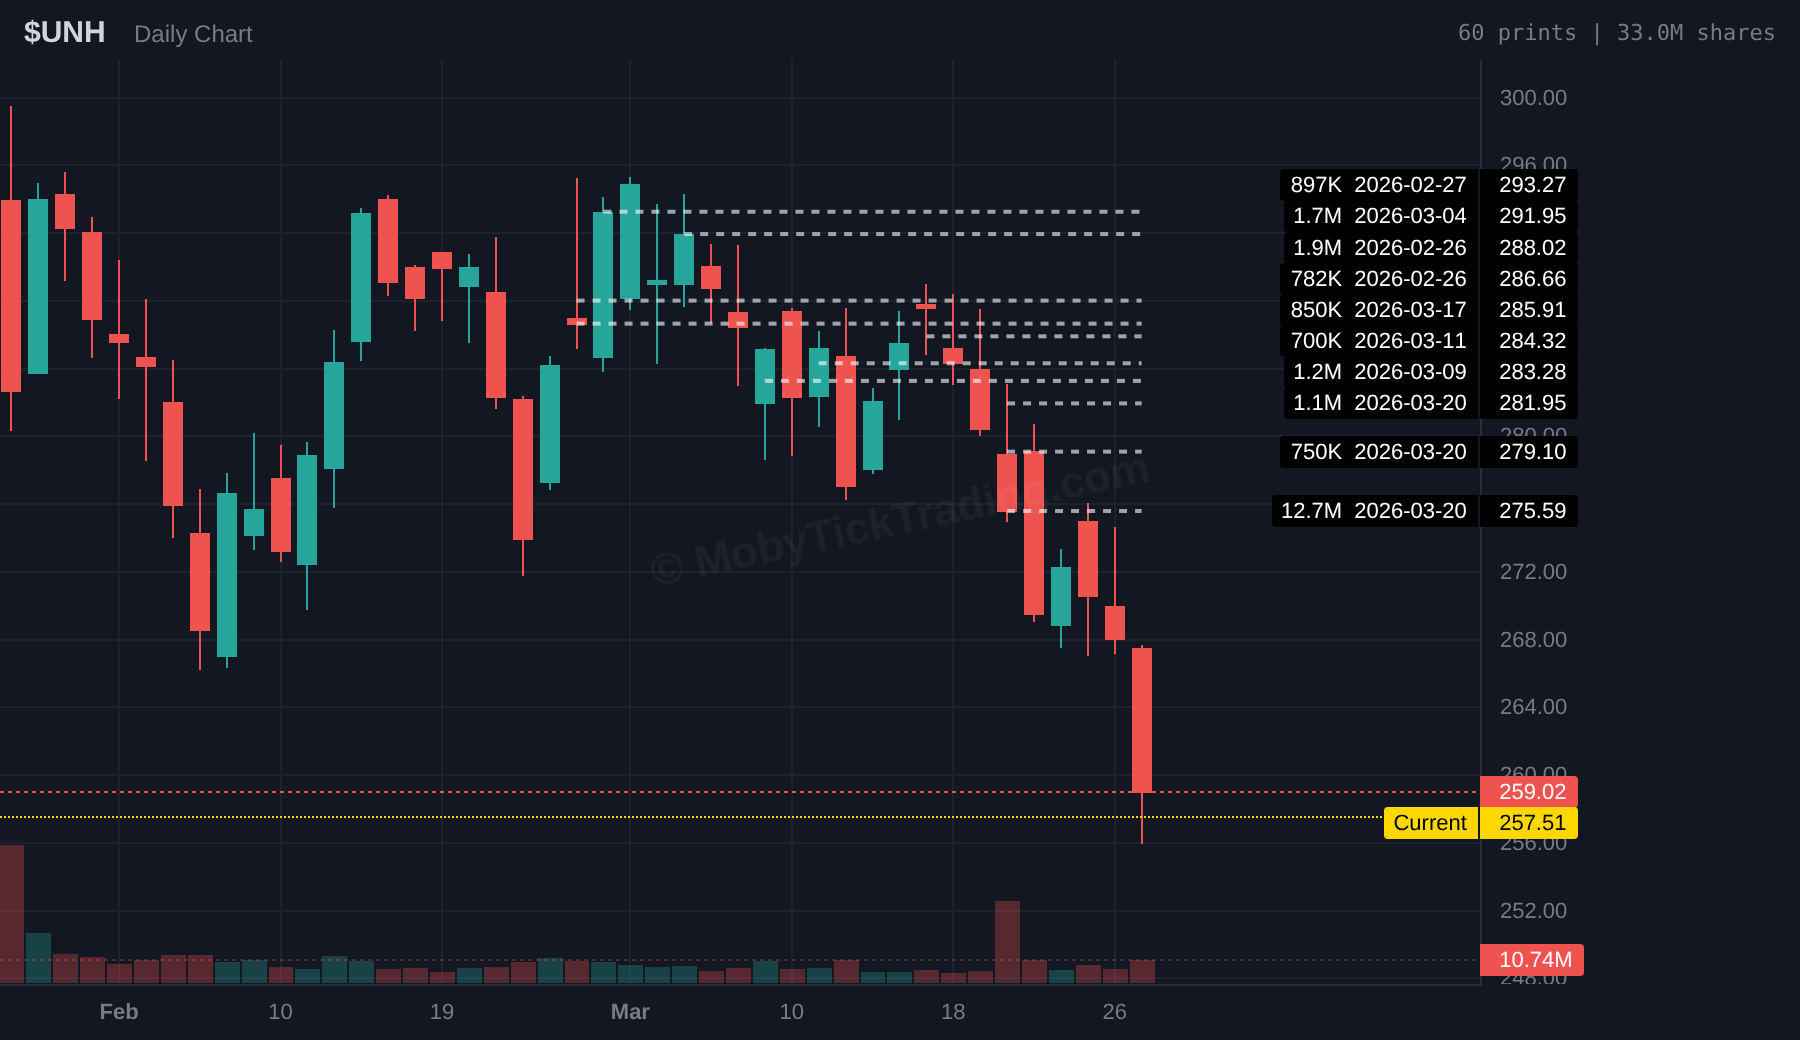
▲ Bullish above $272.50 → Targets: $275, $277.50, $280, $285, $290
▼ Bearish below $257 → Targets: $255, $250, $245, $240, $230, $220
$META — $520.07
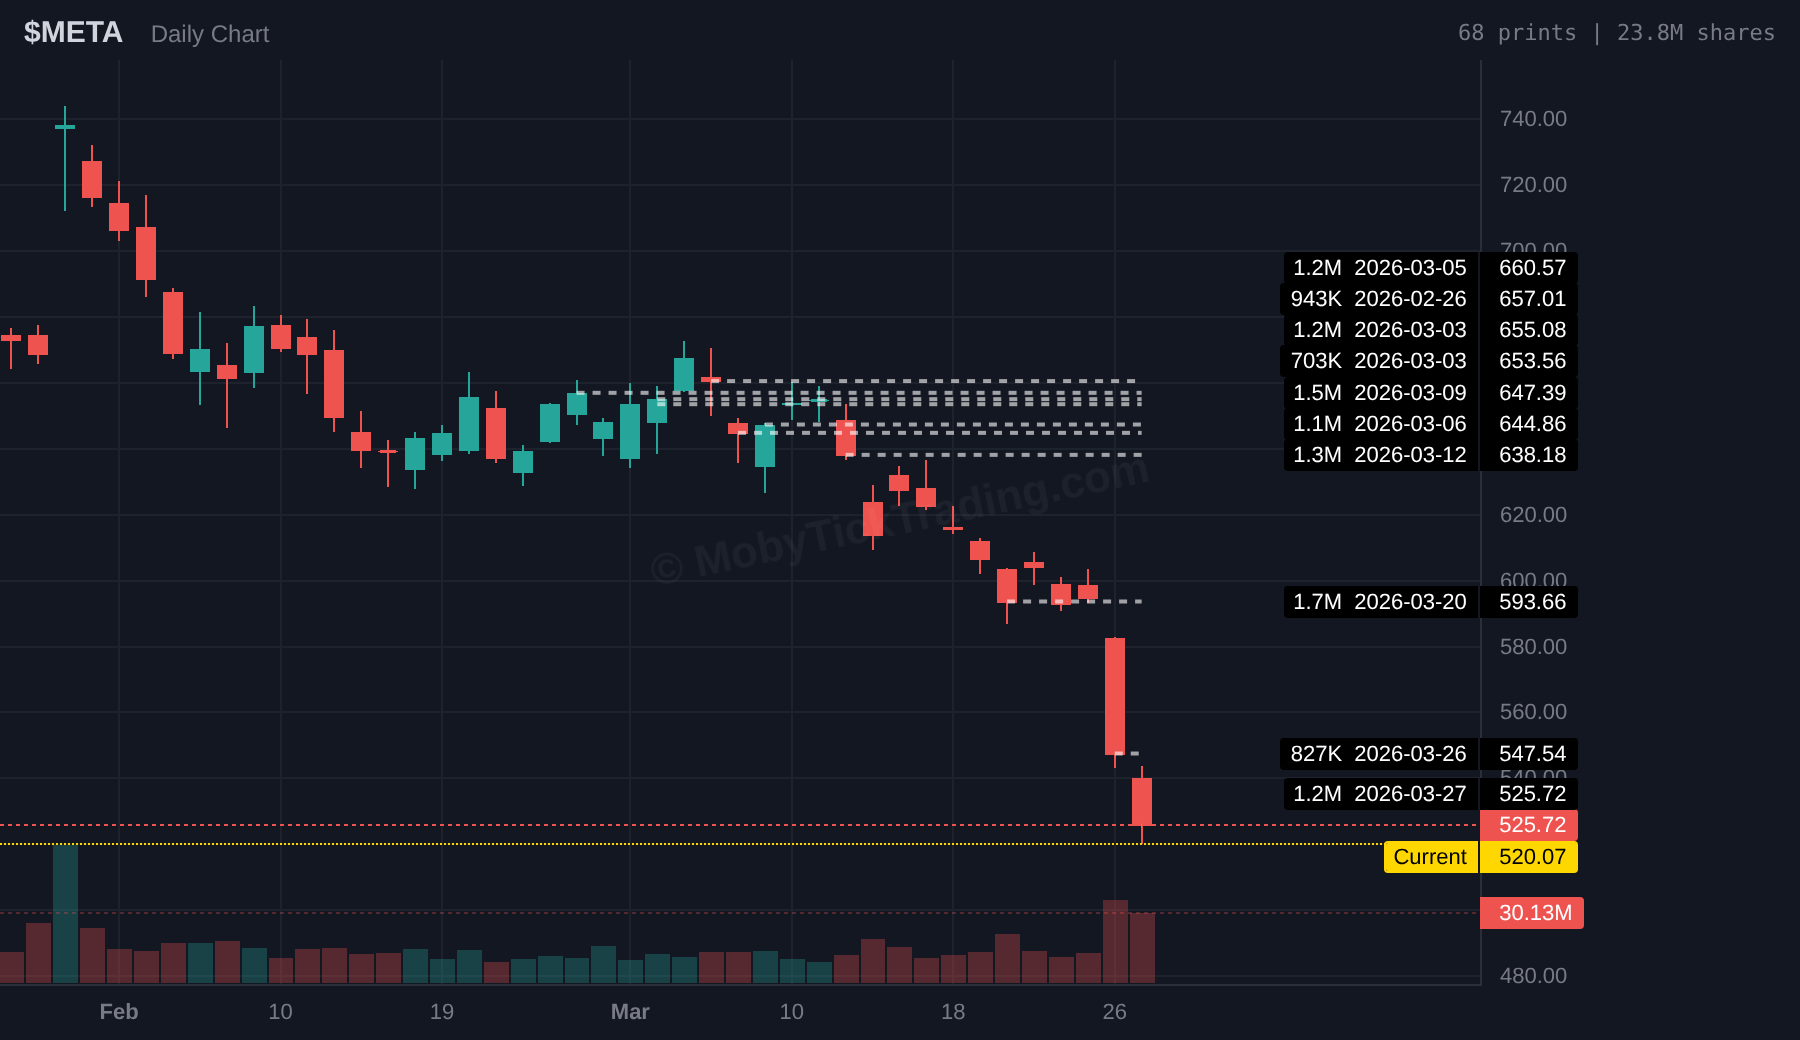
▲ Bullish above $550 → Targets: $555, $560, $570, $580, $590, $592.50
▼ Bearish below $517.50 → Targets: $510, $500, $490, $480, $475, $470
$NVDA — $166.60
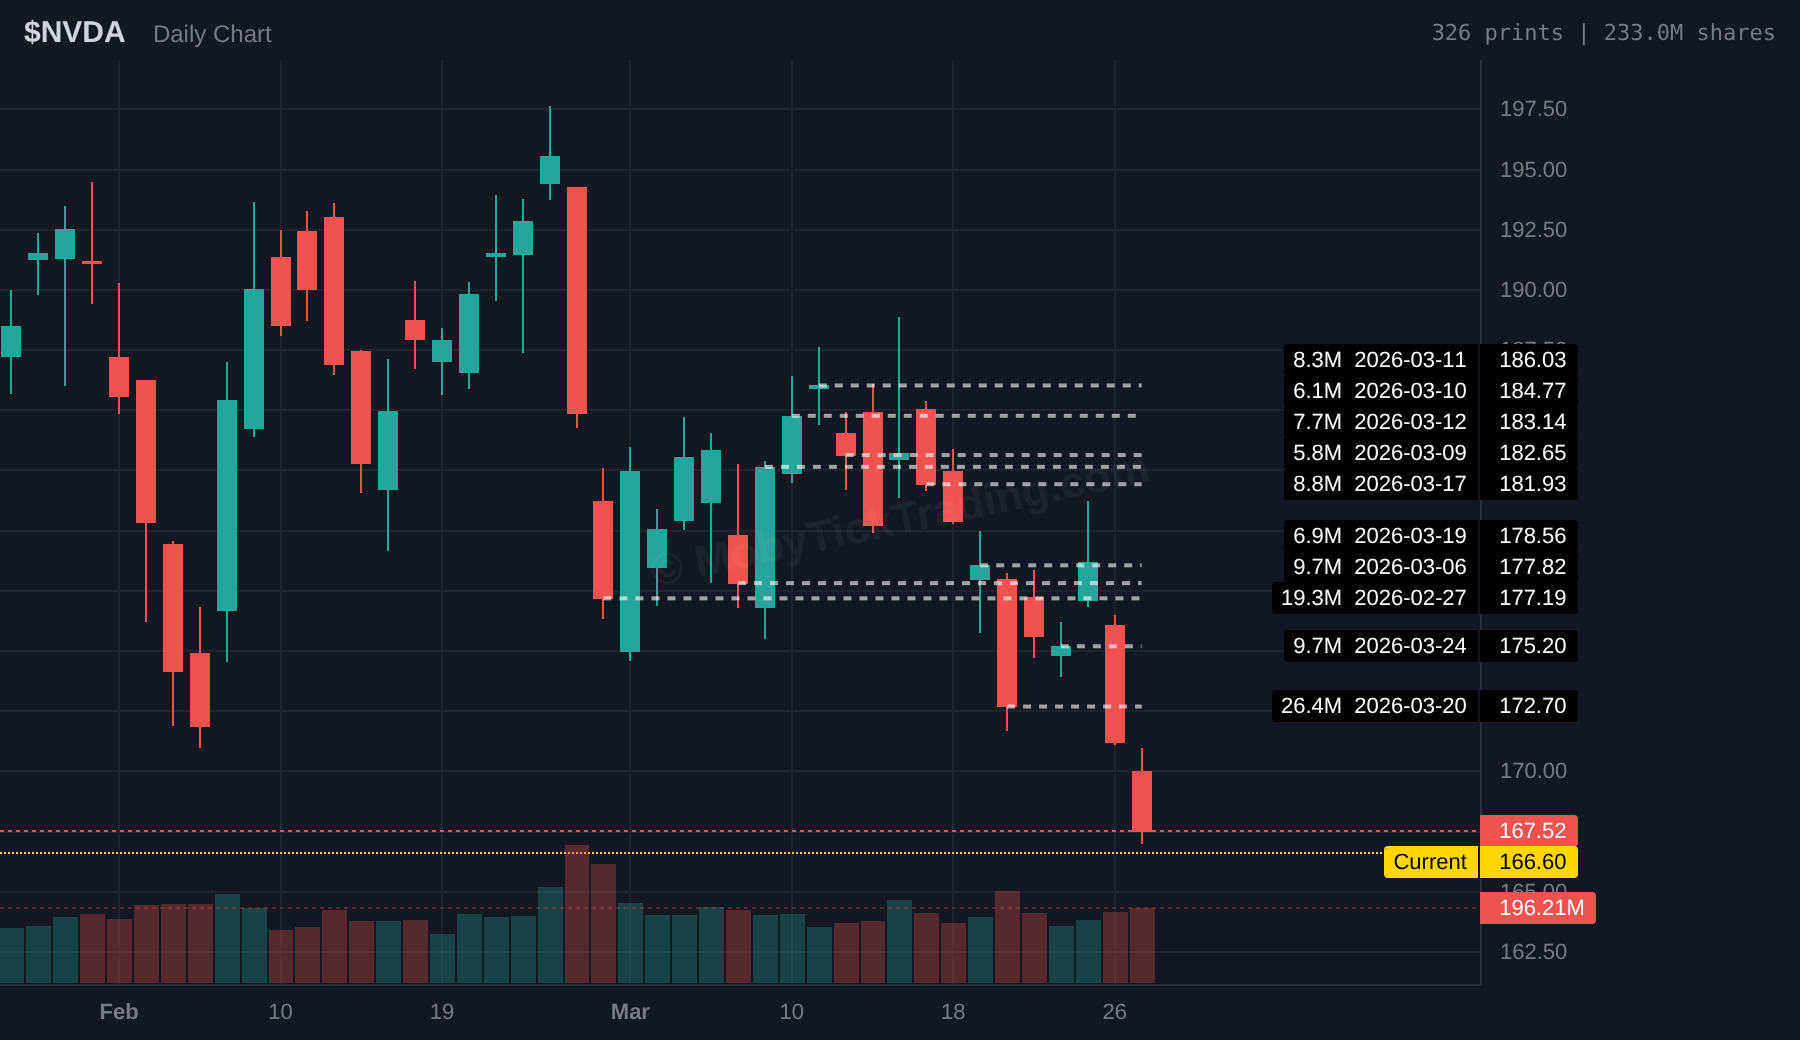
▲ Bullish above $173 → Targets: $175, $177.50, $178.25, $180, $182.50, $185, $190
▼ Bearish below $165 → Targets: $162.50, $160, $158, $155, $150, $140
📚 How Do You Know When We’re at the Bottom?
Five straight losing weeks. The Dow in correction territory. Oil surging toward $100. Every headline is screaming doom. So the question every trader is asking right now: when does this end?
The answer won’t come from the news. Analysts are quite often wrong — and make the worst traders. The talking heads on TV will tell you to sell at the bottom and buy at the top. They always have.
The real answer comes from the dark pools. Bottoms aren’t called by pundits — they’re built by institutional capital. Here’s what to look for:
Step 1: Massive New Prints Appear
When institutions decide a stock has fallen far enough, they start buying — in size. We’re talking hundreds of millions of dollars in dark pool trades at specific price levels. One large print is interesting. Multiple large prints at the same level over several days? That’s an institution building a position.
Step 2: The Level Holds
This is the critical part. A big print alone doesn’t make a bottom. The price has to hold above that level. If the stock breaks below where hundreds of millions were committed, that’s a failed floor — not a bottom. But when the price retests and bounces, again and again, that’s institutions defending their position.
Step 3: The Reversal
Once price holds above the institutional zone and starts closing consistently higher, the bottom is likely in. The news will still be bearish. Retail will still be selling. But the smart money is already positioned — and the reversal follows.
Real Example: UNH — $285M Print Marks the Exact Bottom
Last summer, UnitedHealth (UNH) showed us exactly how this plays out. First, notice the consolidation of massive block trades between $295.17–$317.34 and the break below them on July 15, 2025. The institutions were finished distributing — UNH closed at $291.71 and fell all the way to $237.77 by August 1st. A $54 drop.
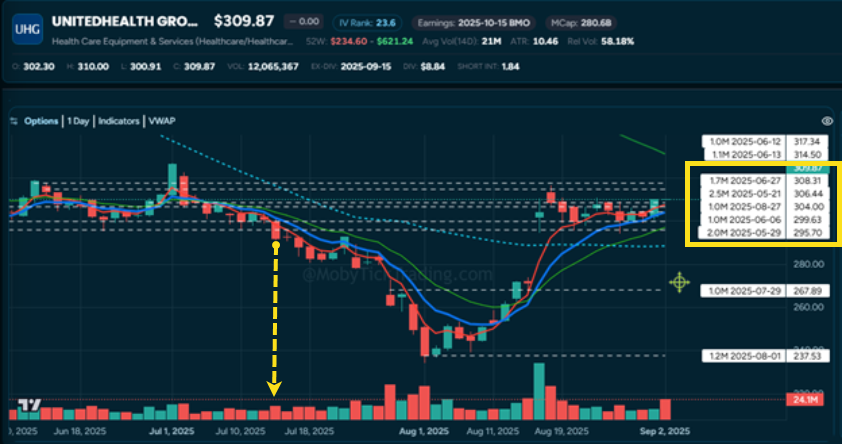
Dark pool prints consolidated between $295–$317. When price broke below on increasing volume, the downside move was clear.
Then on August 1st — right at the lows with maximum fear in the market — a 1.2 million share trade came in at $237.53, valued at $285,000,000. That’s not noise. That’s an institution drawing a line in the sand. That’s step one.
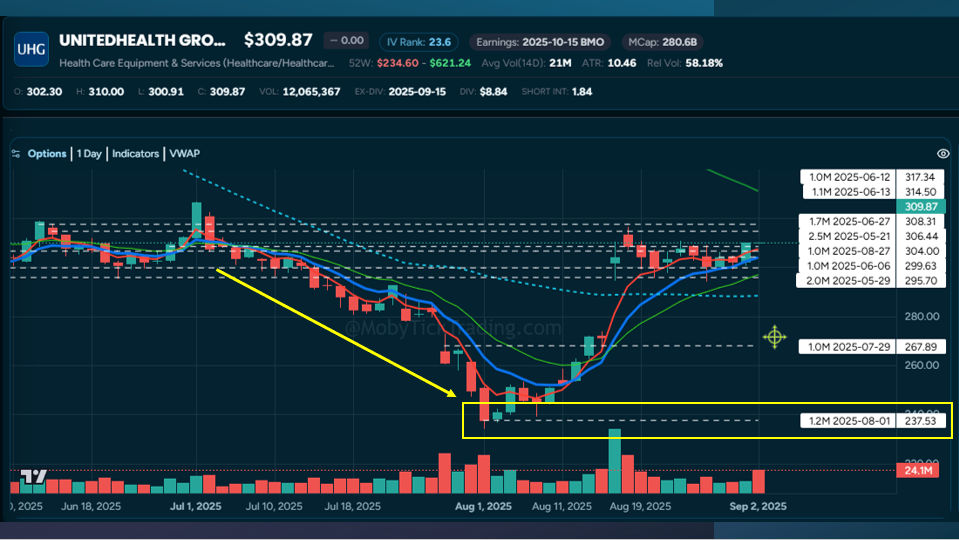
August 1st: A $285M dark pool print at $237.53 — the institutional floor. Step 1: Massive print appears.
The level held. UNH didn’t break below that $237 zone. That’s step two — the floor is confirmed.
Then on August 15th — just 10 days later — UNH gapped up $32.52 on news that Warren Buffett’s Berkshire Hathaway had invested $1.4–$1.6 billion. Step three: the reversal.
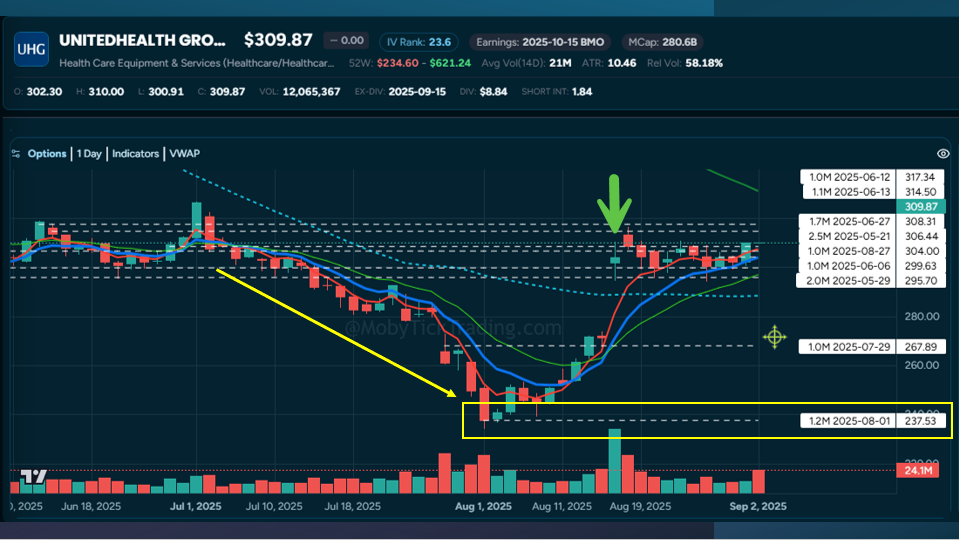
August 15th: UNH gaps up $32+ on Berkshire Hathaway news. Dark pool traders were already positioned days earlier.
Traders who followed the institutional money flow — not the news — were already in. Some captured 310% ROI on options trades. The news came after the institutions were positioned. By the time retail heard about Buffett, the bottom was already two weeks old.
What to Watch For Right Now
We’re in the fear phase of the current selloff. Apply the same framework to the tickers above:
- Watch for massive new prints — not just one big trade, but repeated prints at similar prices over multiple days
- Wait for the level to hold — retests that bounce confirm the floor is real
- Look for the reversal — price closing consistently above the print zone signals the bottom is in
- Ignore the headlines — the news will still be bearish when the bottom forms. That’s the point. Institutions buy fear.
A bottom isn’t a single candle — it’s a process. Dark pool data lets you see that process unfold in real time, while everyone else is guessing.
📖 Read the full UNH case study →
See These Levels in Real Time
Track institutional dark pool activity across 10,000+ stocks with over 6 years of historical data.
Free weekly report • Paid plans from $19.99/mo
About MobyTick
MobyTick Trading provides institutional-grade dark pool and block trade intelligence to retail traders. We track 10,000+ stocks with 6+ years of historical data and a 91% accuracy rate on trade callouts.
DISCLAIMER: This newsletter is for informational purposes only and does not constitute financial advice. Dark pool data shows where institutional trades have occurred — it does not predict future price movement. Always do your own research and consult a licensed financial advisor before making investment decisions. Past performance does not guarantee future results. Trading involves risk and you may lose your entire investment.