
Market Overview
Large-cap tech carried the week. QQQ led at plus 3.19% and SPY added 1.27%. DIA finished up 0.31%, while IWM was the only one of the four to decline, down 0.75%. For the S&P 500 it was the first winning week in the last three, and the index closed at 7,743.41, within 0.7% of the all-time high it set last month.
| ETF | Open | High | Low | Close | Week |
|---|---|---|---|---|---|
| SPY | 766.25 | 775.14 | 763.25 | 771.35 | +1.27% |
| QQQ | 727.89 | 748.35 | 727.81 | 744.50 | +3.19% |
| IWM | 286.27 | 288.94 | 279.05 | 281.97 | -0.75% |
| DIA | 520.03 | 522.55 | 510.42 | 517.49 | +0.31% |
Most of the week’s gains came on Monday, September 21. Chip stocks surged on early signs of traction for Meta’s “Muse” AI agent, which topped the US App Store free chart. AMD closed at $615.52 and finished above a $1 trillion market cap for the first time. INTC rose 12% to $121.78 and ARM gained 17%. The Philadelphia Semiconductor Index rose 4.3%, its fifth straight gain. By Friday SMH was up 5.86% on the week and XLK was up 3.52%.
The rise in stocks came as Treasury yields climbed to their highest levels since 2007. The 10-year yield jumped 13 basis points on Wednesday to 5.104%, its biggest one-day move since April 2025. It traded up to 5.23% intraday on Friday and closed near 5.17%. The 30-year yield reached its highest level since 2004. Three things pushed yields higher on Wednesday. Fed Governor Michael Barr said further policy adjustments are “likely to be needed” to bring inflation to target. S&P Global’s flash PMIs for manufacturing and services came in at their highest in more than four years. The survey’s price gauge hit its highest level since October 2022. Rate-sensitive groups fell behind: XLU lost 3.87%, TLT lost 2.38%, XLRE lost 2.28% and XLF lost 1.83%.
Crude traded on US–Iran headlines all week. On Friday it fell on reports that the two sides had moved closer to an agreement to lift naval blockades on tankers. WTI settled at $92.41 and Brent at $97.44. On the week, USO fell 3.57% and XLE fell 3.53%. The economic data was mixed. Initial jobless claims came in at 197,000, down from a revised 198,000 and the lowest level since July. The University of Michigan’s final September consumer sentiment reading was 48.1, up from the 47.8 preliminary reading but still a four-month low, and below August’s 51.7.
Across all names, dark pool notional totaled $462.92B over 20,755 aggregated print levels at or above 50,000 shares. The four largest single-stock readings were WBD at $5.67B, MSFT at $4.86B, MU at $4.48B and AMD at $4.04B.
Last week’s levels
All 13 callouts from the prior issue triggered: 9 on the Above side, 4 on the Below side, and none stayed inside their band. Nine names reached at least one target, for a total of 21 targets hit.
INTC led the group. It reached all 5 of its targets and ran 14.30% past its 111.50 Above trigger to a 127.44 high. QQQ reached 5 of 6 targets, topping out at 748.35. PLTR reached 4 of 6 on its way to a 194.68 high. MU crossed 1,042.50 and reached its first target at 1,100.00. IBIT reached its first target at 48.25, and IREN reached its first target at 49.25. HOOD reached its first target at 125.00. SPY triggered right at Monday’s open and reached its second target at 775.00.
On the Below side, IWM crossed 282.50 and reached its first target at 280.00 with a 279.05 low. CMCSA crossed 22.00 without reaching a target. BE, NKE and ICE each crossed both their Above and Below levels during the week, and none of the three reached a target.
This week’s coverage
Thirteen tickers carry levels into September 28 to October 2. The dark pool figures below cover aggregated levels at or above 50,000 shares for September 21 to 25.
| Ticker | DP notional | Shares | Levels | Avg print price |
|---|---|---|---|---|
| SPY | $41.72B | 54.21M | 57 | $769.72 |
| QQQ | $27.81B | 37.52M | 98 | $741.13 |
| WBD | $5.67B | 184.65M | 99 | $30.71 |
| IWM | $5.05B | 17.82M | 81 | $283.68 |
| MSFT | $4.86B | 9.66M | 29 | $503.60 |
| MU | $4.48B | 4.17M | 10 | $1,075.32 |
| AMD | $4.04B | 6.56M | 28 | $616.40 |
| INTC | $2.90B | 23.60M | 41 | $122.83 |
| SMCI | $534.4M | 12.81M | 55 | $41.72 |
| MRNA | $459.1M | 2.47M | 16 | $186.06 |
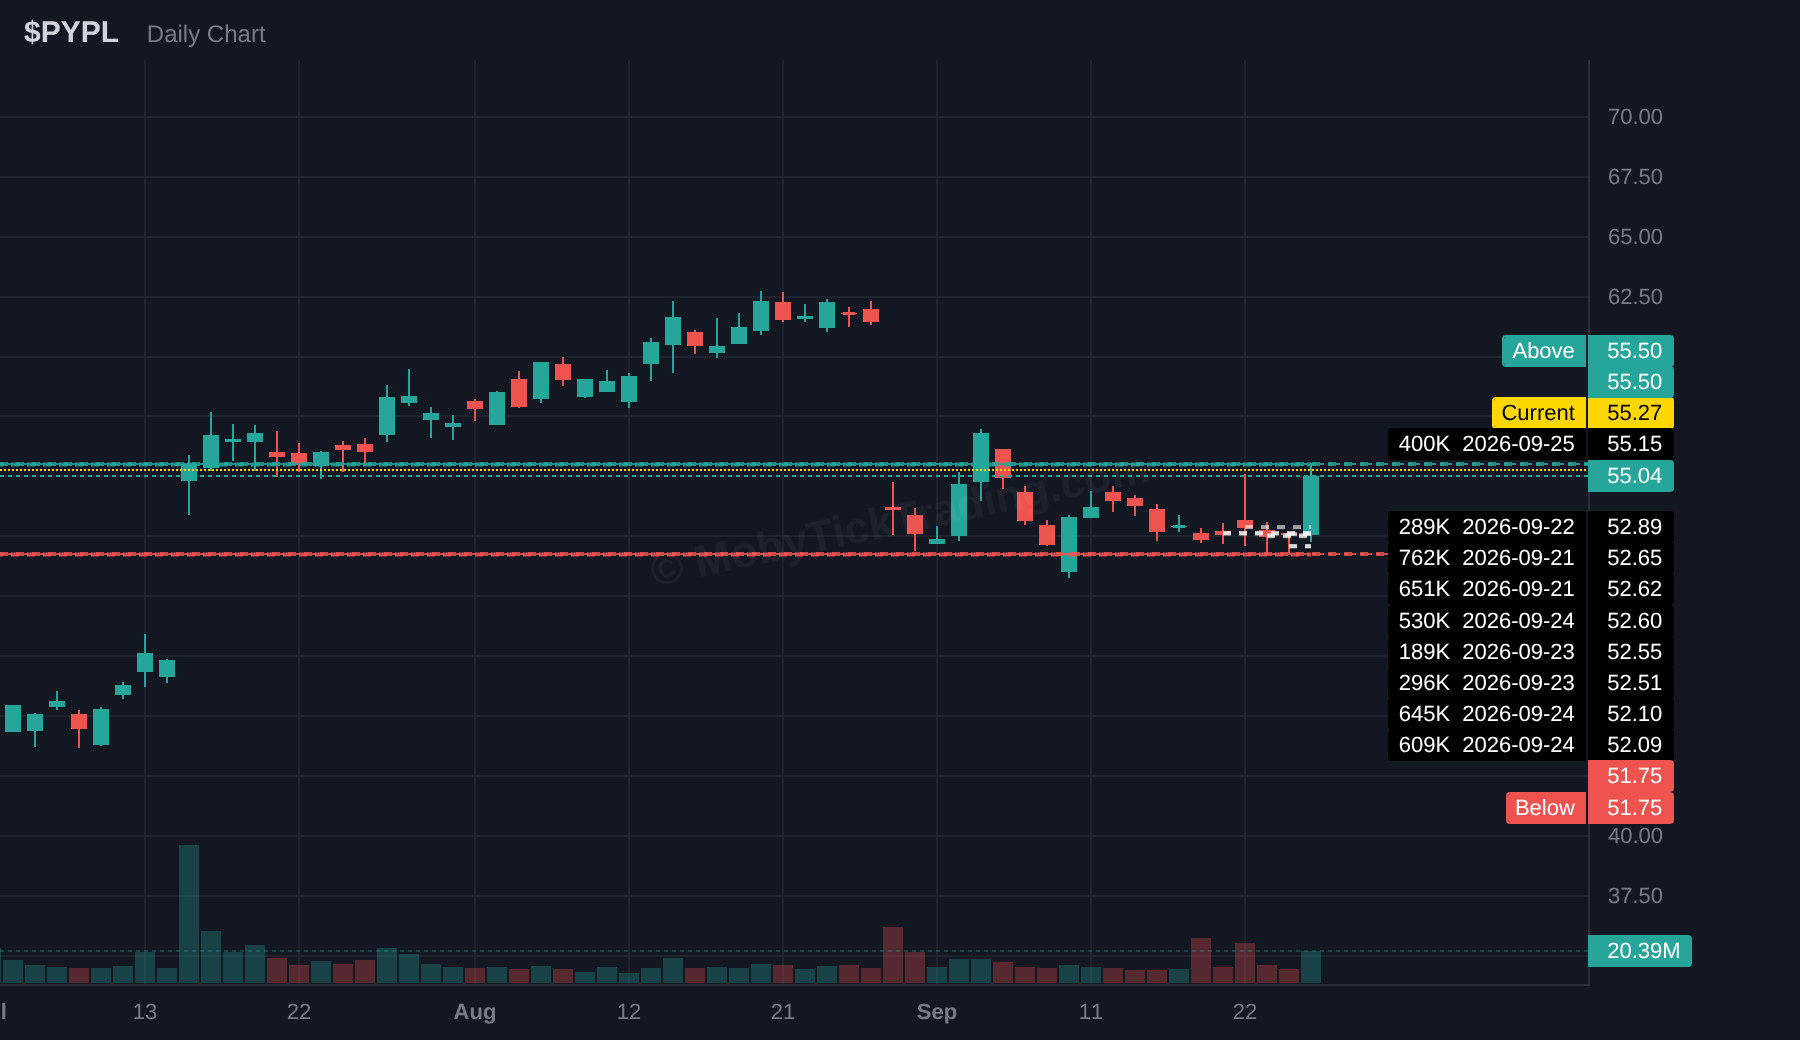
| PYPL | $230.3M | 4.37M | 9 | $52.71 |
| IONQ | $169.2M | 3.91M | 13 | $43.29 |
| ALHC | $99.7M | 12.79M | 39 | $7.80 |
The 10 single-stock names are WBD, MSFT, MU, AMD, INTC, SMCI, MRNA, ALHC, IONQ and PYPL. Every one of them was a recovery cross: each traded below its dark pool average print price at the weekly low, then closed the week back above it. MRNA had the widest spread, rising 29.11% on the week to a 198.88 close against a $186.06 average print price.
Data sourced from MobyTick.
Last Week’s Callout Performance
| Ticker | Above | Below | High | Low | Close | Triggered | Targets Hit | Move From Trigger |
|---|---|---|---|---|---|---|---|---|
| SPY | $766.00 | $754.00 | $775.14 | $763.25 | $771.35 | Above | 2 of 5 → T2 ($775.00) | $766.00 → $775.14 (+1.19%) |
| QQQ | $722.50 | $710.00 | $748.35 | $727.81 | $744.50 | Above | 5 of 6 → T5 ($745.00) | $722.50 → $748.35 (+3.58%) |
| IWM | $291.00 | $282.50 | $288.94 | $279.05 | $281.97 | Below | 1 of 3 → T1 ($280.00) | $282.50 → $279.05 (−1.22%) |
| IBIT | $46.50 | $42.00 | $49.22 | $47.05 | $47.57 | Above | 1 of 6 → T1 ($48.25) | $46.50 → $49.22 (+5.85%) |
| IREN | $47.50 | $40.00 | $49.37 | $43.41 | $44.12 | Above | 1 of 6 → T1 ($49.25) | $47.50 → $49.37 (+3.94%) |
| INTC | $111.50 | $100.00 | $127.44 | $114.93 | $123.00 | Above | 5 of 5 → T5 ($125.00) | $111.50 → $127.44 (+14.30%) |
| BE | $280.00 | $260.00 | $292.72 | $251.30 | $288.70 | Above | 0 of 5 | $280.00 → $292.72 (+4.54%) |
| MU | $1,042.50 | $900.00 | $1,108.72 | $1,030.02 | $1,082.28 | Above | 1 of 4 → T1 ($1,100.00) | $1,042.50 → $1,108.72 (+6.35%) |
| CMCSA | $23.50 | $22.00 | $23.13 | $21.41 | $21.91 | Below | 0 of 4 | $22.00 → $21.41 (−2.68%) |
| NKE | $37.00 | $35.50 | $37.03 | $35.22 | $35.75 | Below | 0 of 4 | $35.50 → $35.22 (−0.80%) |
| HOOD | $122.50 | $100.00 | $126.74 | $117.53 | $119.40 | Above | 1 of 5 → T1 ($125.00) | $122.50 → $126.74 (+3.46%) |
| PLTR | $178.25 | $169.00 | $194.68 | $176.76 | $189.67 | Above | 4 of 6 → T4 ($190.00) | $178.25 → $194.68 (+9.22%) |
| ICE | $158.00 | $152.00 | $158.08 | $151.42 | $154.31 | Below | 0 of 5 | $152.00 → $151.42 (−0.38%) |
Bullish Setups — Above Trigger
| Ticker | Above Trigger | Targets |
|---|---|---|
| SPY | $775.00 | $777.50 → $780.00 → $785.00 → $790.00 |
| QQQ | $748.50 | $750.00 → $755.00 → $760.00 → $765.00 → $770.00 |
| IWM | $290.00 | $292.50 → $295.00 → $297.50 → $300.00 |
| WBD | $31 | $32 → $32.5 → $34 → $35 → $36 |
| MSFT | $520 | $522.5 → $525 → $530 → $535 → $540 → $550 |
| MU | $1112.50 | $1125 → $1150 → $1175 → $1200 |
| AMD | $640 | $650 → $660 → $670 → $680 → $690 → $700 |
| INTC | $127.5 | $130 → $132.5 → $135 → $137.5 → $140 |
| SMCI | $44 | $45 → $46.25 → $47.5 → $50 |
| MRNA | $202.5 | $205 → $210 → $215 → $220 → $225 → $230 |
| ALHC | $8.5 | $9 → $9.5 → $10 → $11 → $12 → $12.5 |
| IONQ | $47 | $48 → $49 → $50 → $52.5 → $55 |
| PYPL | $55.5 | $56.25 → $57.5 → $60 → $61.25 → $62.5 → $64 |
Bearish Setups — Below Trigger
| Ticker | Below Trigger | Targets |
|---|---|---|
| SPY | $757.50 | $755.00 → $750.00 → $745.00 → $740.00 → $735.00 → $730.00 |
| QQQ | $734.00 | $730.00 → $725.00 → $720.00 → $715.00 → $712.50 |
| IWM | $279.00 | $277.50 → $275.00 → $272.50 → $270.00 → $267.50 → $265.00 |
| WBD | $30 | $29.50 → $29 → $28 → $27.5 → $27 → $26.5 |
| MSFT | $490 | $485 → $480 → $475 → $470 → $465 → $460 |
| MU | $1035 | $1025 → $1000 → $975 → $950 → $940 |
| AMD | $600 | $590 → $580 → $570 → $560 → $550 → $540 |
| INTC | $119 | $117.5 → $115 → $112.5 → $110 → $107.5 → $105 |
| SMCI | $39.75 | $39 → $38 → $37 → $35 → $32.50 |
| MRNA | $175 | $170 → $165 → $160 → $155 → $150 |
| ALHC | $7.36 | $7 → $6.5 → $6 → $5.5 → $5 |
| IONQ | $40 | $39 → $38 → $37 → $36 → $35 |
| PYPL | $51.75 | $51 → $50 → $48.75 → $47.5 → $45 → $42.5 |
This Week’s Setups — Ticker Detail
Each card below shows the dark pool flow data for the past week, along with the key trigger levels and profit targets for the upcoming week. Dark pool stats are sourced from MobyTick’s proprietary analytics.
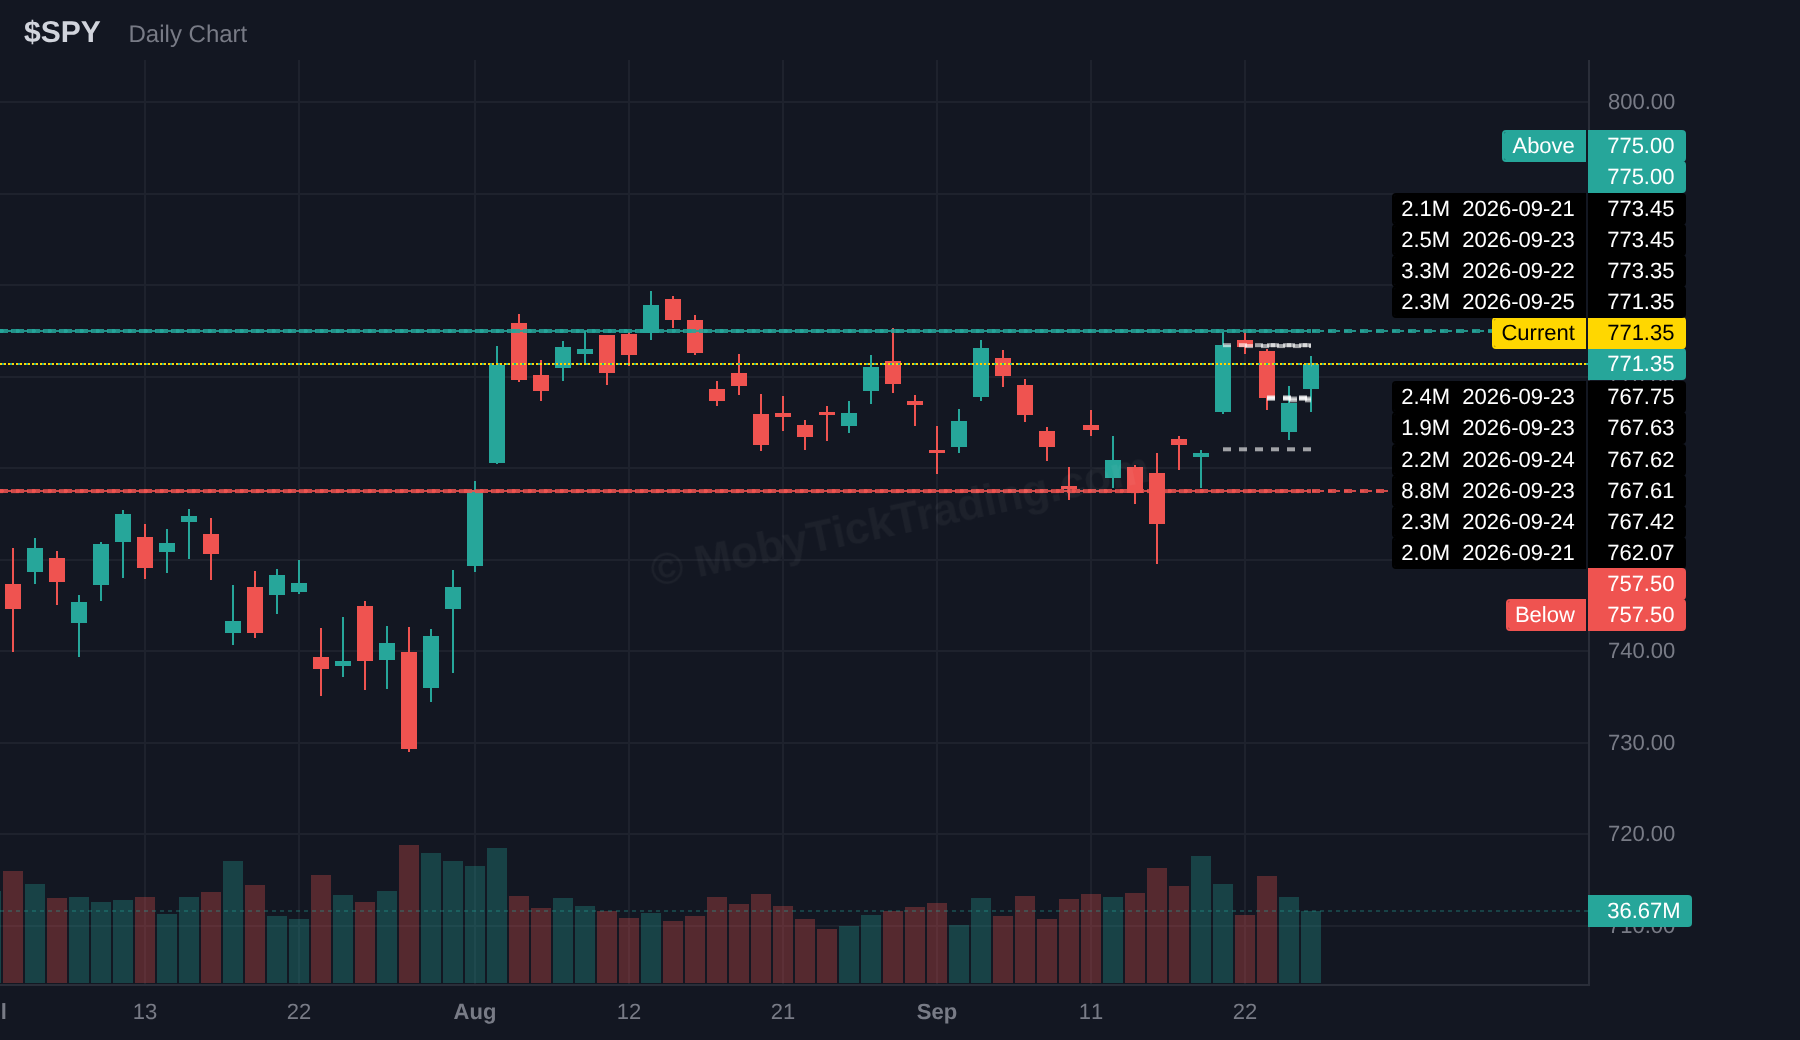
SPY
Above $775.00 → $777.50 → $780.00 → $785.00 → $790.00
Below $757.50 → $755.00 → $750.00 → $745.00 → $740.00 → $735.00 → $730.00
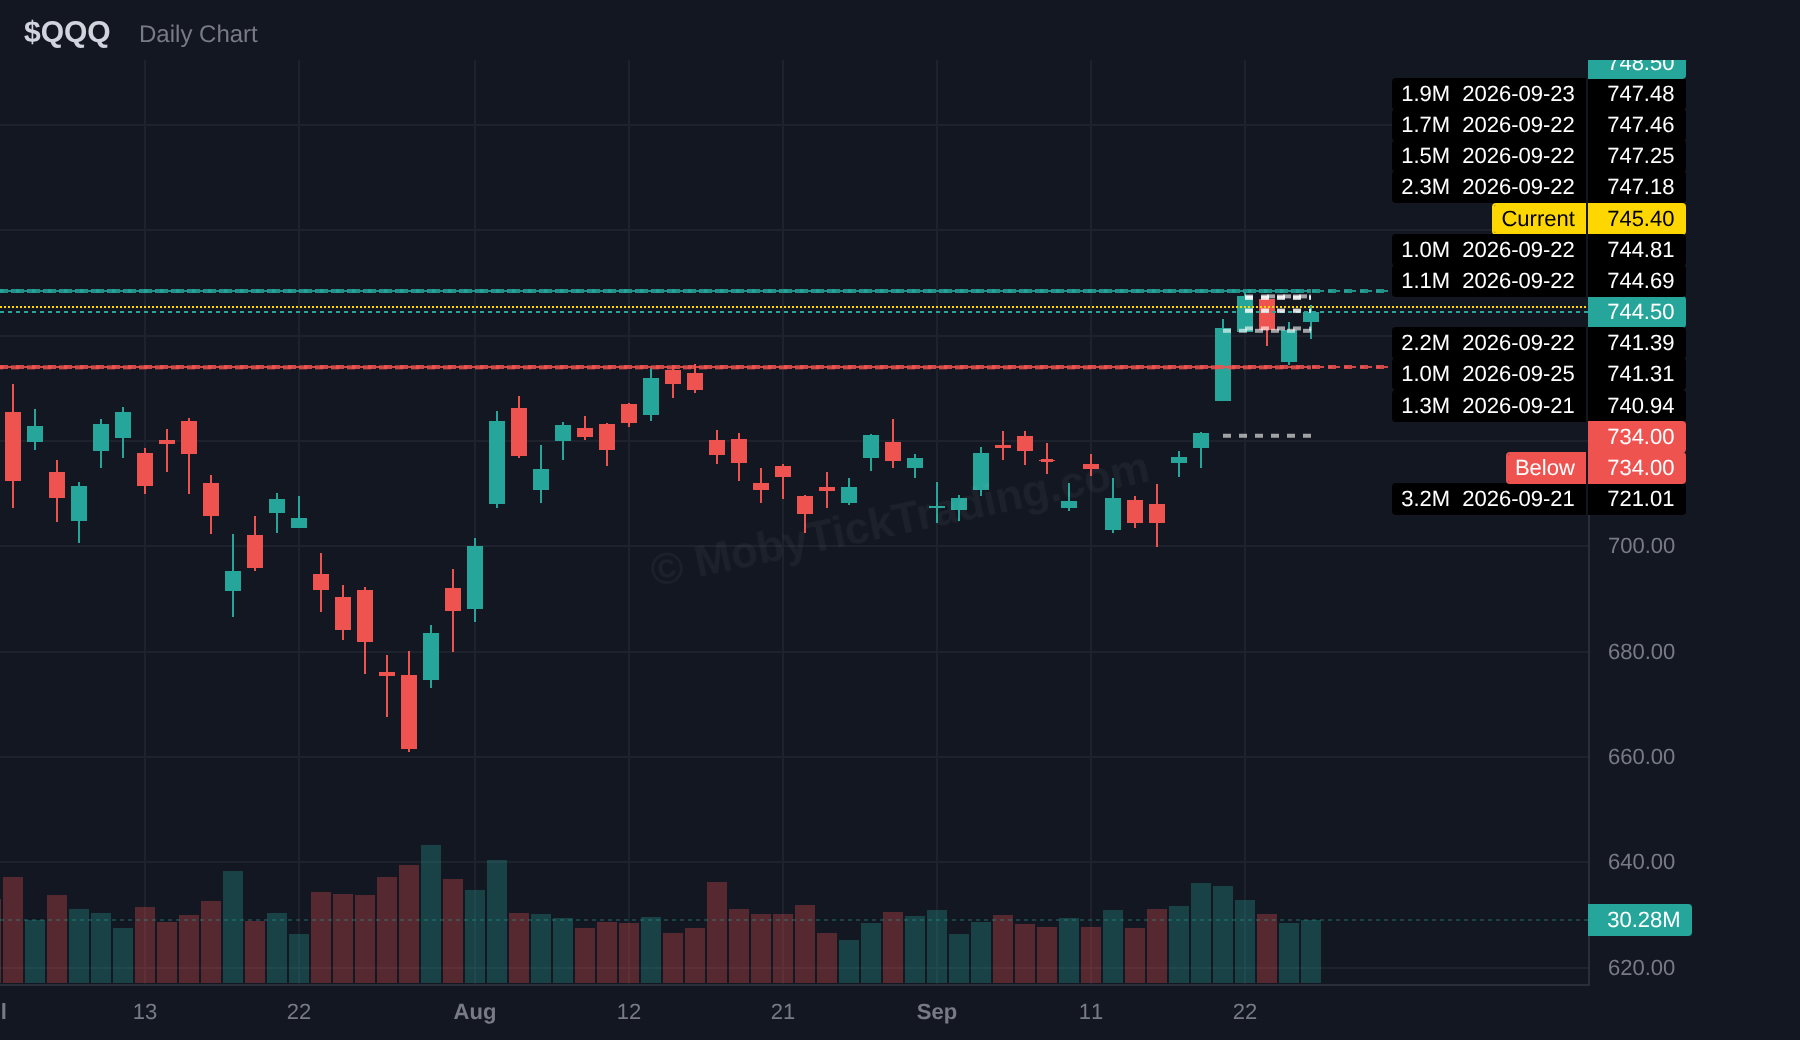
QQQ
Above $748.50 → $750.00 → $755.00 → $760.00 → $765.00 → $770.00
Below $734.00 → $730.00 → $725.00 → $720.00 → $715.00 → $712.50
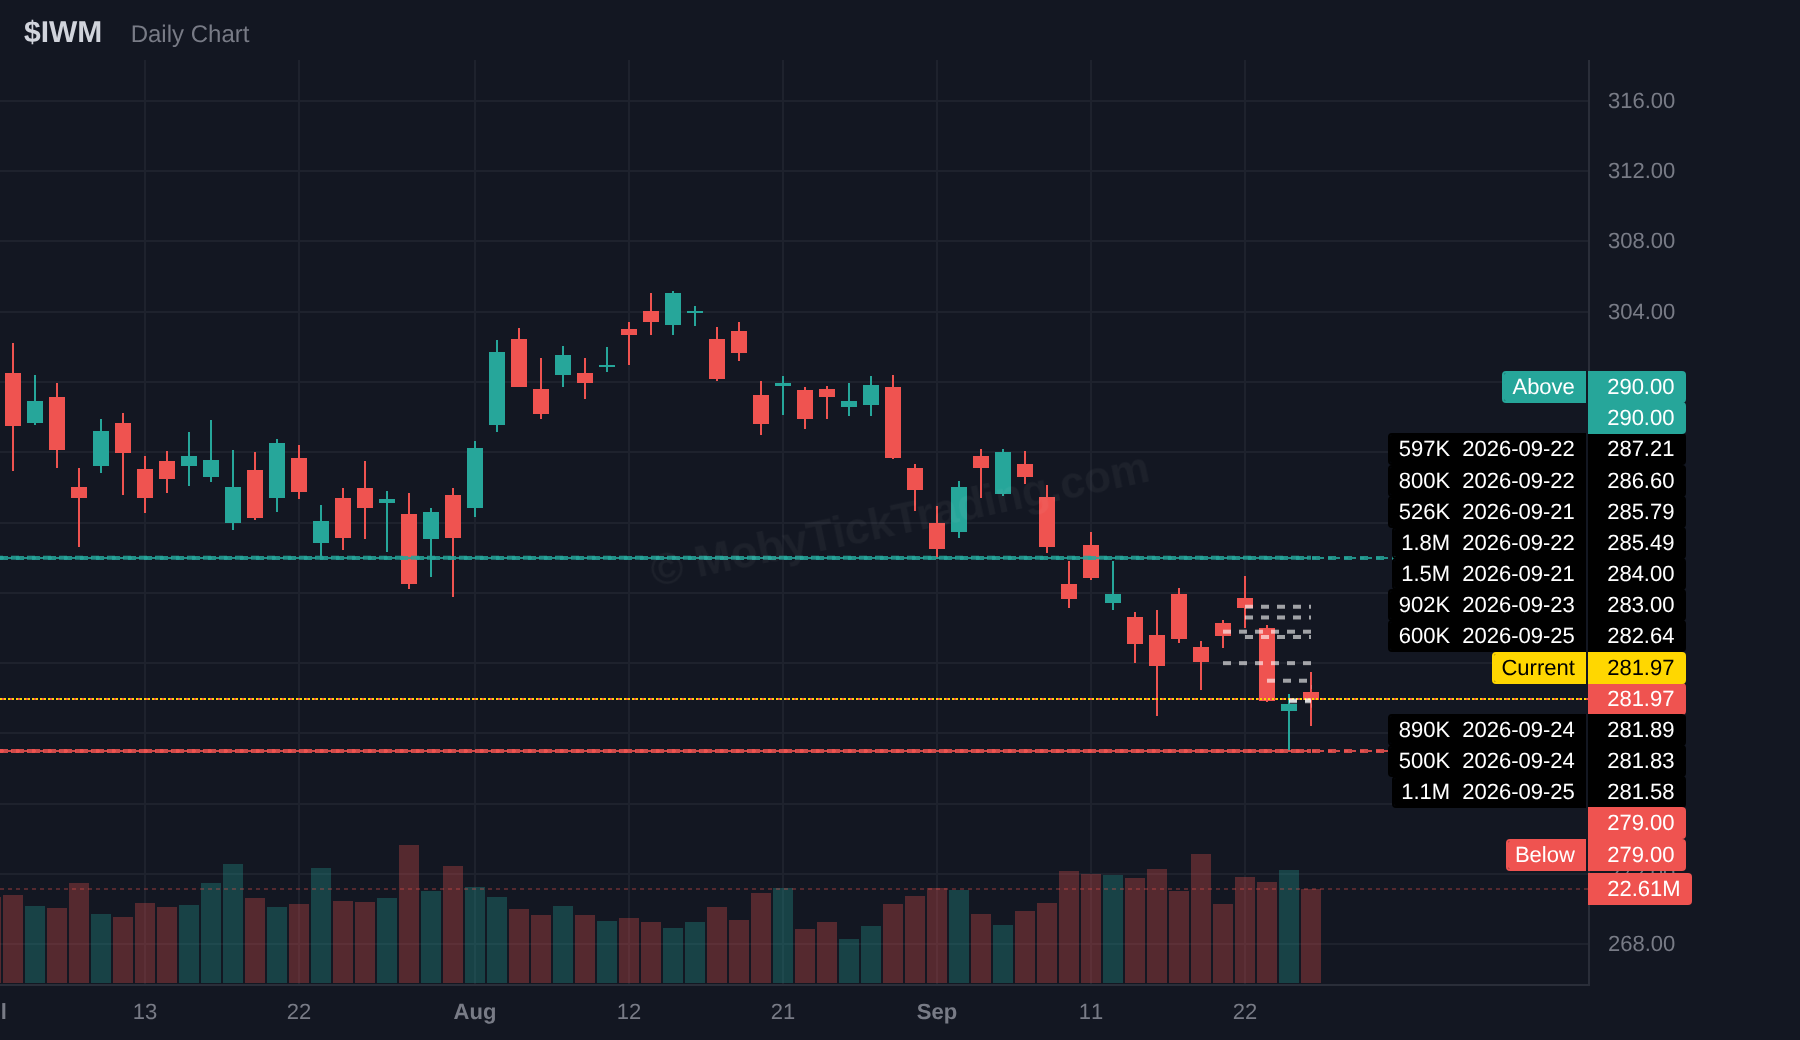
IWM
Above $290.00 → $292.50 → $295.00 → $297.50 → $300.00
Below $279.00 → $277.50 → $275.00 → $272.50 → $270.00 → $267.50 → $265.00
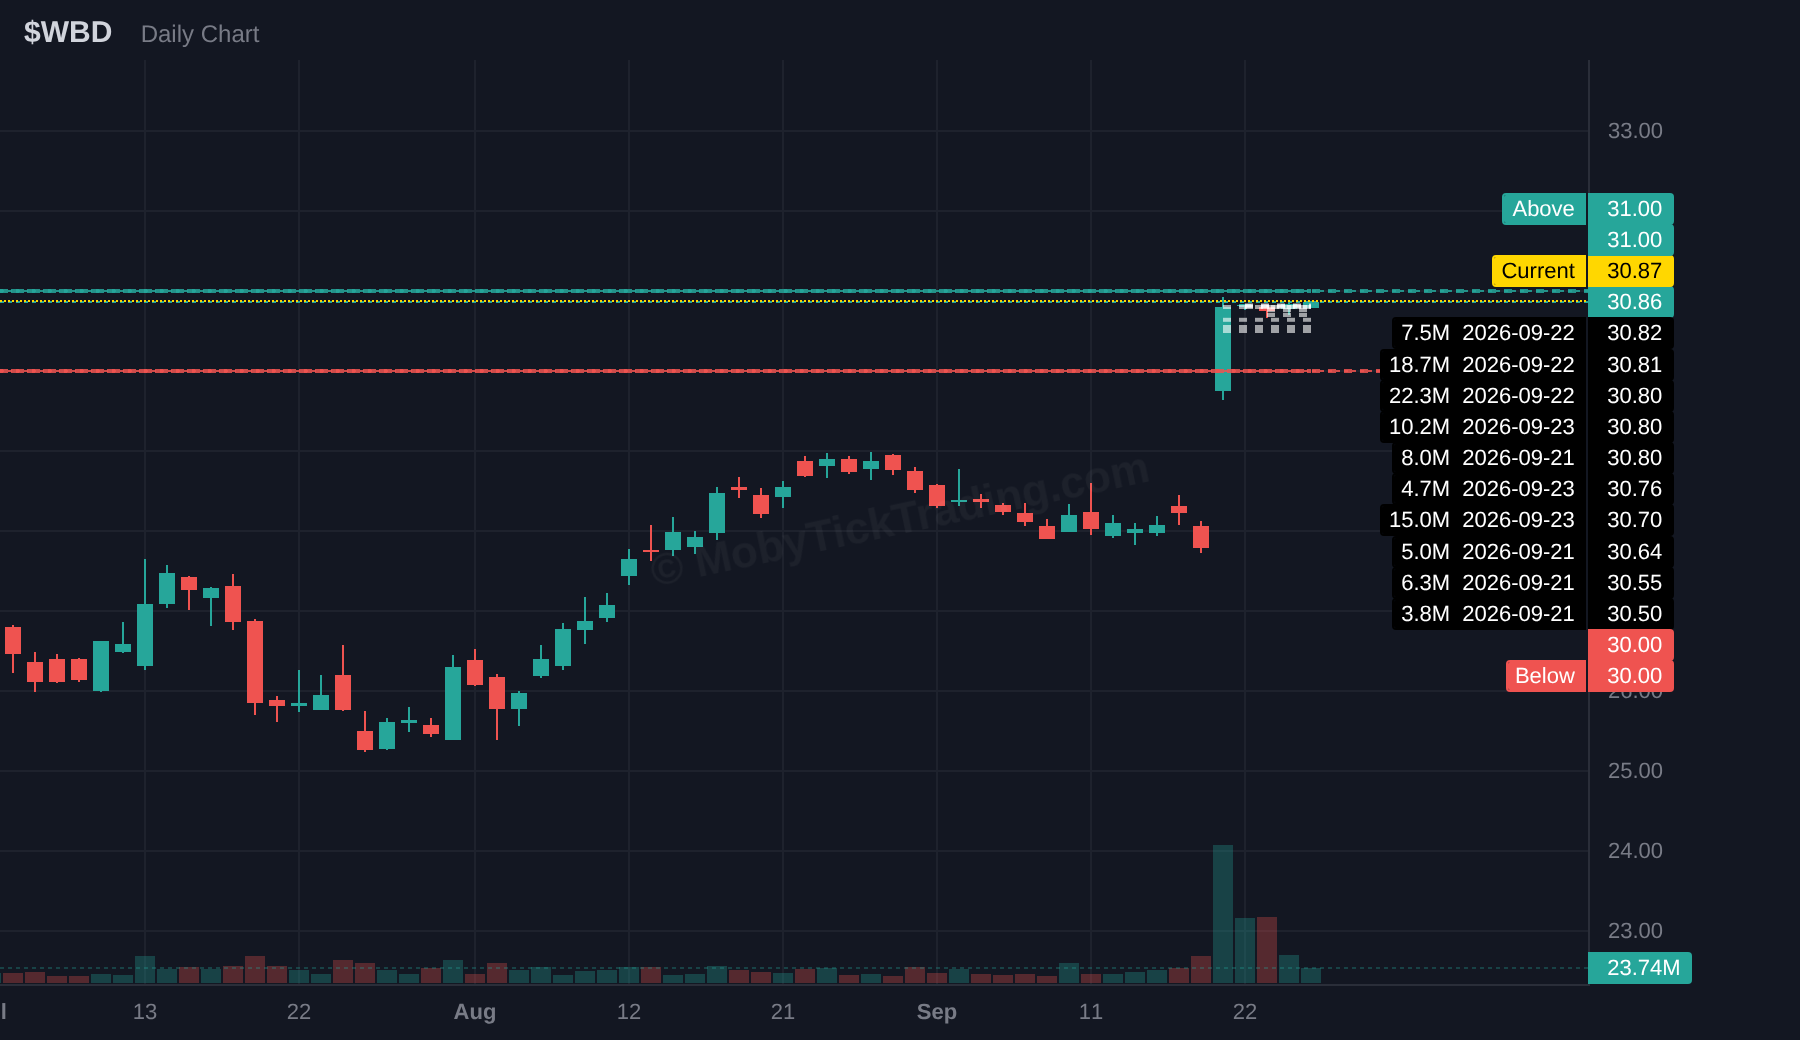
WBD
Above $31 → $32 → $32.5 → $34 → $35 → $36
Below $30 → $29.50 → $29 → $28 → $27.5 → $27 → $26.5
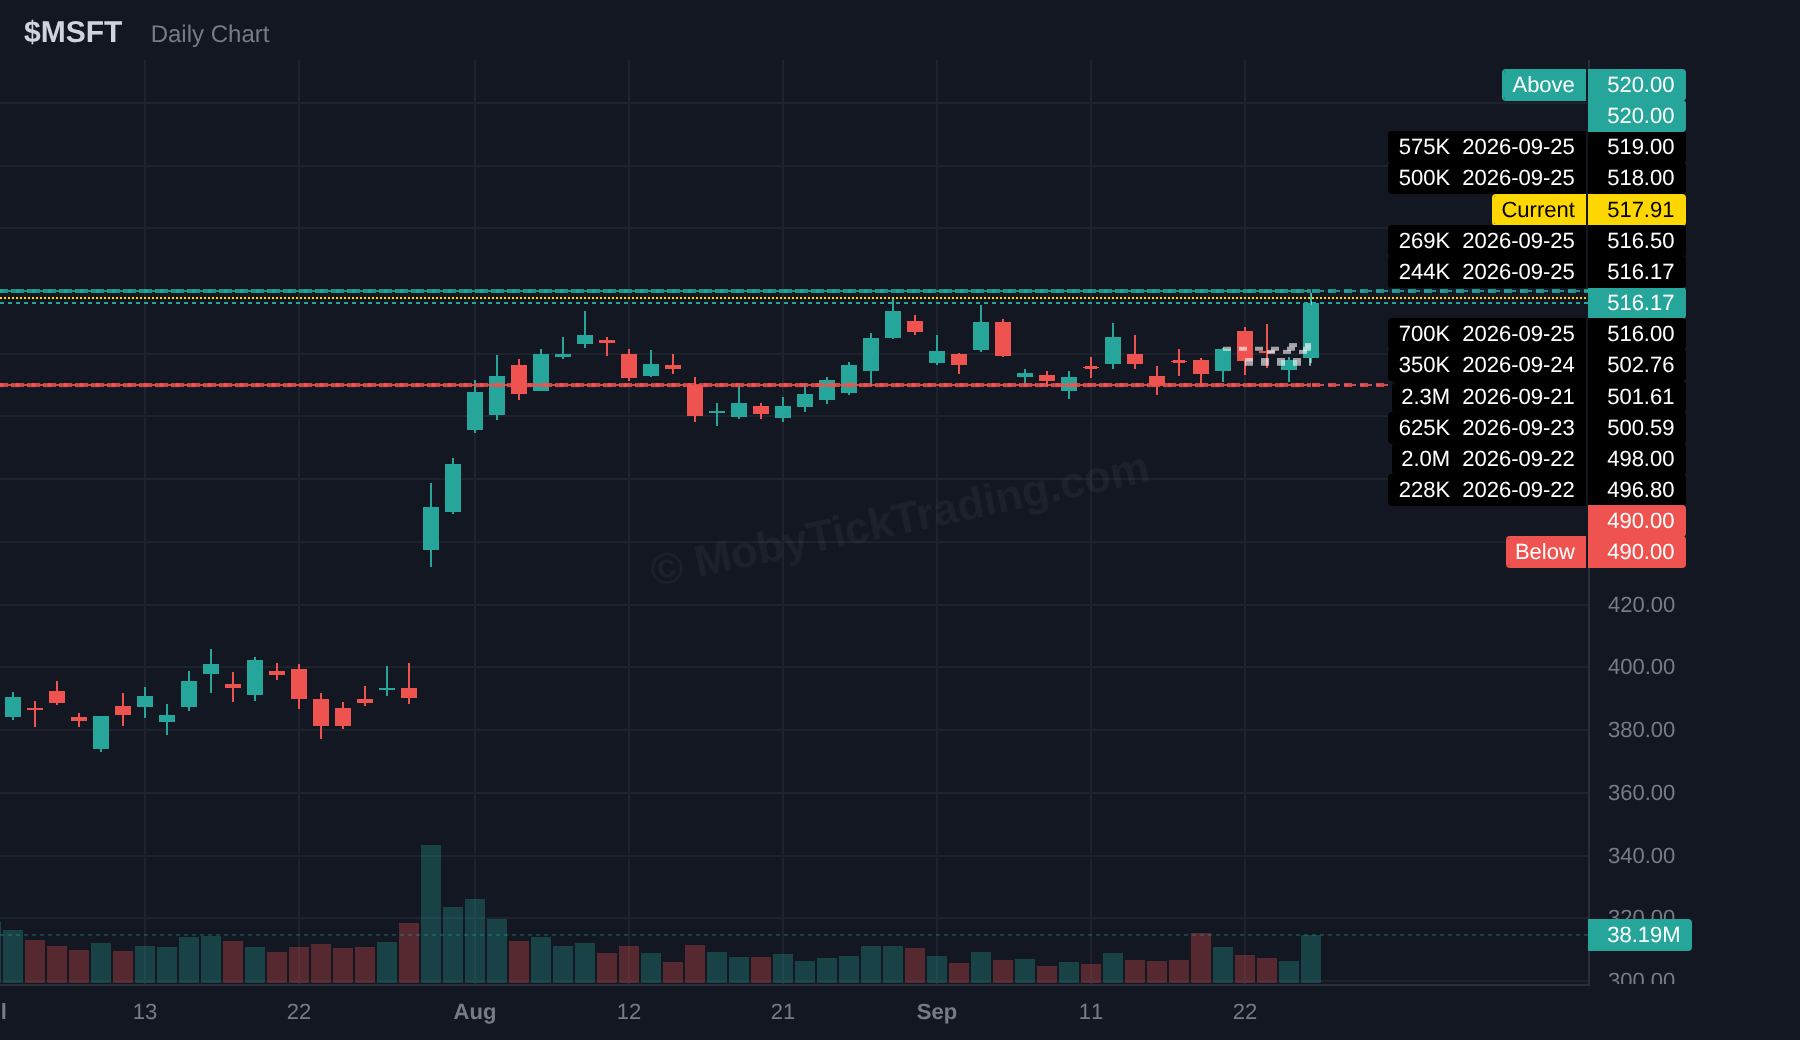
MSFT
Above $520 → $522.5 → $525 → $530 → $535 → $540 → $550
Below $490 → $485 → $480 → $475 → $470 → $465 → $460
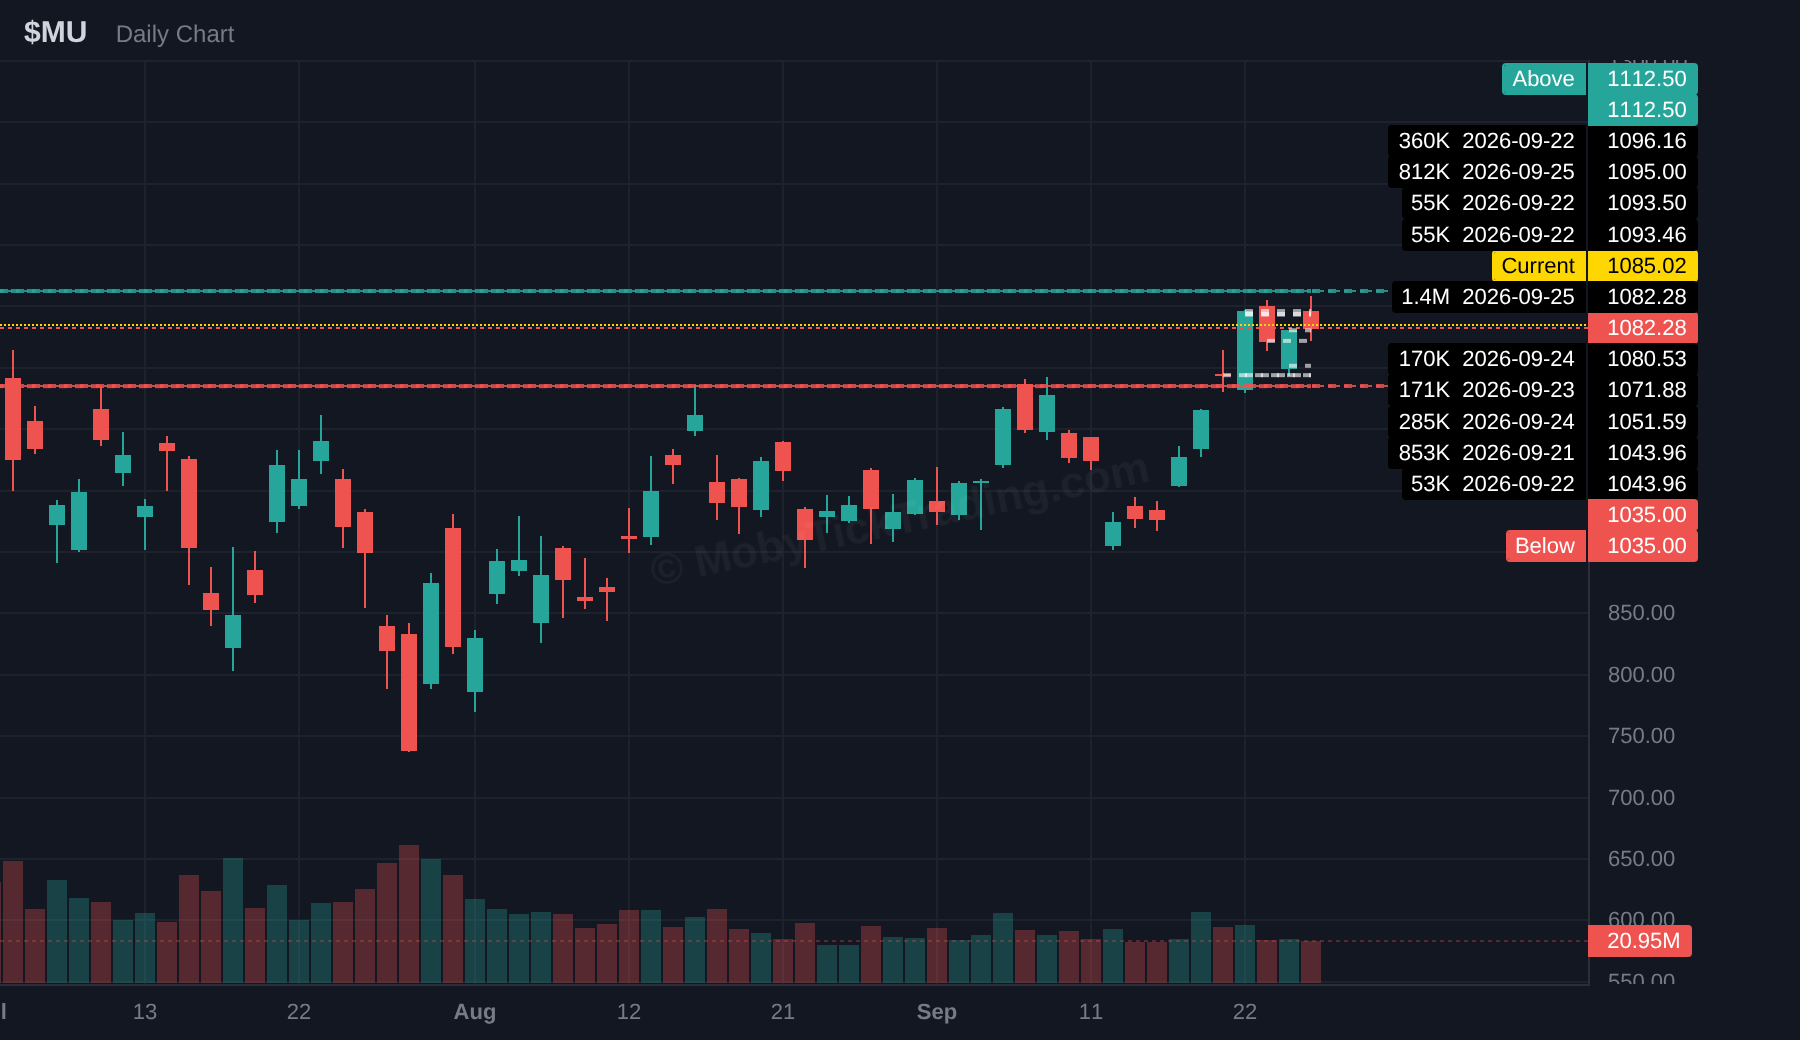
MU
Above $1112.50 → $1125 → $1150 → $1175 → $1200
Below $1035 → $1025 → $1000 → $975 → $950 → $940
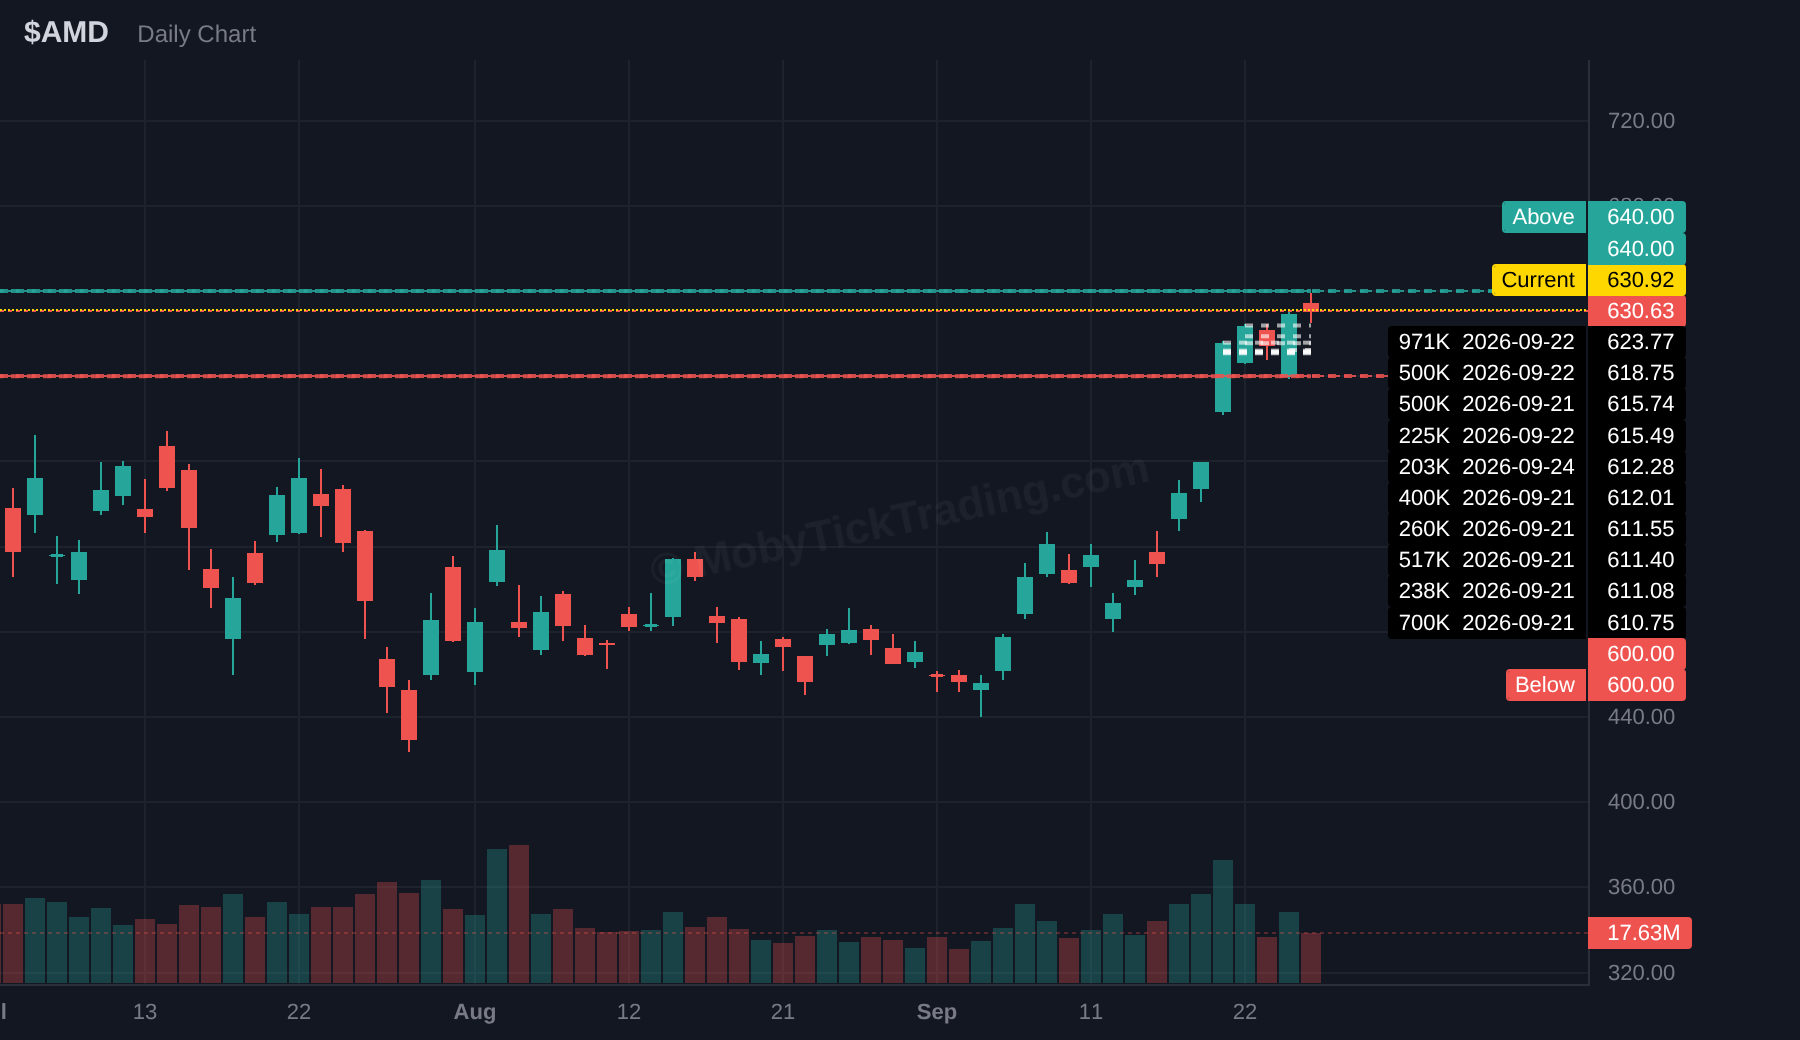
AMD
Above $640 → $650 → $660 → $670 → $680 → $690 → $700
Below $600 → $590 → $580 → $570 → $560 → $550 → $540
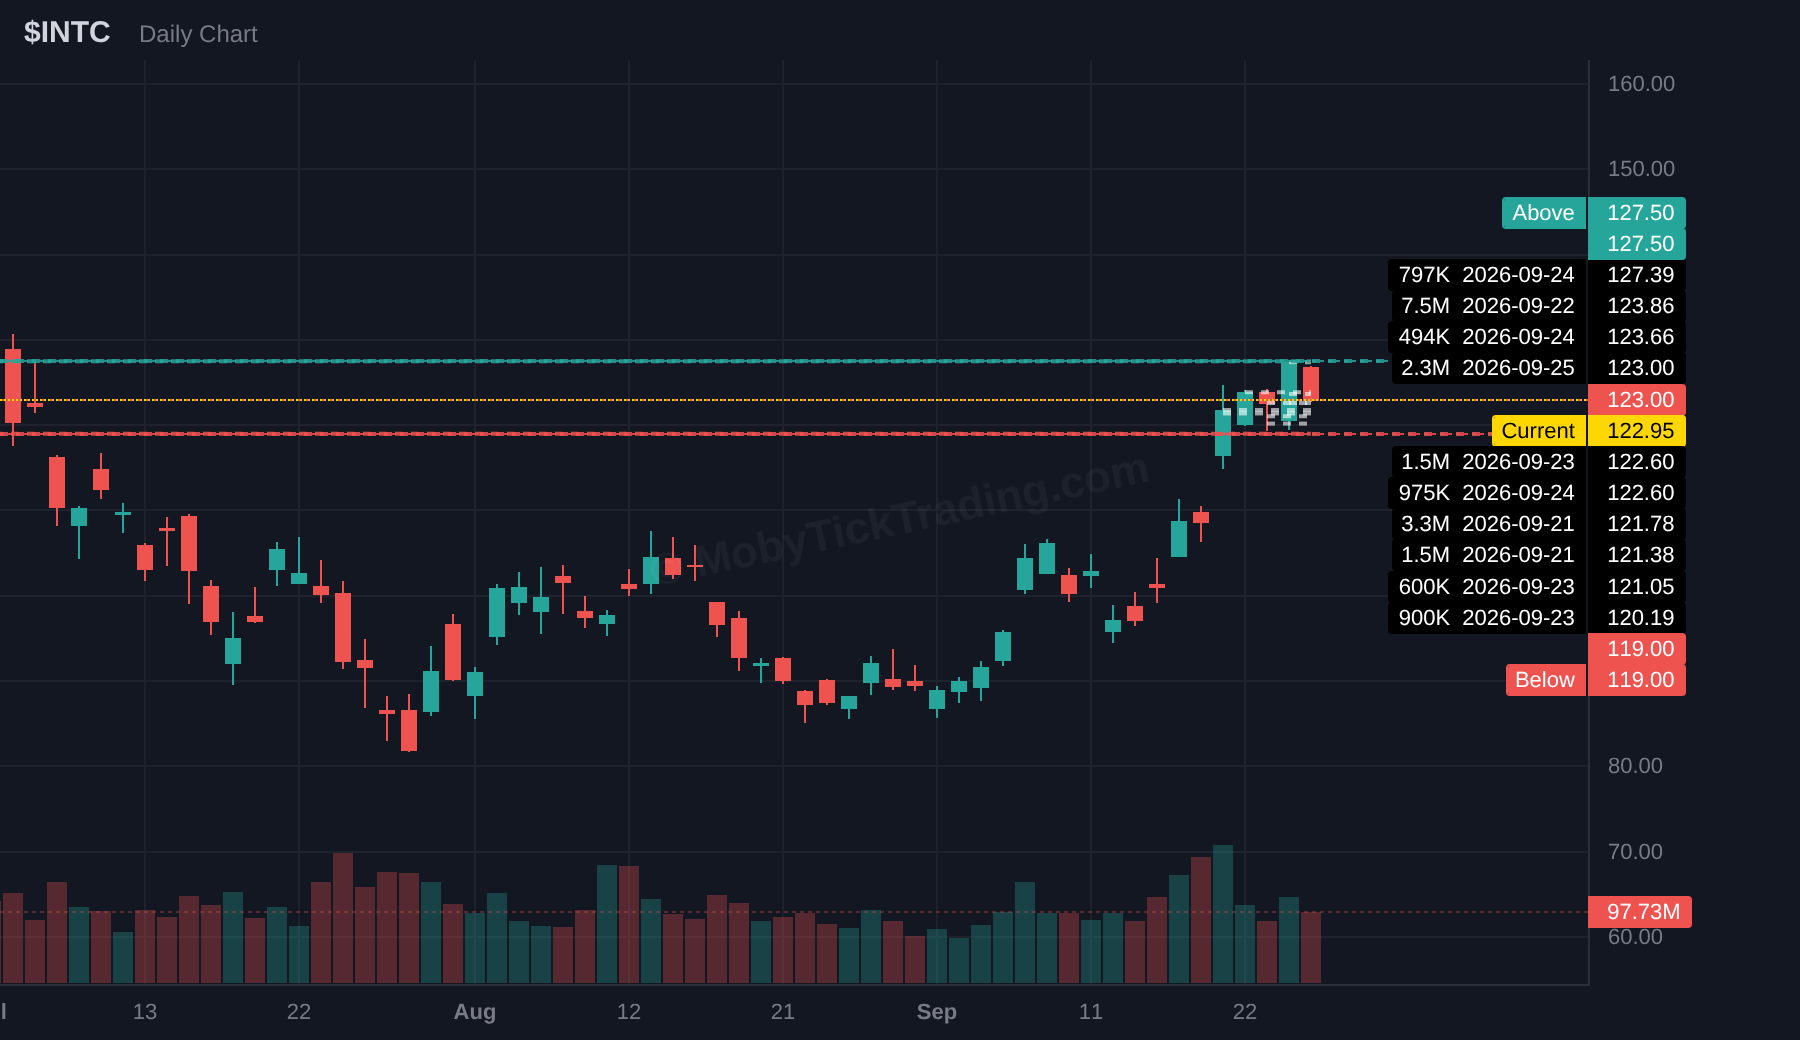
INTC
Above $127.5 → $130 → $132.5 → $135 → $137.5 → $140
Below $119 → $117.5 → $115 → $112.5 → $110 → $107.5 → $105
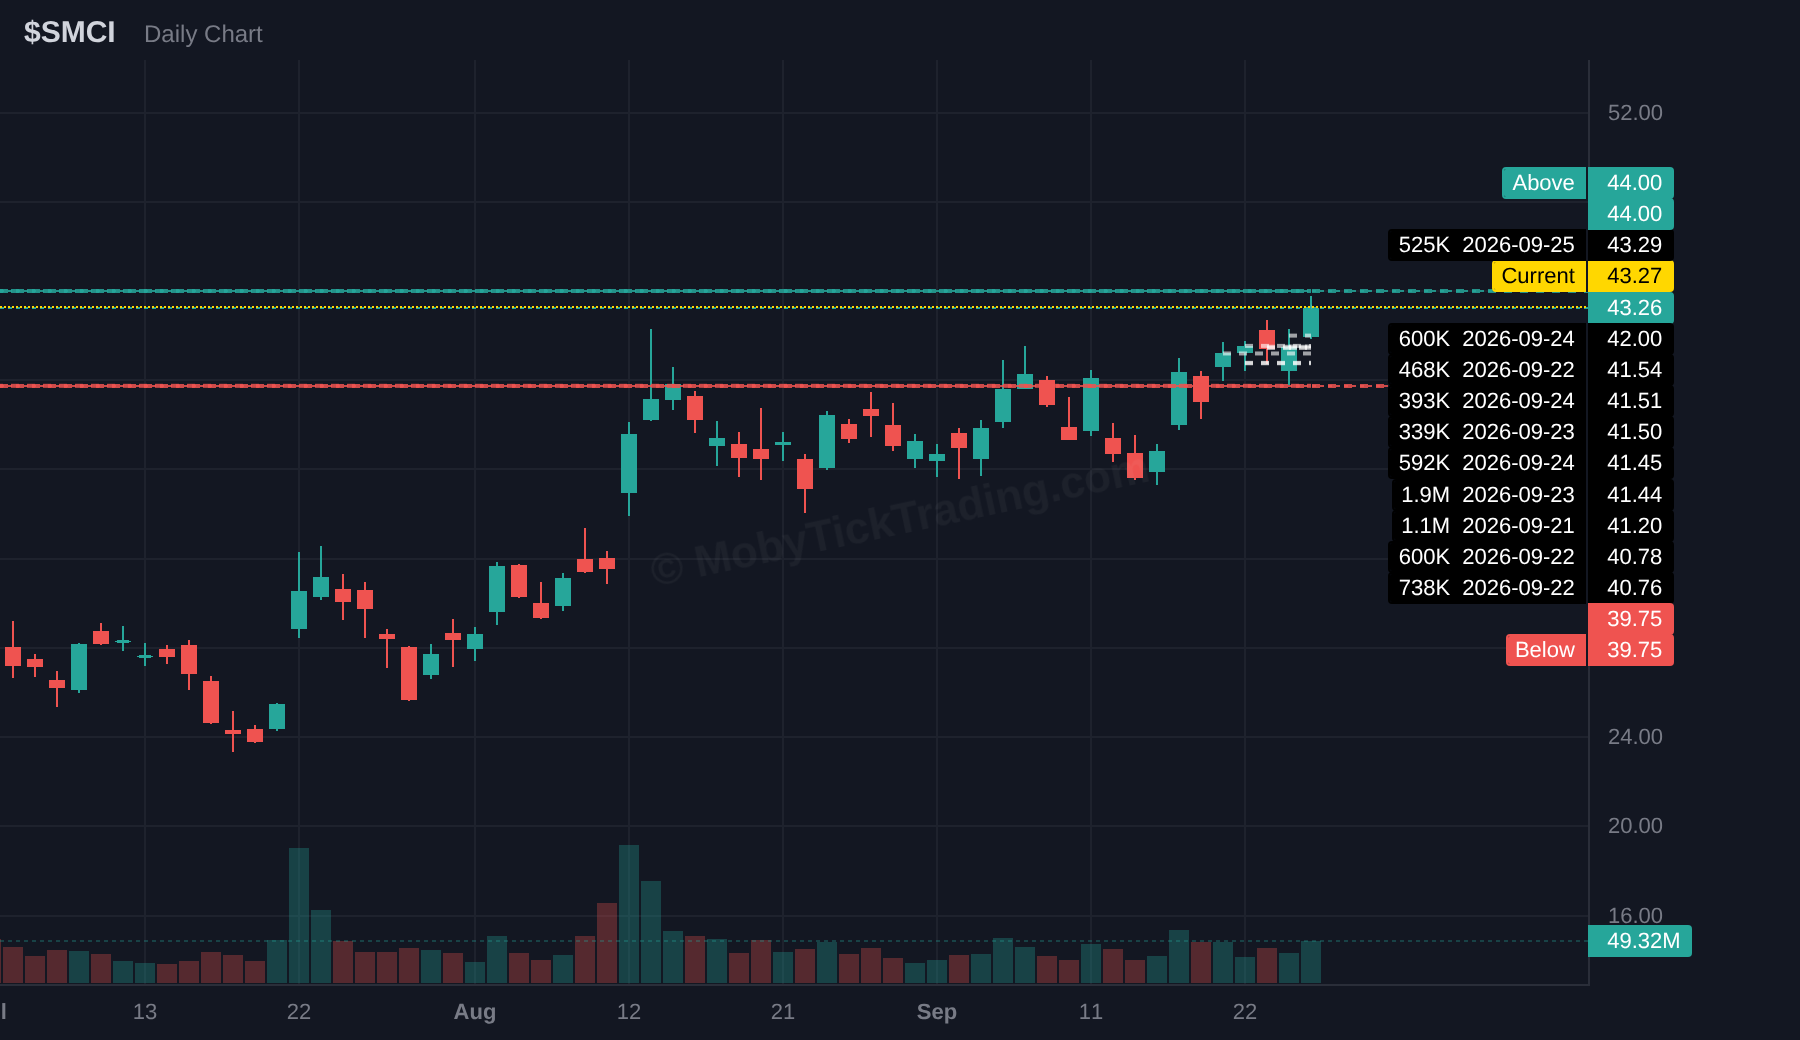
SMCI
Above $44 → $45 → $46.25 → $47.5 → $50
Below $39.75 → $39 → $38 → $37 → $35 → $32.50
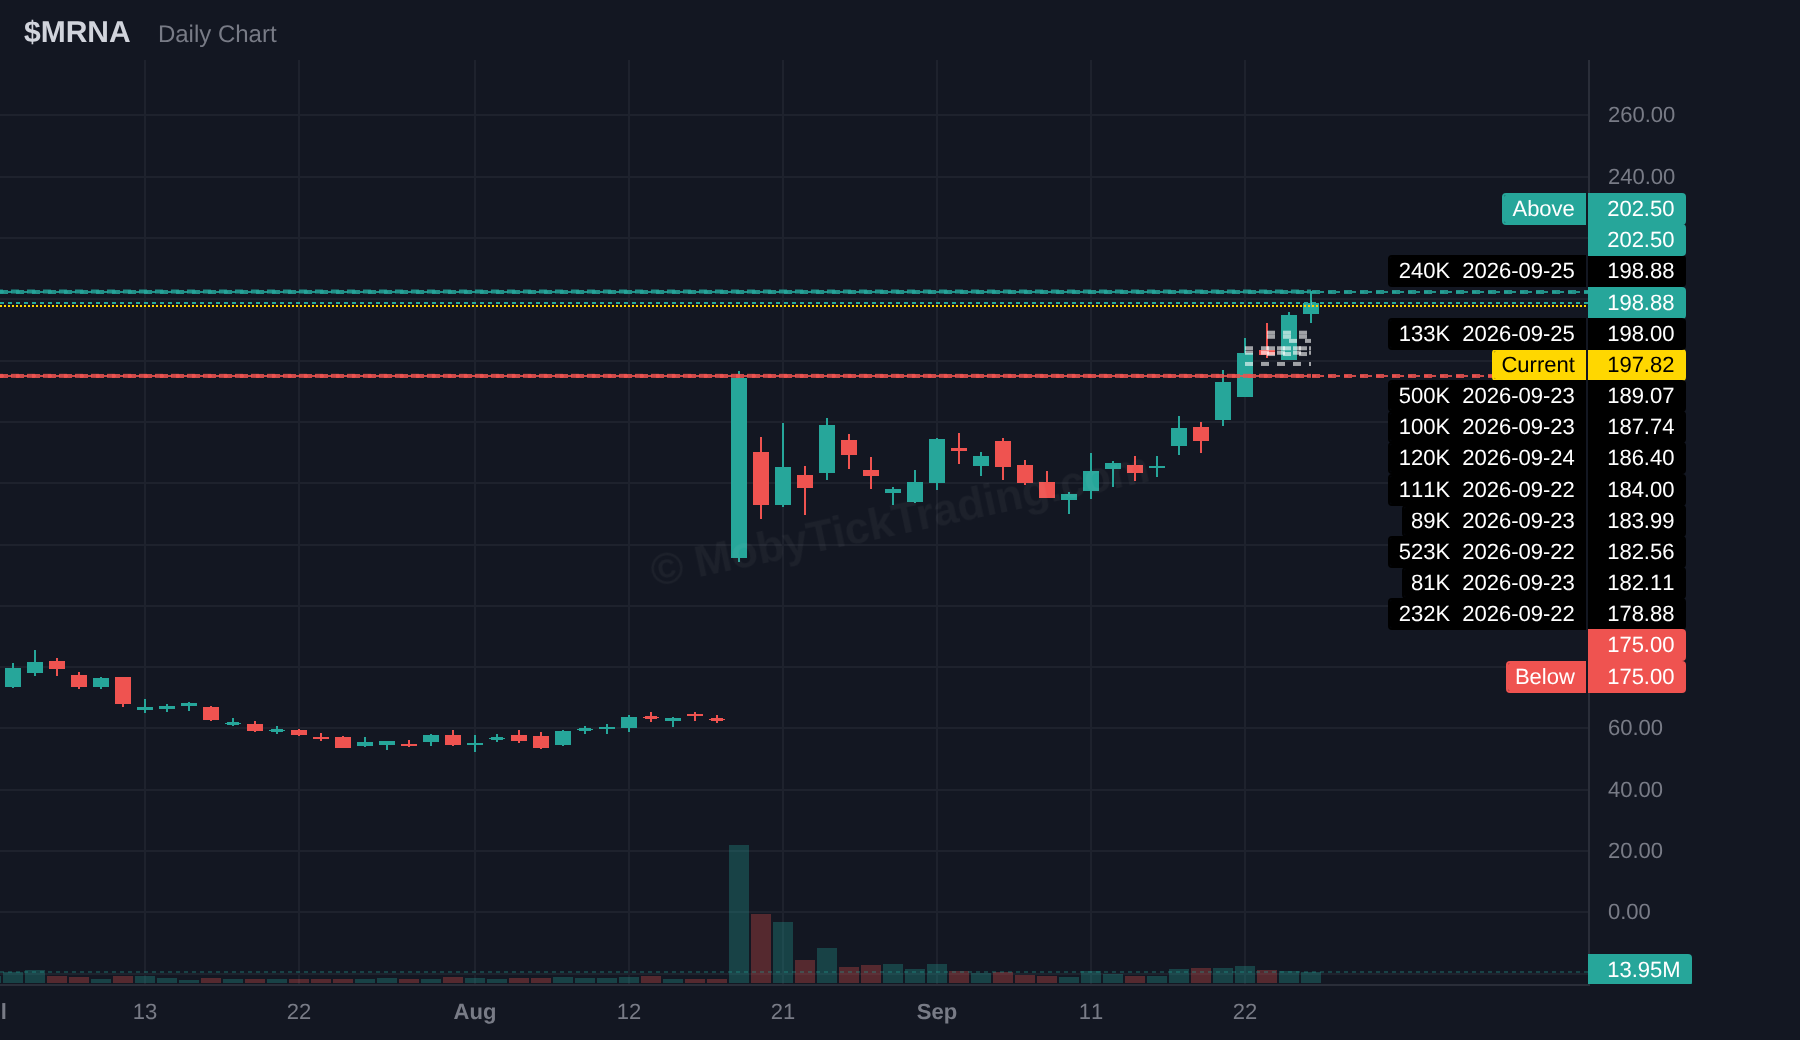
MRNA
Above $202.5 → $205 → $210 → $215 → $220 → $225 → $230
Below $175 → $170 → $165 → $160 → $155 → $150
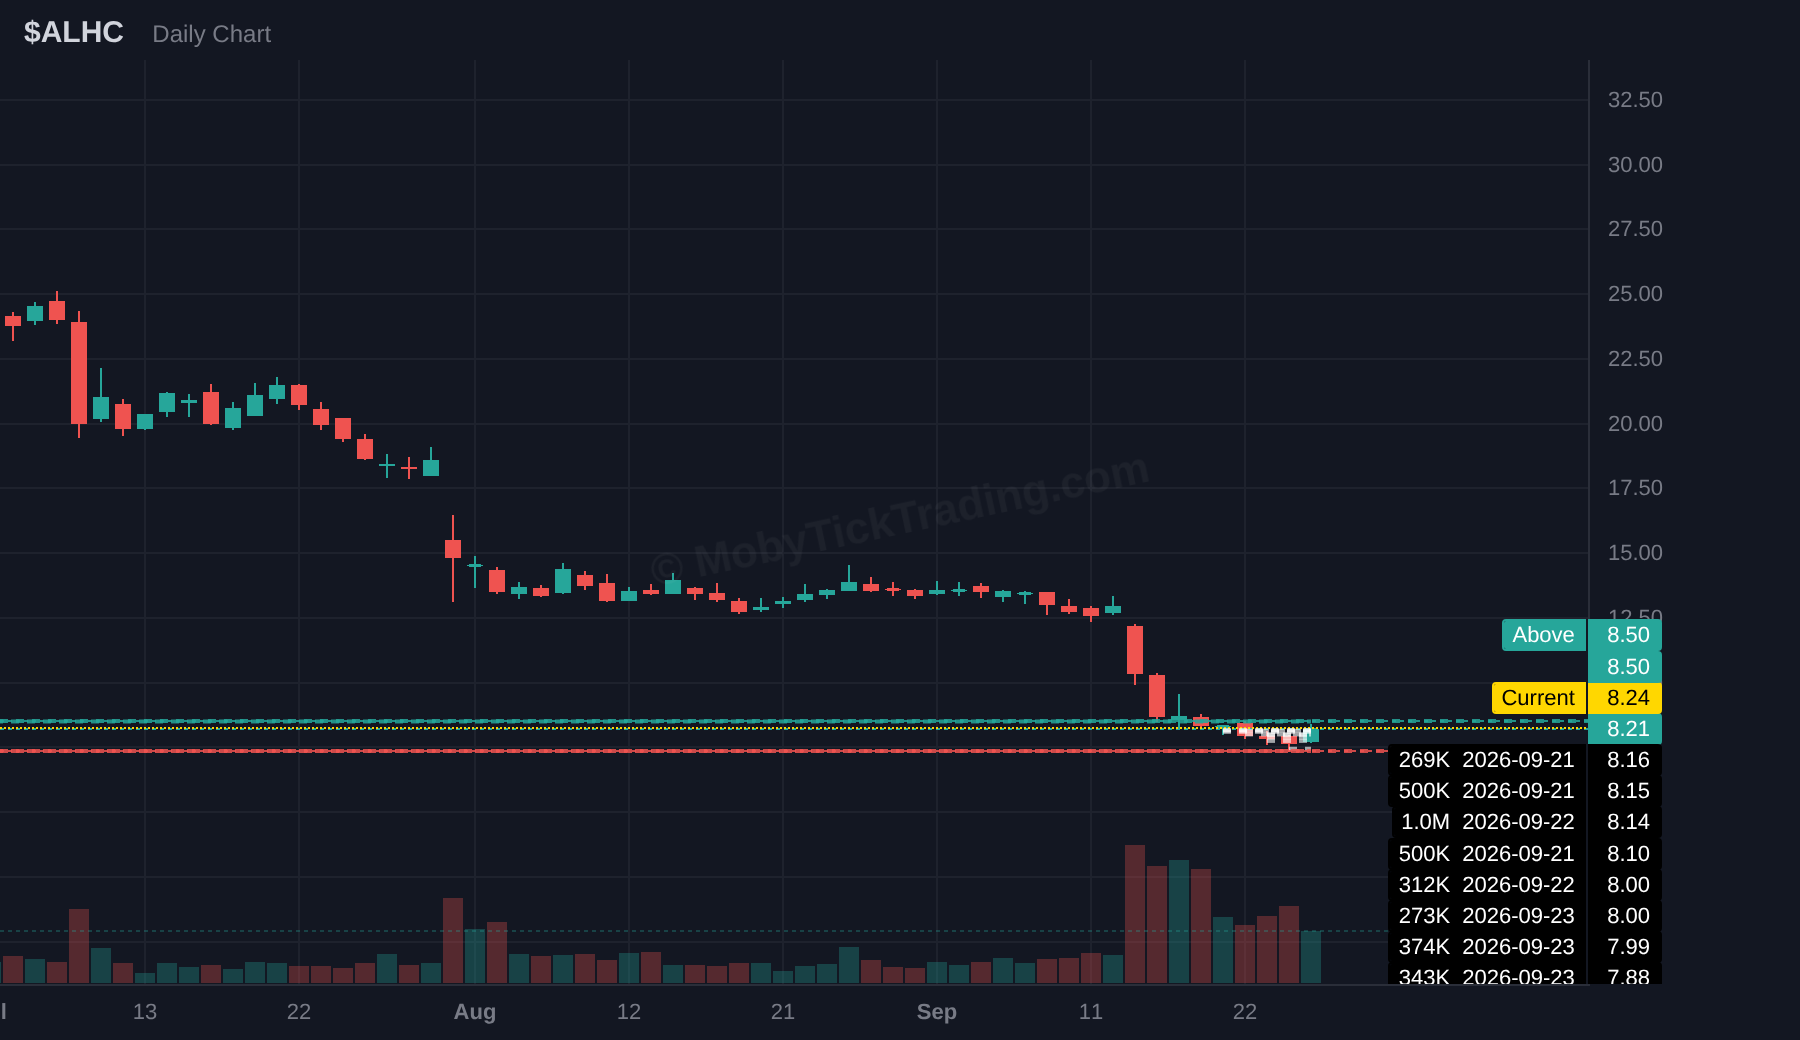
ALHC
Above $8.5 → $9 → $9.5 → $10 → $11 → $12 → $12.5
Below $7.36 → $7 → $6.5 → $6 → $5.5 → $5
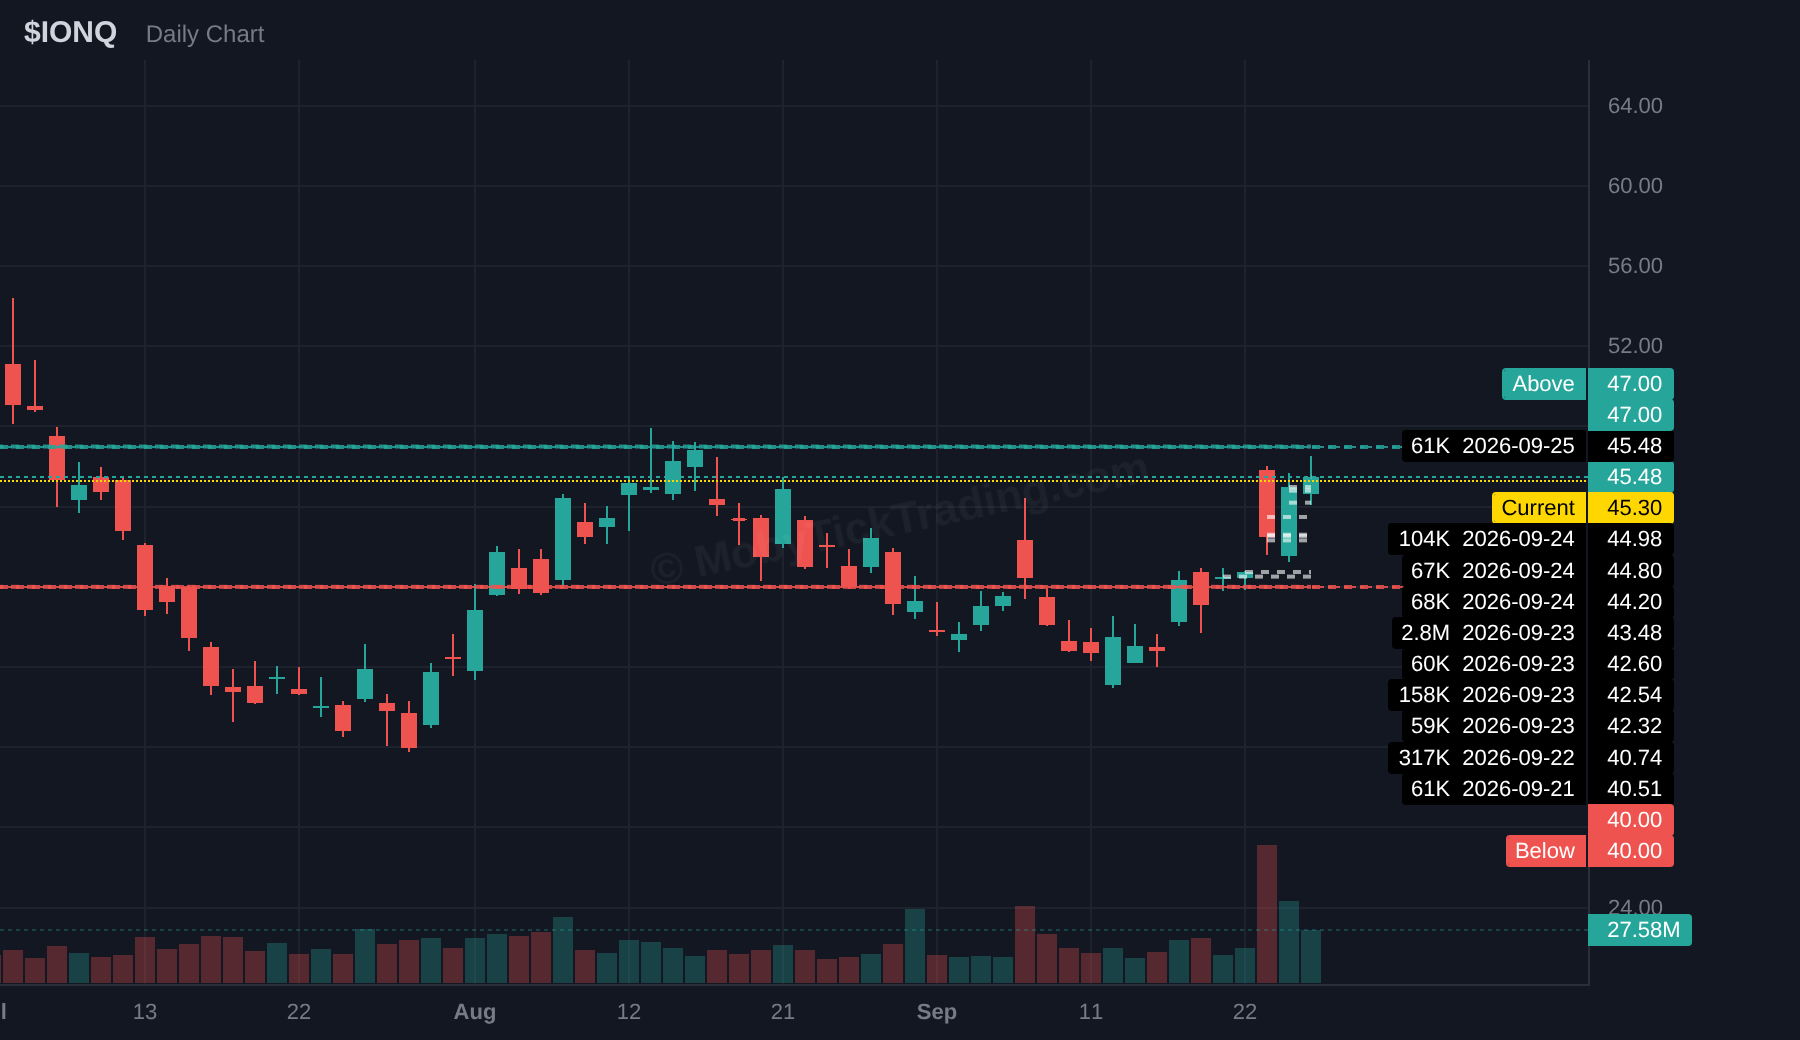
IONQ
Above $47 → $48 → $49 → $50 → $52.5 → $55
Below $40 → $39 → $38 → $37 → $36 → $35
PYPL
Above $55.5 → $56.25 → $57.5 → $60 → $61.25 → $62.5 → $64
Below $51.75 → $51 → $50 → $48.75 → $47.5 → $45 → $42.5
ETF Dark Pool Flow
For the week of Mon Sep 21 – Fri Sep 25, 2026, MobyTick dark pool data showed the broad-market index ETFs at the top of the tape again. SPY, QQQ and the two big S&P 500 trackers, IVV and VOO, together made up the bulk of ETF notional.
Broad-Market ETFs
| ETF | Notional | Shares | Levels |
|---|---|---|---|
| SPY | $41.72B | 54.21M | 57 |
| QQQ | $27.81B | 37.52M | 98 |
| IVV | $26.93B | 34.75M | 33 |
| VOO | $26.02B | 36.62M | 26 |
| IWM | $5.05B | 17.82M | 81 |
| DIA | $433.8M | 0.84M | 6 |
SPY led with $41.72B across 54.21M shares and 57 levels, 1.32× its 30-day ADV. QQQ printed $27.81B on 37.52M shares at 1.15× ADV and logged the most distinct levels of any ETF this week, at 98. IWM came in at $5.05B on 17.82M shares and 81 levels, 0.87× ADV. Excluding contingent prints, which are reported to the tape but do not add to reported volume, the three carried 15.02% (SPY), 4.45% (QQQ) and 3.17% (IWM) of their weekly consolidated volume through the dark pool. QQQ gained 3.19% on the week, SPY 1.27%, and IWM fell 0.75%.
ETF Basket Notional by Session
| Session | Notional | Shares |
|---|---|---|
| Mon Sep 21 | $26.91B | 52.36M |
| Tue Sep 22 | $45.10B | 94.99M |
| Wed Sep 23 | $30.75B | 57.87M |
| Thu Sep 24 | $20.53B | 44.91M |
| Fri Sep 25 | $14.33B | 33.83M |
Basket activity peaked on Tuesday and then fell every session through Friday. Friday was the lightest day of the week.
Sector Rotation
| ETF | Sector | Notional | Shares | Levels | Weekly % |
|---|---|---|---|---|---|
| XLF | Financials | $1.60B | 29.09M | 55 | −1.83% |
| XLE | Energy | $1.05B | 16.89M | 48 | −3.53% |
| SMH | Semiconductors | $849.1M | 1.42M | 19 | +5.86% |
| XLI | Industrials | $785.5M | 4.62M | 15 | +0.40% |
| XLK | Technology | $632.6M | 3.24M | 18 | +3.52% |
| XBI | Biotech | $386.8M | 2.49M | 10 | −1.08% |
| XLV | Health Care | $371.0M | 2.19M | 10 | +1.37% |
| XLU | Utilities | $350.8M | 8.81M | 38 | −3.87% |
| XLY | Consumer Discretionary | $348.9M | 3.11M | 16 | −0.42% |
| XLC | Communication Services | $276.3M | 2.44M | 9 | +1.94% |
| XLP | Consumer Staples | $193.3M | 2.35M | 15 | −0.89% |
| XLB | Materials | $174.3M | 3.49M | 13 | −0.38% |
| XLRE | Real Estate | $60.5M | 1.44M | 11 | −2.28% |
| XRT | Retail | $35.1M | 0.43M | 4 | +0.54% |
In the sector ETFs, dark pool notional and price often went in different directions. XLF was the largest sector reading at $1.60B across 55 levels, yet it fell 1.83% in a week when Treasury yields reached their highest since 2007. XLE came second at $1.05B and 48 levels while falling 3.53% as crude eased on truce headlines. XLU recorded 38 levels, the third-highest count among sector ETFs, as it posted the week’s worst sector return at −3.87%. The best-performing sector ETF, SMH (+5.86%), came in third by notional at $849.1M across only 19 levels. XLK (+3.52%) printed $632.6M. XLV (+1.37%) and XLI (+0.40%) had moderate notional and modest gains.
Callout ADV Ratios
Among the 13 callouts carrying levels into next week, WBD stood out. It printed 184.65M dark pool shares, 5.60× its 30-day ADV. ALHC came next at 1.50×, followed by SPY at 1.32× and QQQ at 1.15×. IWM was at 0.87×, and every other callout registered below 0.5× ADV.
Commodity & Crypto ETFs
GLD printed $1.52B on 3.84M shares across 25 levels while falling 1.93% on the week. IBIT recorded $770.0M on 15.97M shares across 60 levels. It finished up 3.37% Fri-to-Fri but declined in every session from Tuesday through Friday.
*Data: MobyTick dark pool prints and pricing, Sep 21–25, 2026.*
Educational Feature
The Participation Ratio: How Much of the Week Traded in the Dark?
A crossing tells you where price closed relative to the dark pool average. The participation ratio tells you how much trading that average stands for. It takes the dark pool shares behind those levels and divides them by total consolidated share volume over the same five sessions. The question it answers: *how much of this stock’s entire week traded in the dark?*
How to compute it:
- Add up the shares across every dark pool level of 50,000 shares or more for the week.
- Strip out levels carrying contingent-trade condition codes. They print to the tape but do not add to reported volume — they are the execution leg of a related position, not fresh trading.
- Pull total consolidated volume for the same five sessions.
- Divide the first number by the second.
- Check the result against the 30-day ADV to see whether the dark pool volume was unusually heavy for this name.
How to read it. When the ratio is high and price closes back above the average print price, a large share of the tape supports the crossing. When the ratio is low, the crossing rests on a small slice of the week’s volume. Treat that as a thinner reading.
This week’s numbers. WBD had the widest participation among the picks. Its 184.20M volume-contributing dark pool shares came to 35.10% of weekly consolidated volume (524.9M), or 5.60× its 30-day ADV, across 99 levels. The close of $30.86 sat +0.50% above the $30.71 average print price. A small crossing, resting on a large share of the tape. ALHC, a mid-cap, came in at 15.76% (1.50× ADV) across 39 levels with a +5.29% crossing.
The rest of the issue sits lower: SPY 15.02% (1.32× ADV), PYPL 4.74%, MSFT 4.46%, QQQ 4.45%, SMCI 3.70%, IWM 3.17%, MU 3.09%, INTC 2.84%, AMD 1.21%, MRNA 0.96%, IONQ 0.60%. MRNA’s +6.89% crossing and IONQ’s +5.06% look large, but each rests on about 1% of its week’s volume.
When the ratio lies. Count contingent prints and the number breaks. This week GLXY printed a single 18.37M-share level at $27.19 on September 22 — more than three times that session’s entire 6.17M-share consolidated volume — and it carried contingent-trade condition codes. Left in, it pushed GLXY to 79.06% for the week and 302.9% for the day. Stripped out, GLXY reads 5.52%. Any session reading above 100% means a non-volume print is in the total, so check the condition codes before trusting the figure.
> Key Takeaway: Read a crossing next to its participation ratio — dark pool shares divided by consolidated volume, with contingent prints stripped out. WBD’s 35.10% stands on far more of the tape than MRNA’s 0.96% or IONQ’s 0.60%. If any session reads above 100%, a non-volume print is in the total.
Ready to Trade with Whale-Level Insight?
Get institutional-grade dark pool intelligence delivered to your inbox every week.
Disclaimer: This newsletter is for informational and educational purposes only. It does not constitute financial advice, investment recommendations, or solicitation to buy or sell securities. Trading stocks, ETFs, and options involves substantial risk of loss. Past performance is not indicative of future results.