Physical Address
304 North Cardinal St.
Dorchester Center, MA 02124
Physical Address
304 North Cardinal St.
Dorchester Center, MA 02124

13 dark pool setups, sector ETF flow, and a print-concentration deep dive for the shortened Labor Day week. Data sourced from MobyTick.
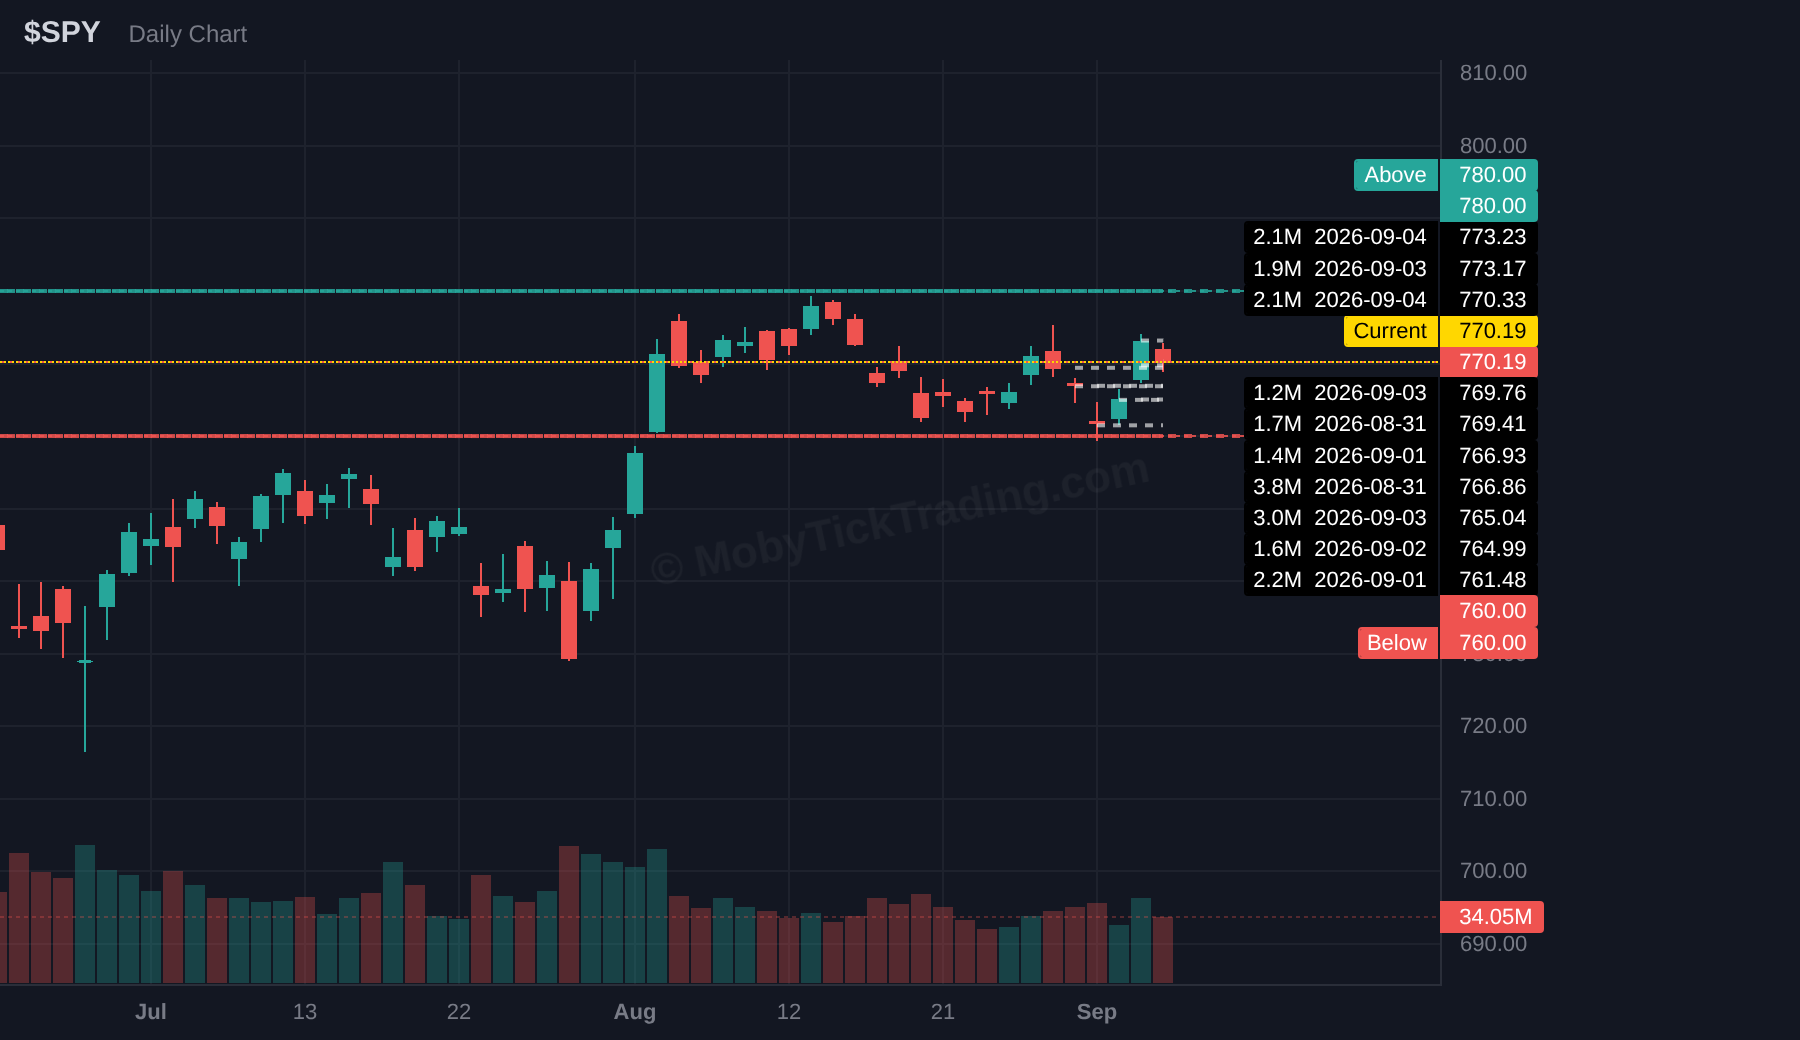
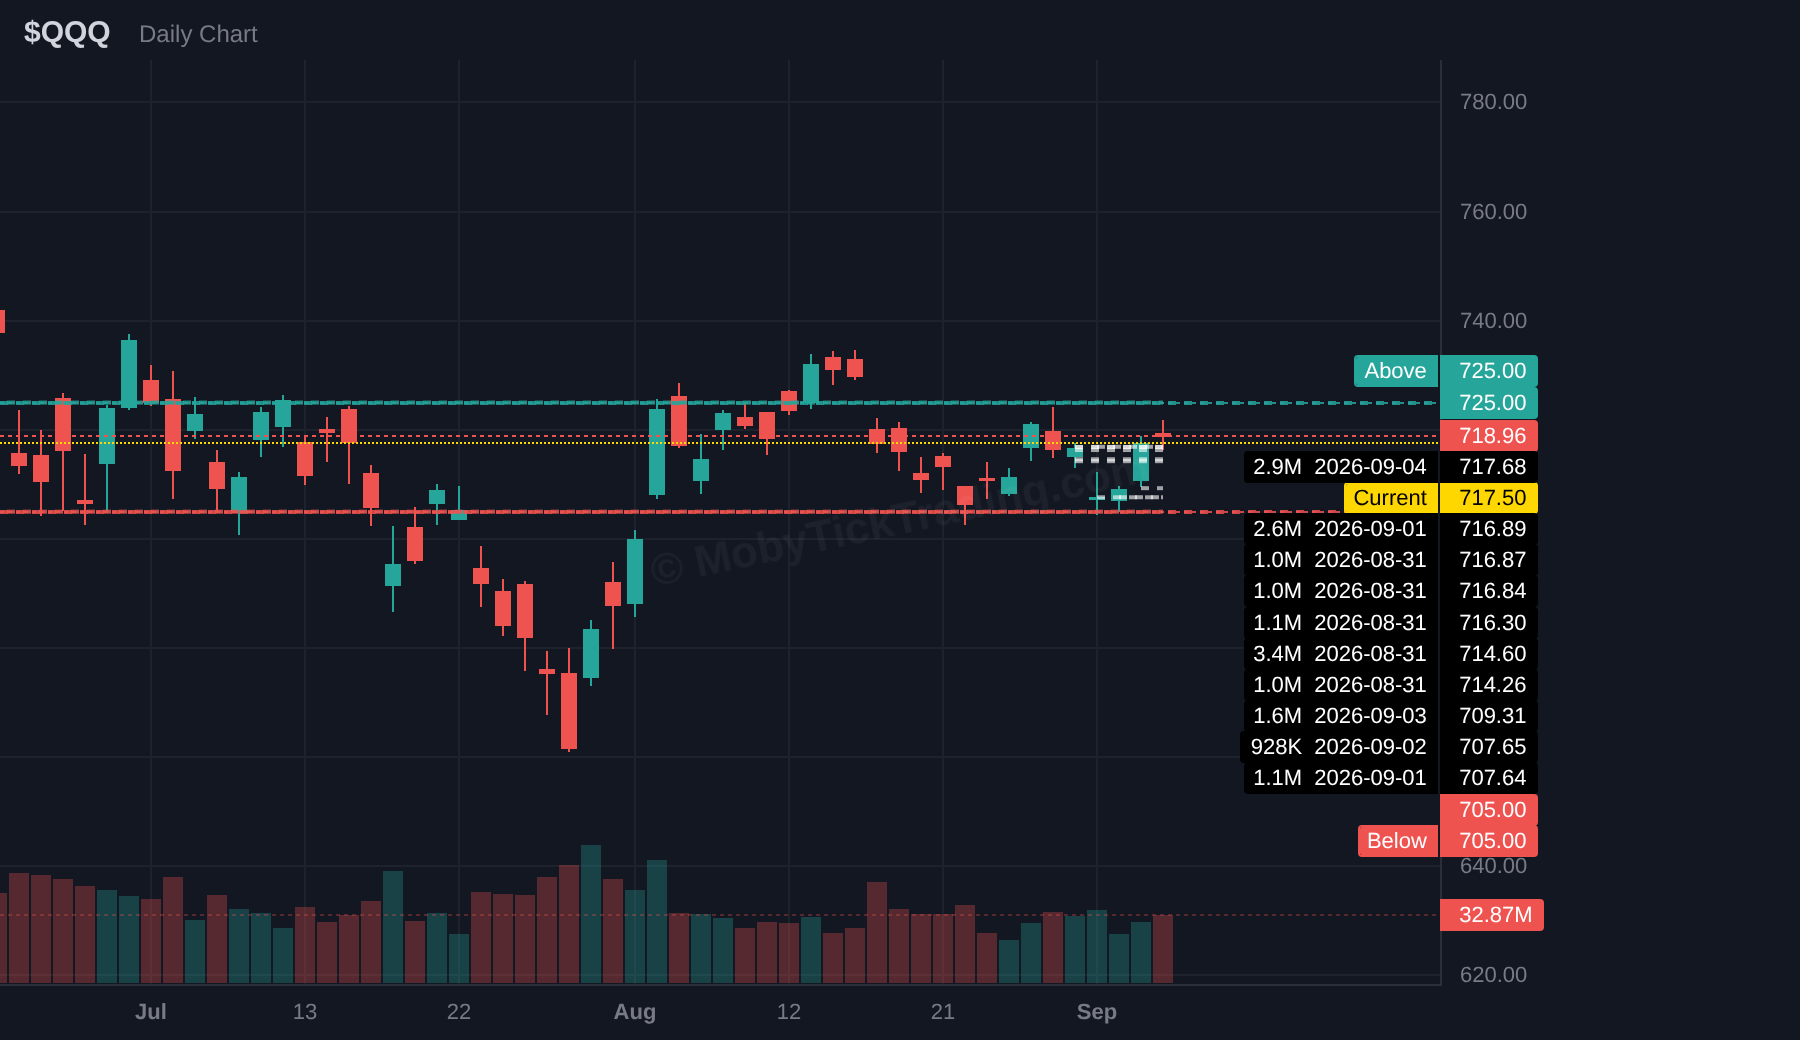
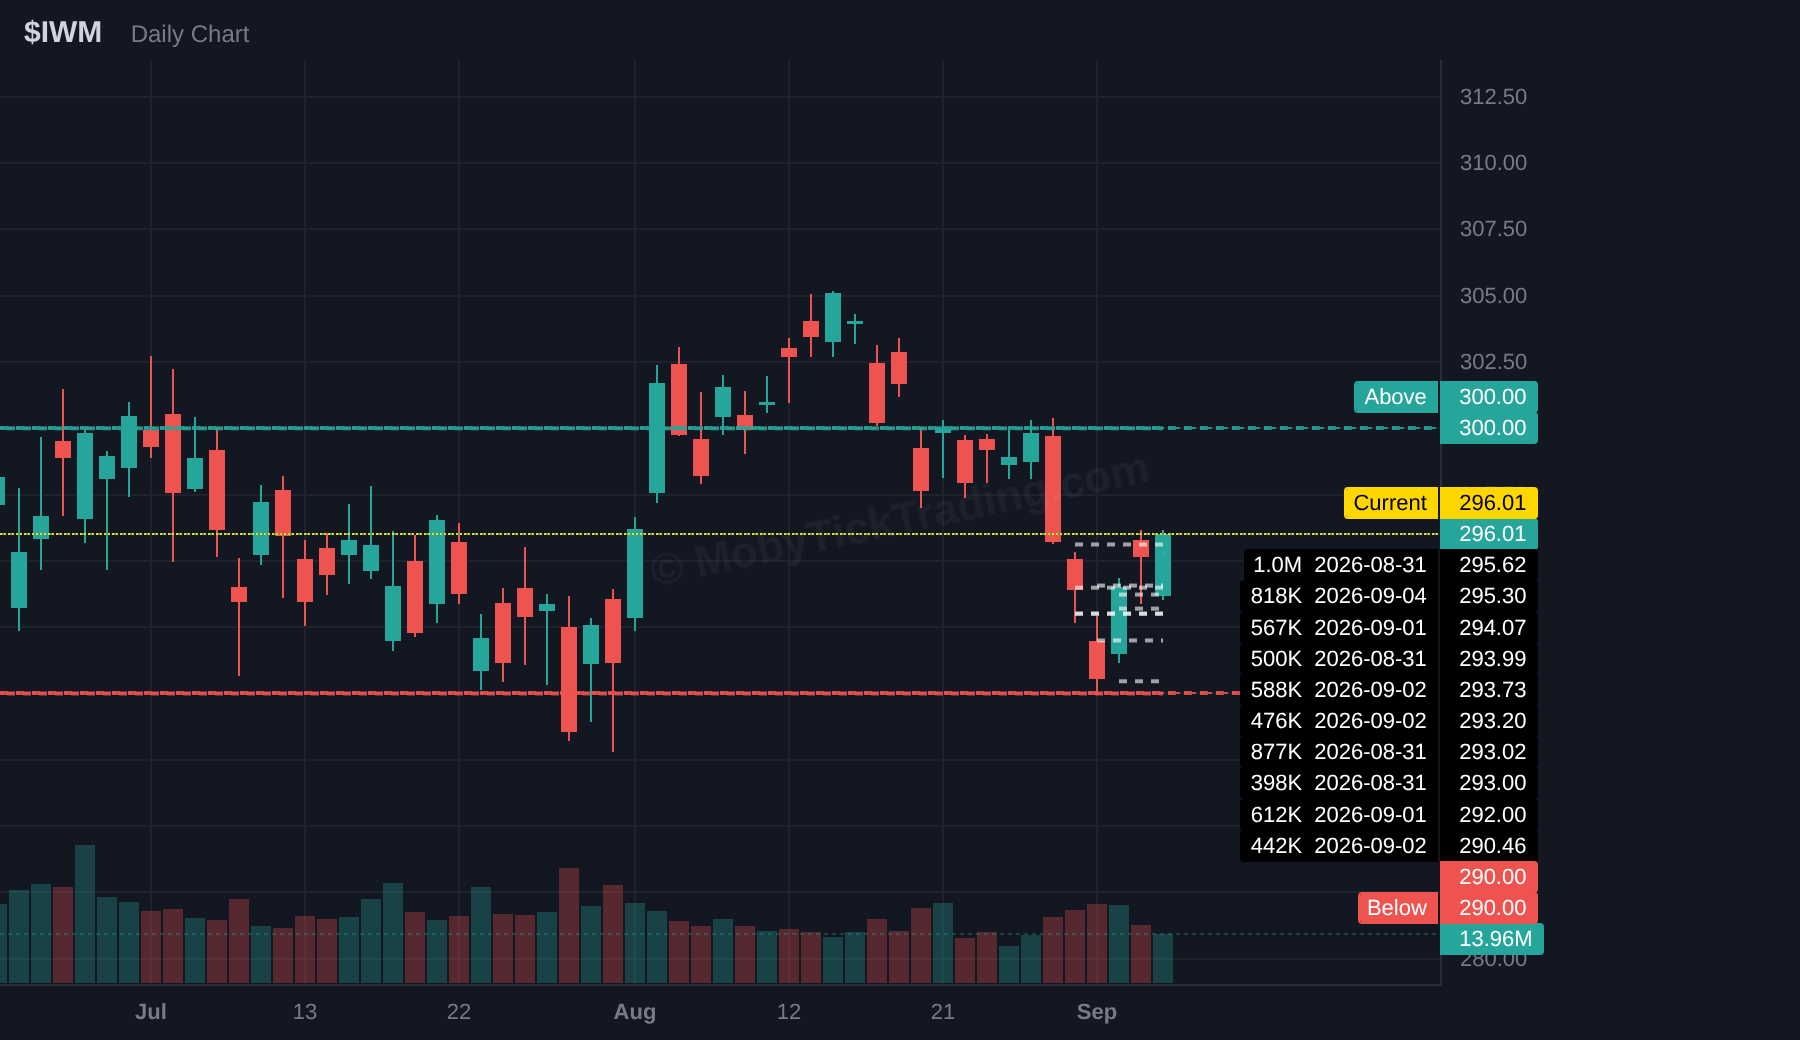
Indexes finished the week nearly flat. The S&P 500 added 0.1%, the Nasdaq added 0.4%, and the Dow gave back 0.3%. SPY opened the week at 767.33 and closed at 770.19 inside a 759.48 to 774.03 range. QQQ closed 718.96 with a 704.66 to 721.86 range. IWM closed 296.01, one cent under its 296.18 weekly high, after tagging 289.97 on the low end. DIA closed 534.08 in a 526.84 to 537.62 range.
Two macro items framed the week. Jackson Hole ran August 27 to 29 under the theme “Financial Innovation: Implications for Payments and Policy,” with Fed Chair Kevin Warsh delivering his first keynote on Friday, August 28. Then the August employment report landed Friday, September 4, and news coverage tied it to higher expectations for a Fed rate hike.
Semis carried Friday’s tape. Sandisk moved +11.9%, Marvell +7%, Micron +6.1%, AMD +4.7%, Intel +4.5%, and NVDA +0.8%, with coverage pointing to AI model optimism. Sector performance on September 4 split cleanly: XLK, XLI, and XLU on the winners list, XLV, XLY, XLC, and XLE on the laggards list.
Our 13 callouts from the prior issue met their marked levels as follows: 6 tagged the Above level, 4 tagged the Below level, SPY tagged both, and 2 stayed inside the band all week. Nine of the 13 reached at least one marked target.
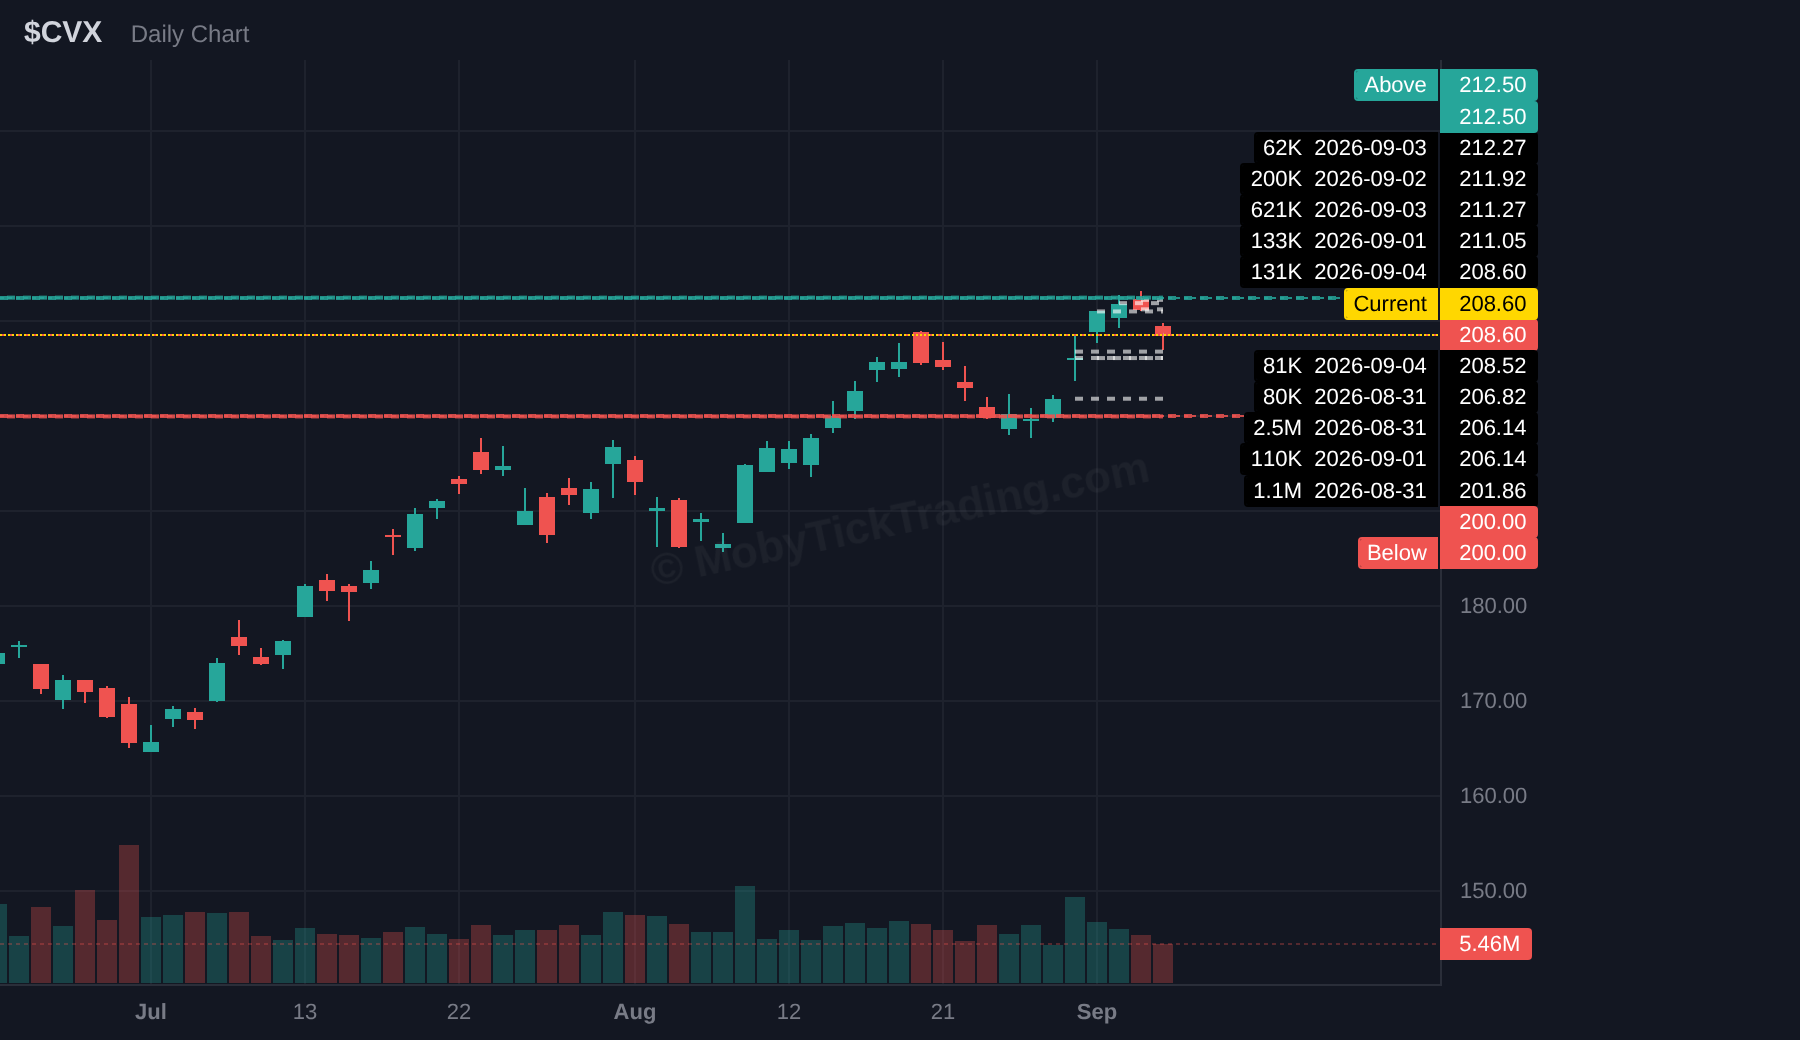
Energy produced the widest excursions above. SLB ran +4.24% past its Above level, HAL +4.27%, and CVX +4.25%. GLD extended -2.83% past its Below level. MRVL stretched -6.69% below its marked level intraweek before closing the week at 223.55.
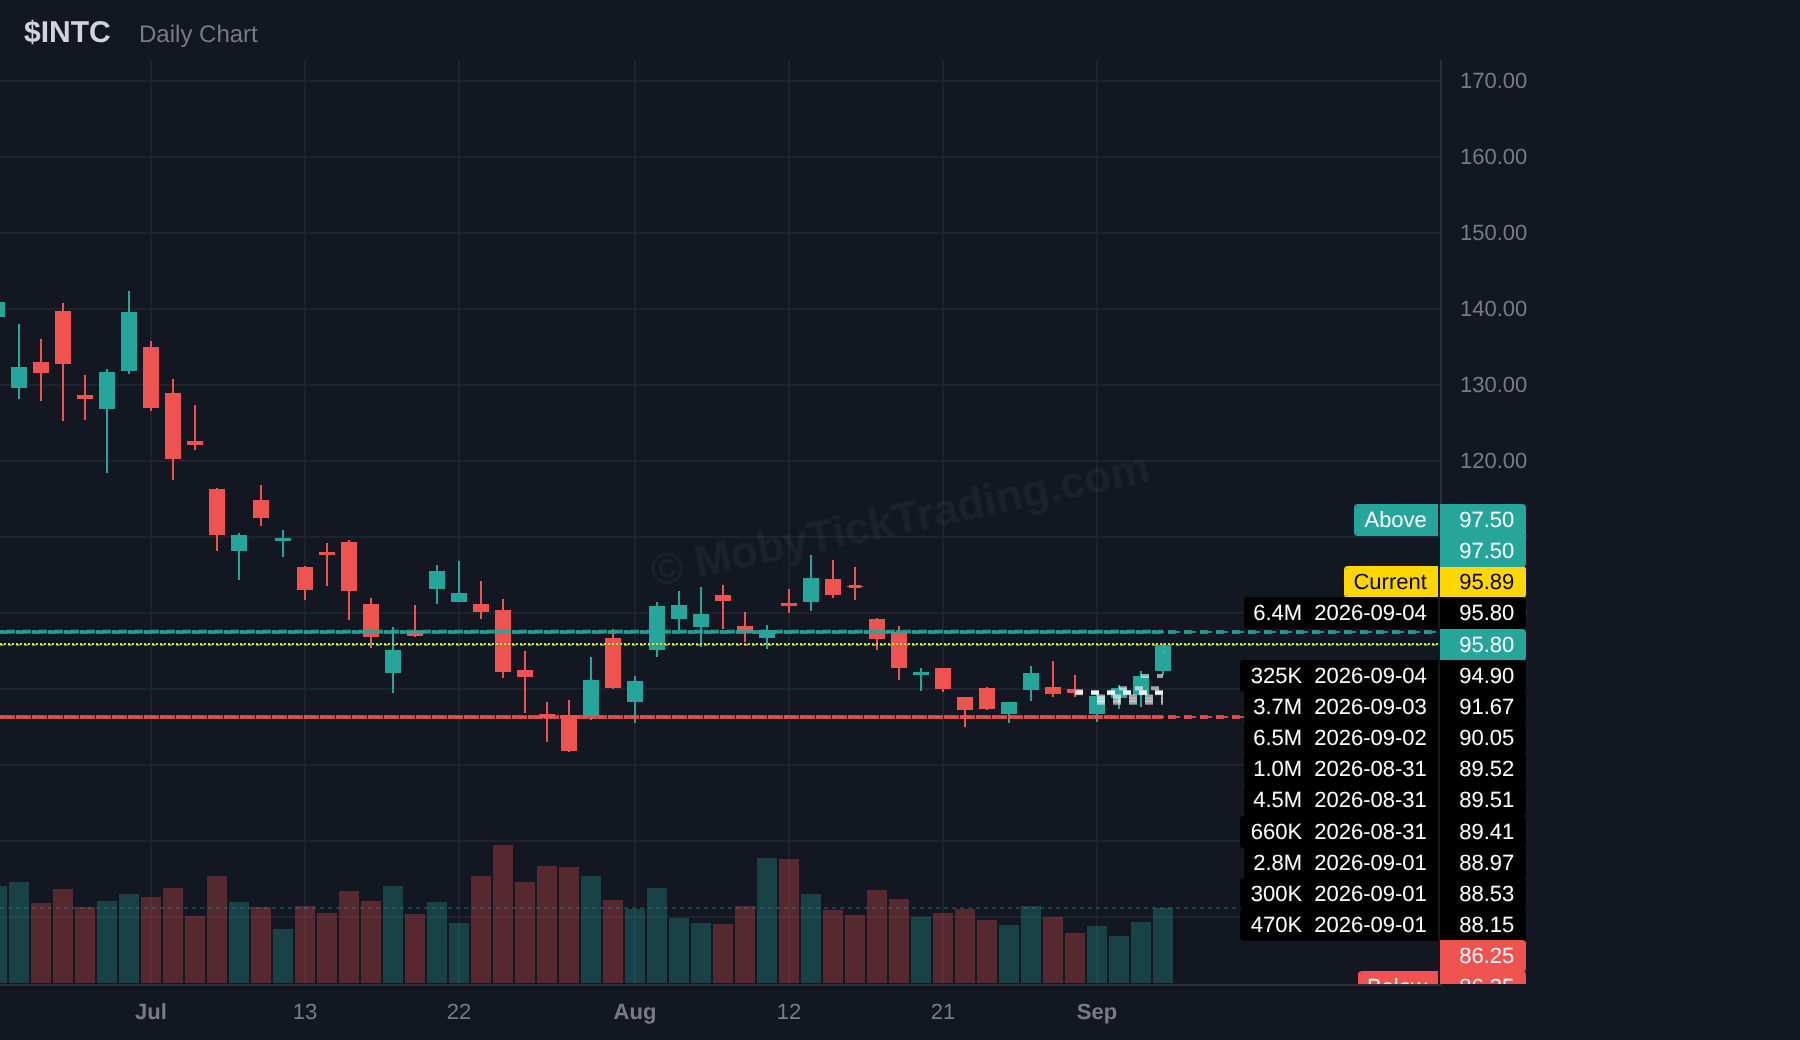
Thirteen tickers carry levels into the September 8 to 11 week: SPY, QQQ, IWM, SPCX, WDC, CRWV, MSFT, SUNB, PLTR, META, CVX, MCHP, and INTC. Five repeat from last week’s sheet: SPY, QQQ, IWM, MSFT, and CVX. Eight are new: SPCX, WDC, CRWV, SUNB, PLTR, META, MCHP, and INTC. Levels, targets, and dark pool notional for each name follow below.
Data sourced from MobyTick.
| Ticker | Above | Below | High | Low | Close | Triggered | Targets Hit | Move From Trigger |
|---|---|---|---|---|---|---|---|---|
| SPY | 772.5 | 762 | 774.03 | 759.48 | 770.19 | Both | ↑ 0 of 4 · ↓ 1 of 5 → T1 ($760) | $762 → $759.48 (-0.33%) |
| QQQ | 725 | 710 | 721.86 | 704.66 | 718.96 | Below | 1 of 5 → T1 ($705) | $710 → $704.66 (-0.75%) |
| IWM | 300 | 295 | 296.18 | 289.97 | 296.01 | Below | 2 of 6 → T2 ($290) | $295 → $289.97 (-1.71%) |
| NVDA | 231.25 | 215 | 234.76 | 215.1 | 230.36 | Above | 0 of 5 | $231.25 → $234.76 (+1.52%) |
| MSFT | 517.5 | 480 | 515.65 | 493.81 | 499.7 | None | — | — |
| GLD | 430 | 408 | 413.54 | 396.45 | 406.77 | Below | 3 of 6 → T3 ($400) | $408 → $396.45 (-2.83%) |
| SLB | 58 | 51.87 | 60.46 | 56.24 | 57.51 | Above | 2 of 6 → T2 ($60) | $58 → $60.46 (+4.24%) |
| HAL | 36.5 | 34.5 | 38.057 | 36.432 | 37.07 | Above | 1 of 3 → T1 ($37.5) | $36.5 → $38.057 (+4.27%) |
| MRVL | 254.5 | 215 | 223.67 | 200.62 | 223.55 | Below | 2 of 5 → T2 ($206.25) | $215 → $200.62 (-6.69%) |
| CVX | 204.5 | 197.5 | 213.2 | 203.835 | 208.6 | Above | 4 of 5 → T4 ($212.5) | $204.5 → $213.2 (+4.25%) |
| BAC | 64.12 | 61 | 63.55 | 61.724 | 62.68 | None | — | — |
| NFLX | 82.5 | 76.5 | 83.6 | 78.23 | 78.25 | Above | 0 of 4 | $82.5 → $83.6 (+1.33%) |
| WDAY | 208.25 | 189 | 211.83 | 195.4 | 195.79 | Above | 1 of 5 → T1 ($210) | $208.25 → $211.83 (+1.72%) |
| Ticker | Above Trigger | Targets |
|---|---|---|
| SPY | $780 | $782.5 → $785 → $790 → $795 → $800 |
| QQQ | $725 | $730 → $735 → $740 → $745 → $750 |
| IWM | $300 | $302.5 → $305 → $307.5 → $310 |
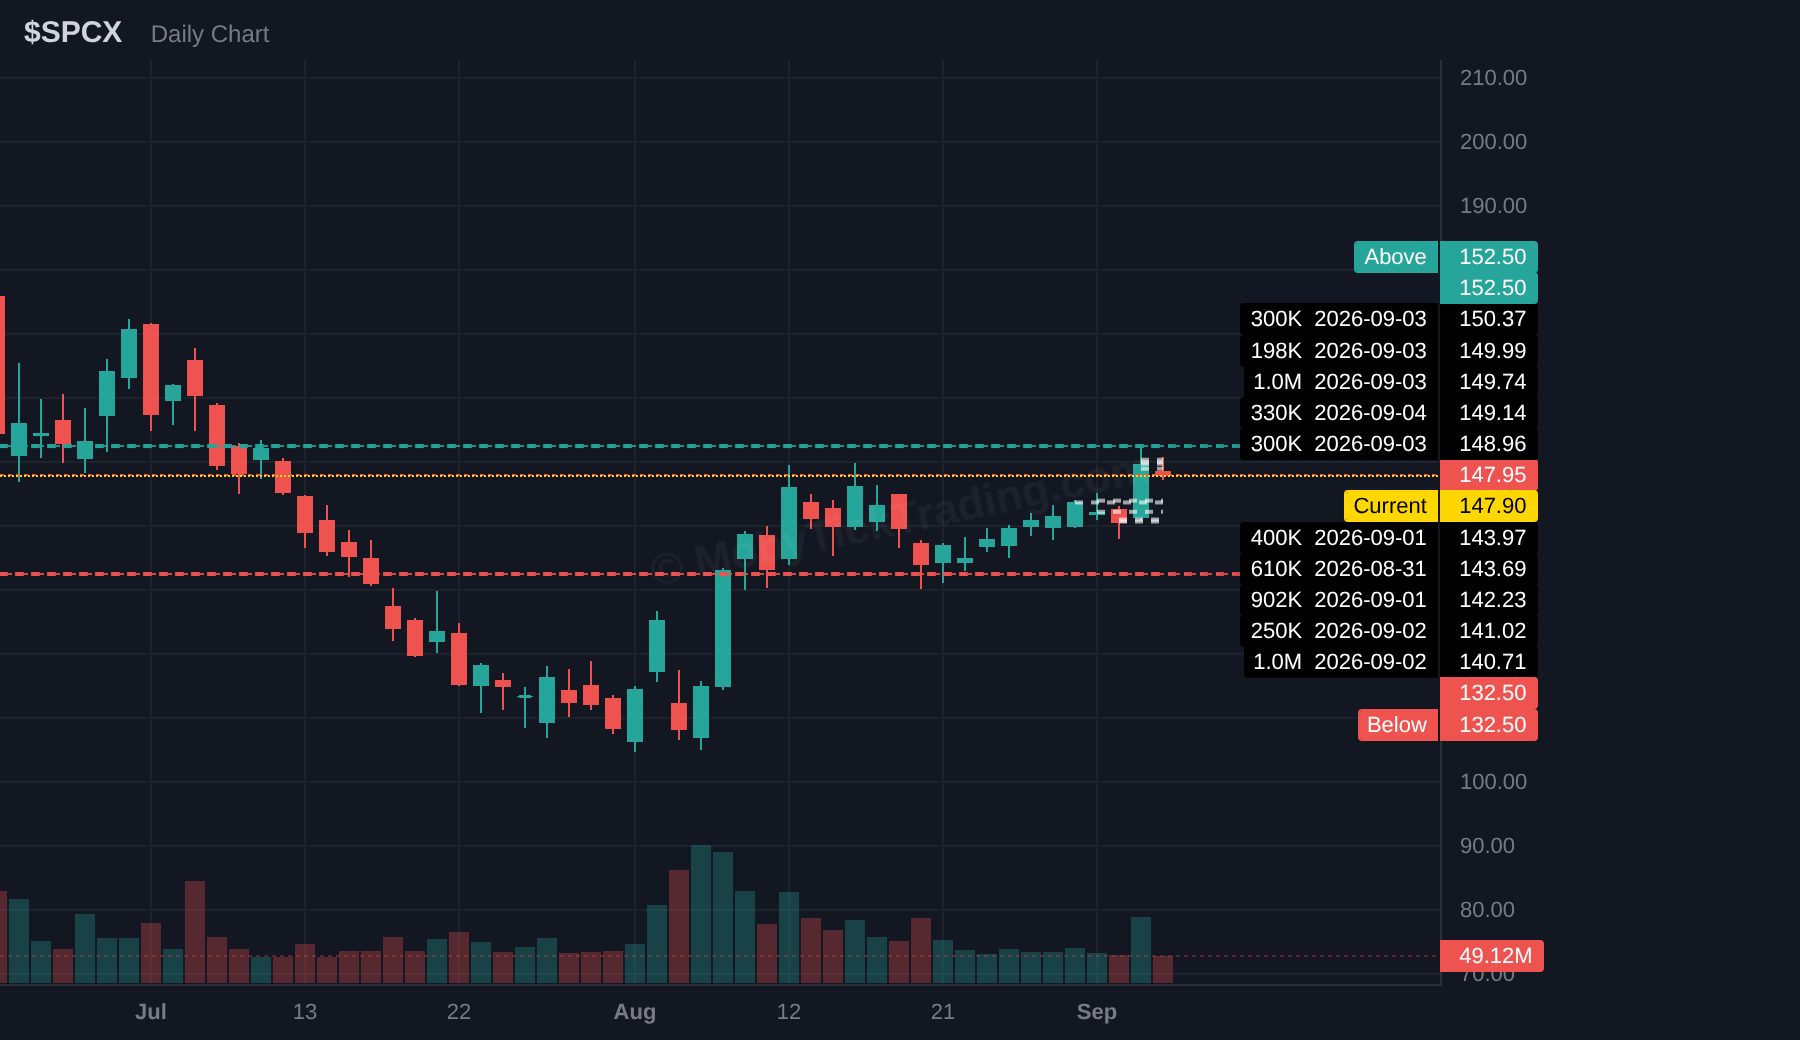
| SPCX | $152.5 | $155 → $157.5 → $160 → $165 → $170 → $175 → $180 |
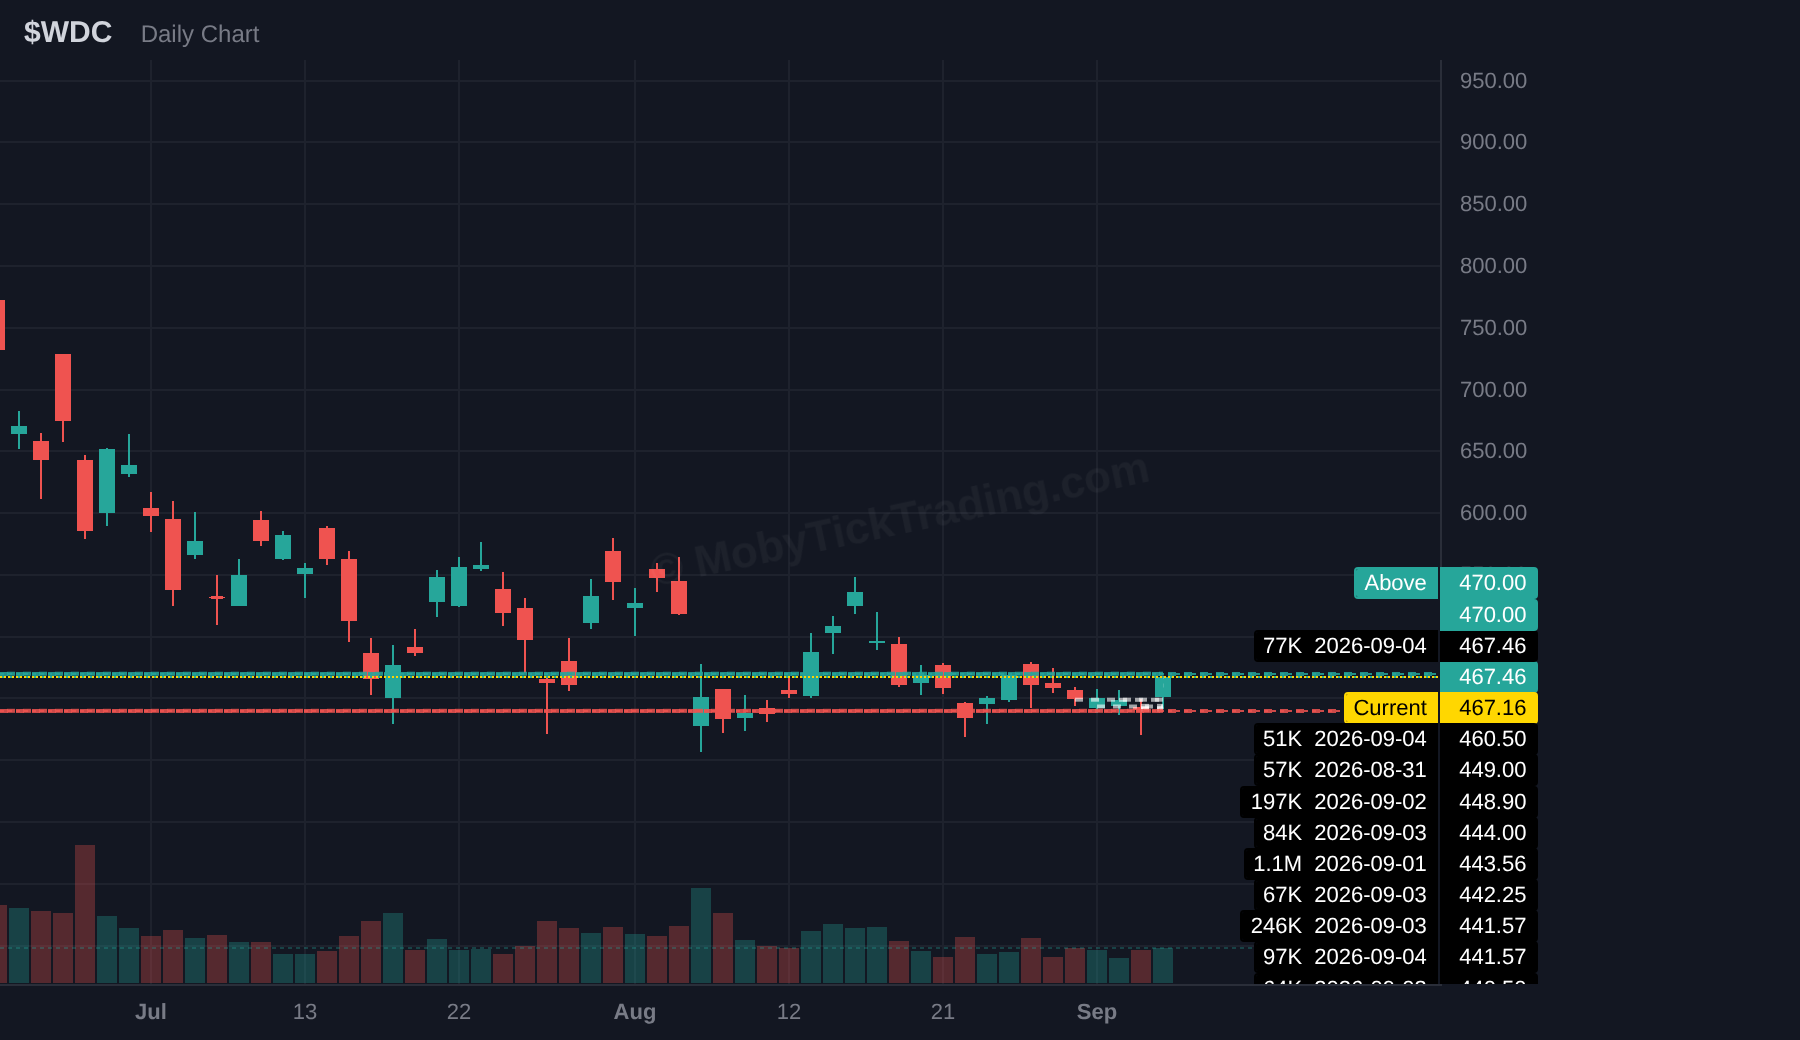
| WDC | $470 | $485 → $500 → $520 → $550 → $580 → $600 |
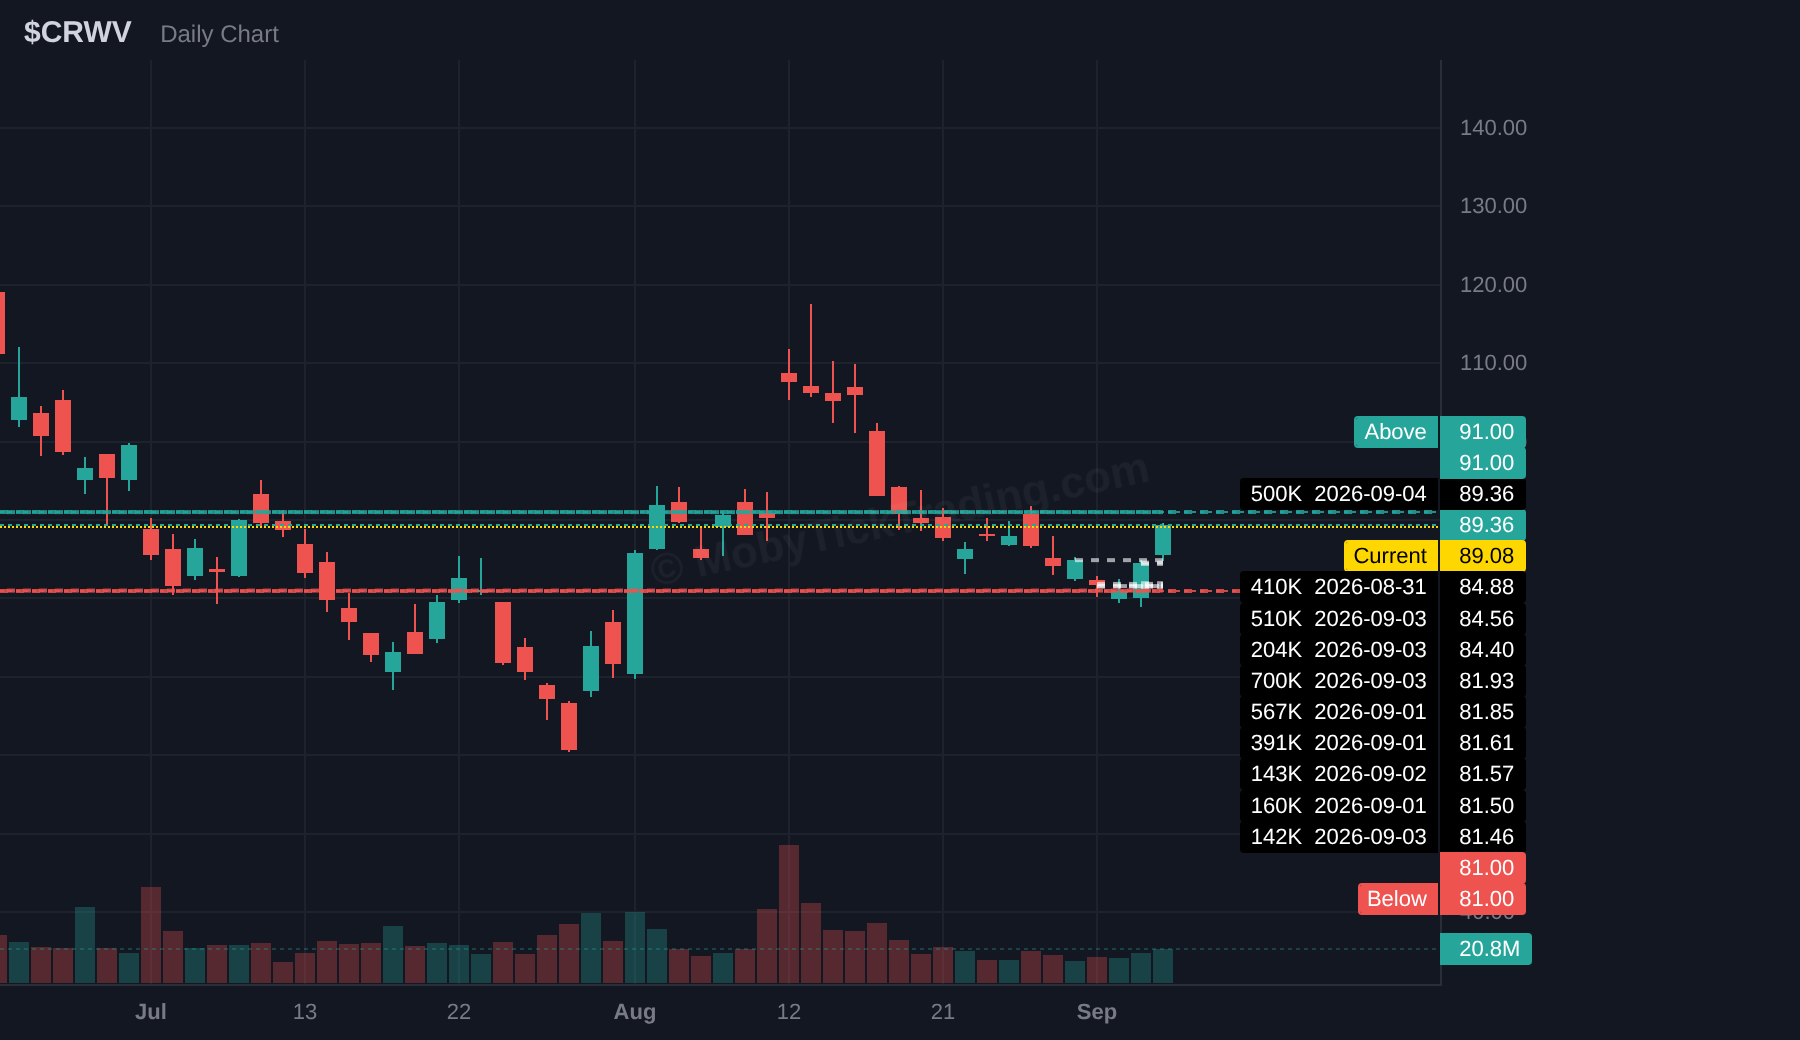
| CRWV | $91 | $92.5 → $95 → $97.5 → $100 → $107.5 |
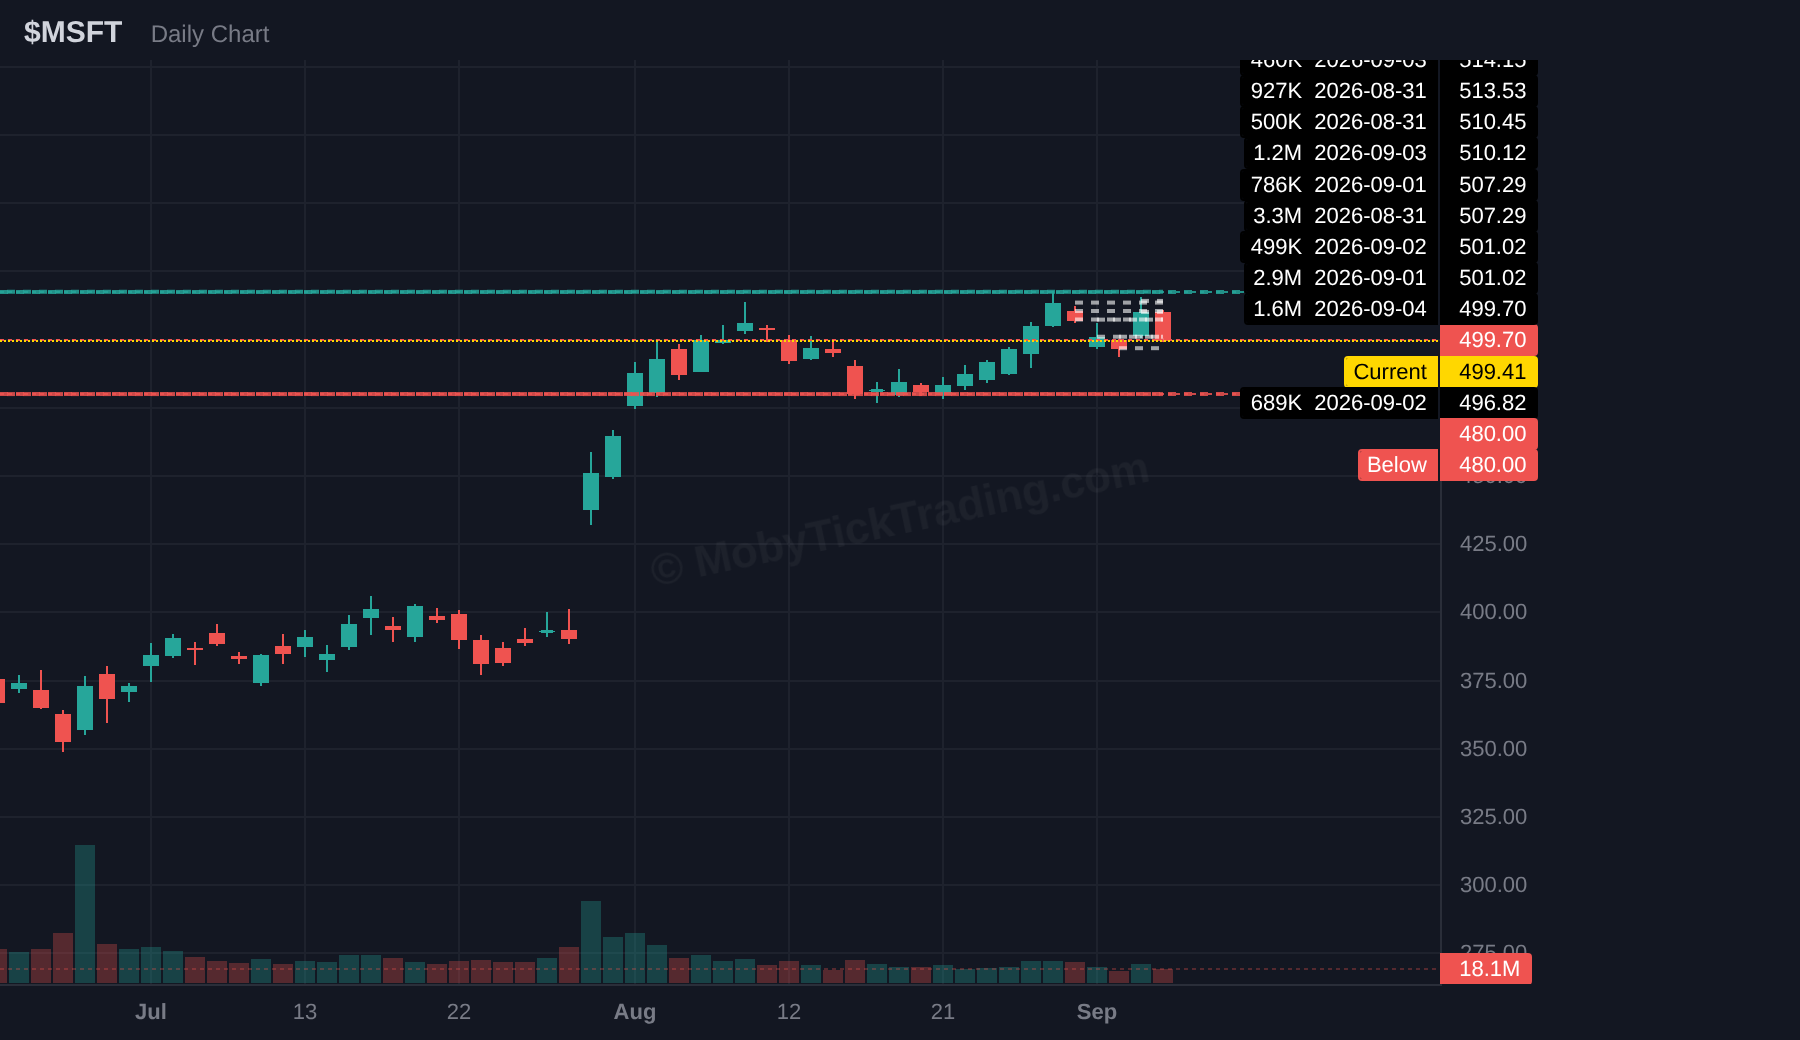
| MSFT | $517.5 | $520 → $525 → $530 → $535 → $540 |
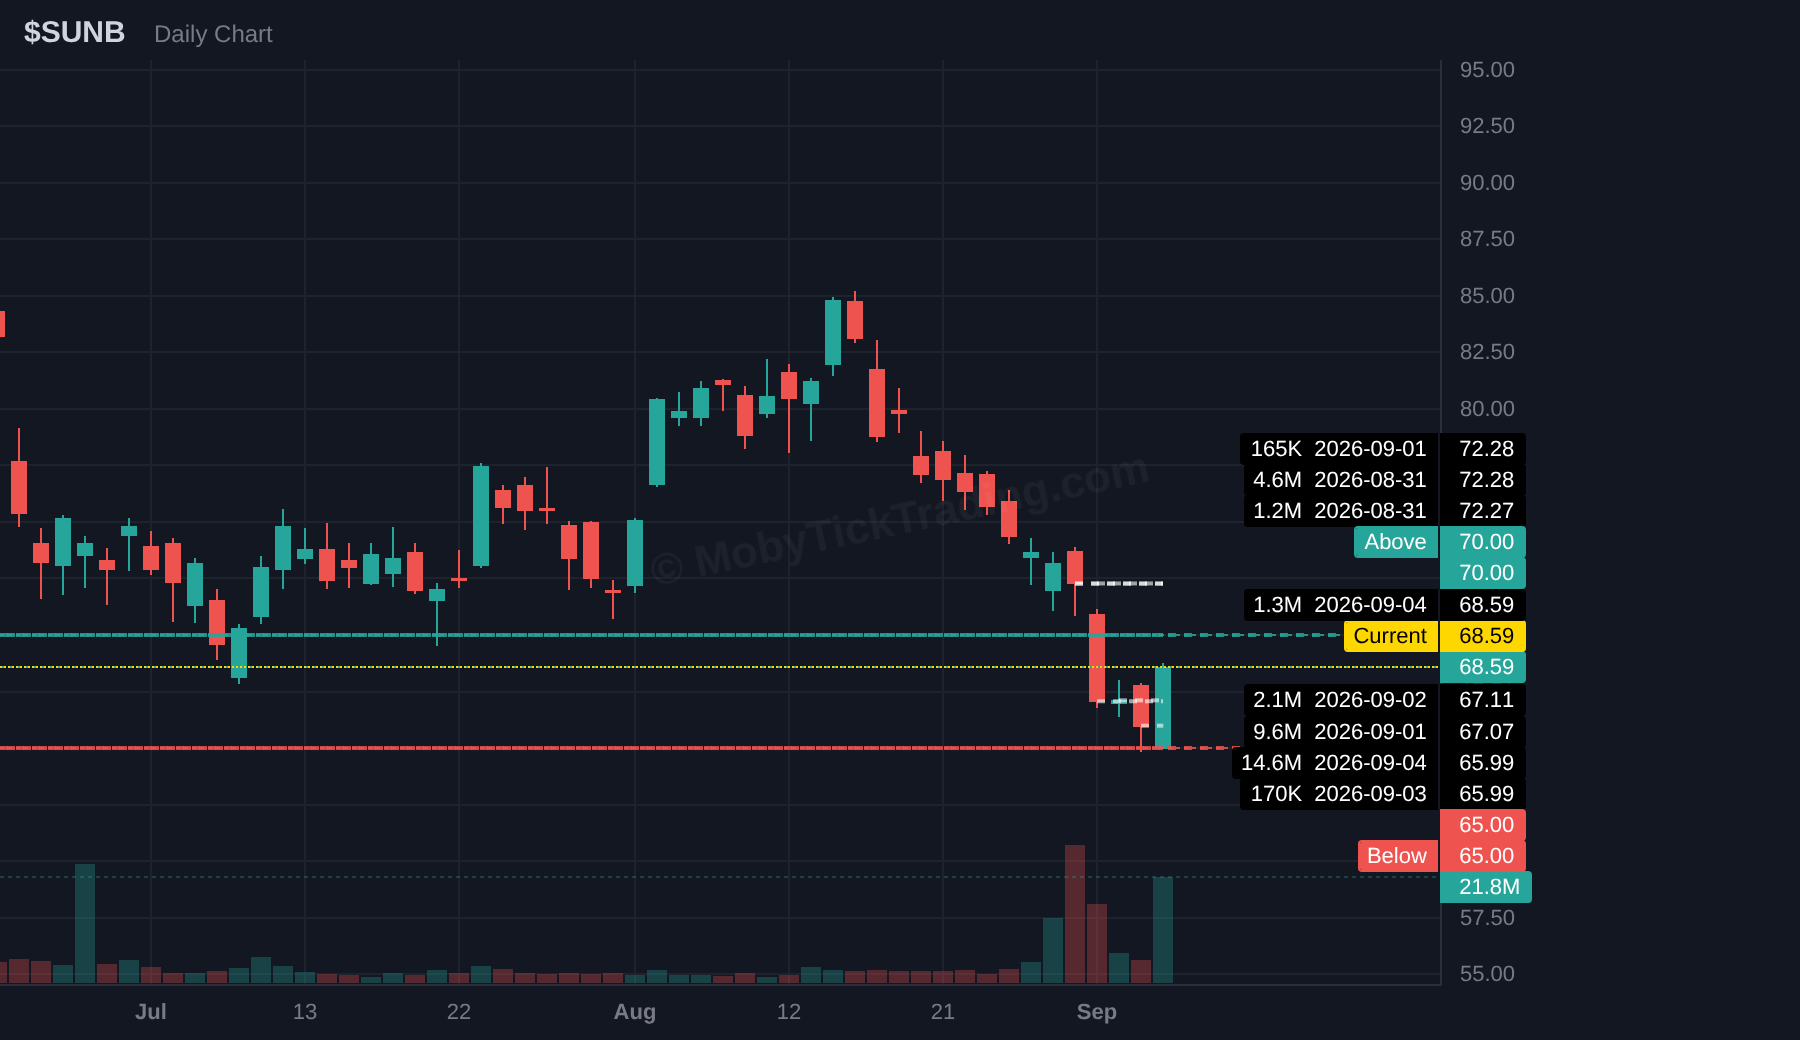
| SUNB | $70 | $71.5 → $72.5 → $75 → $77.5 → $80 |
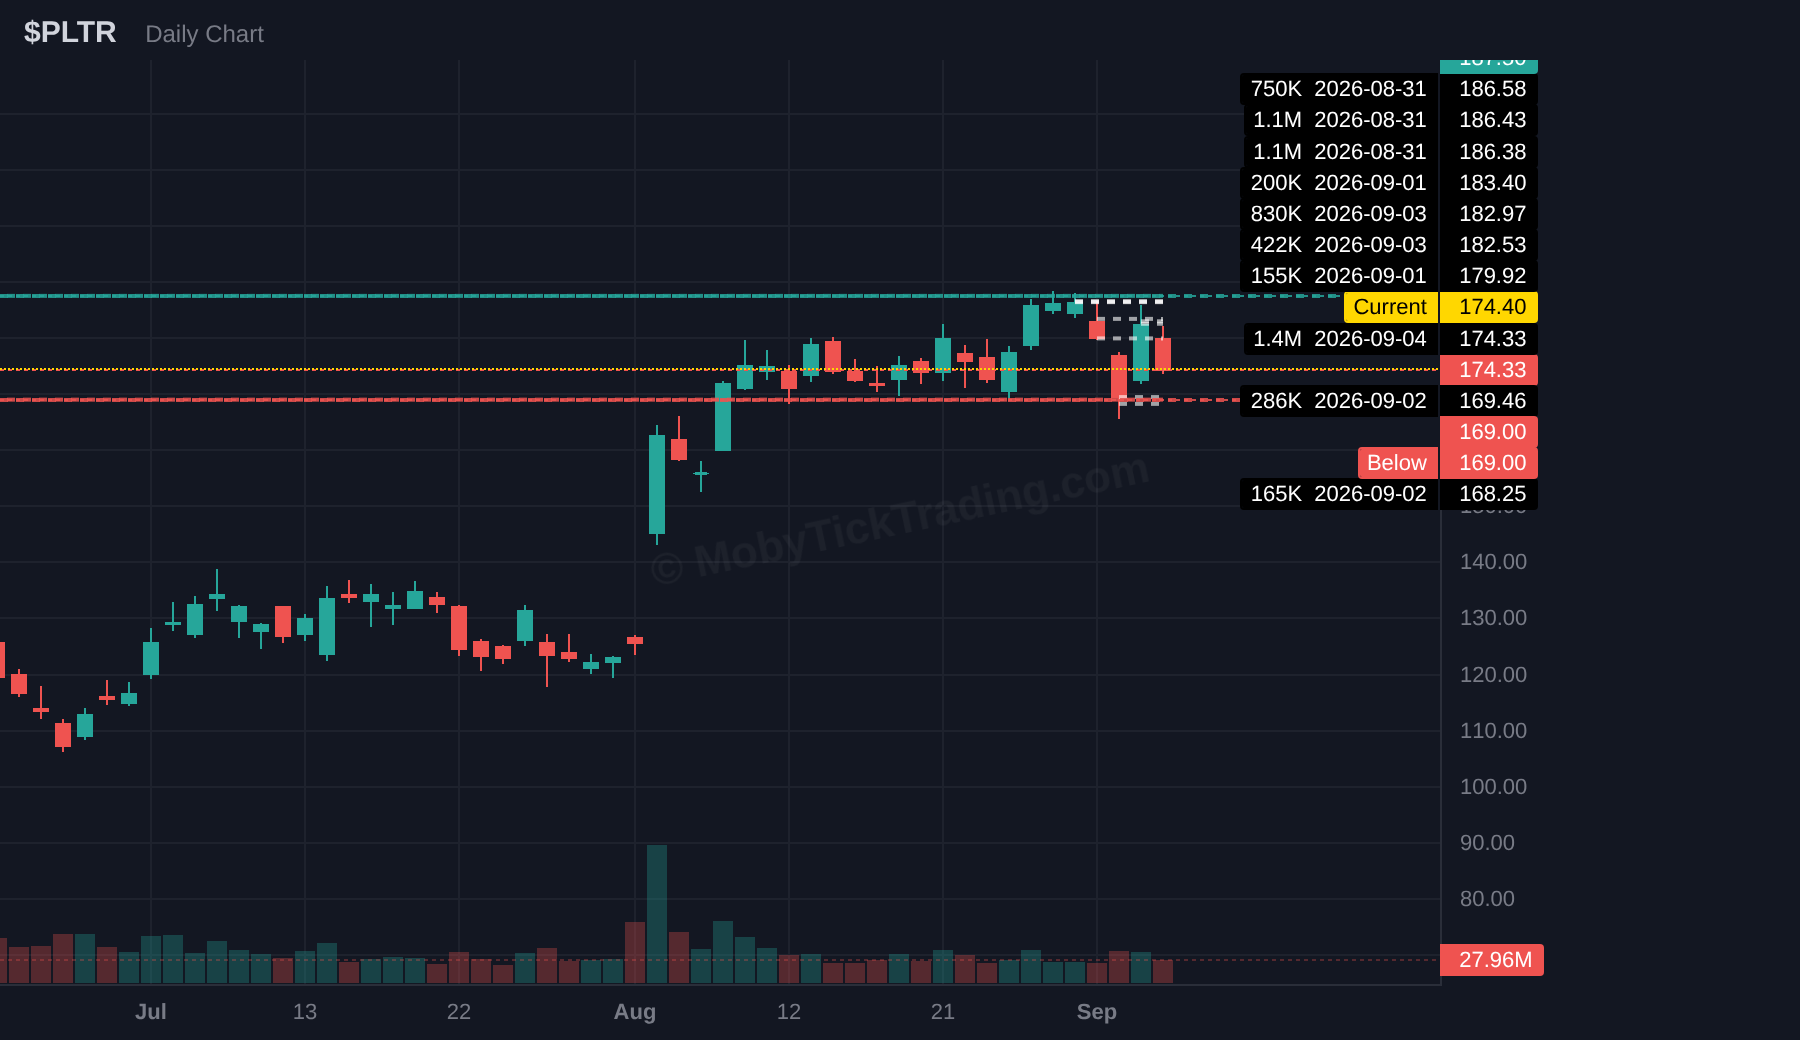
| PLTR | $187.5 | $190 → $192.5 → $195 → $197.5 → $200 |
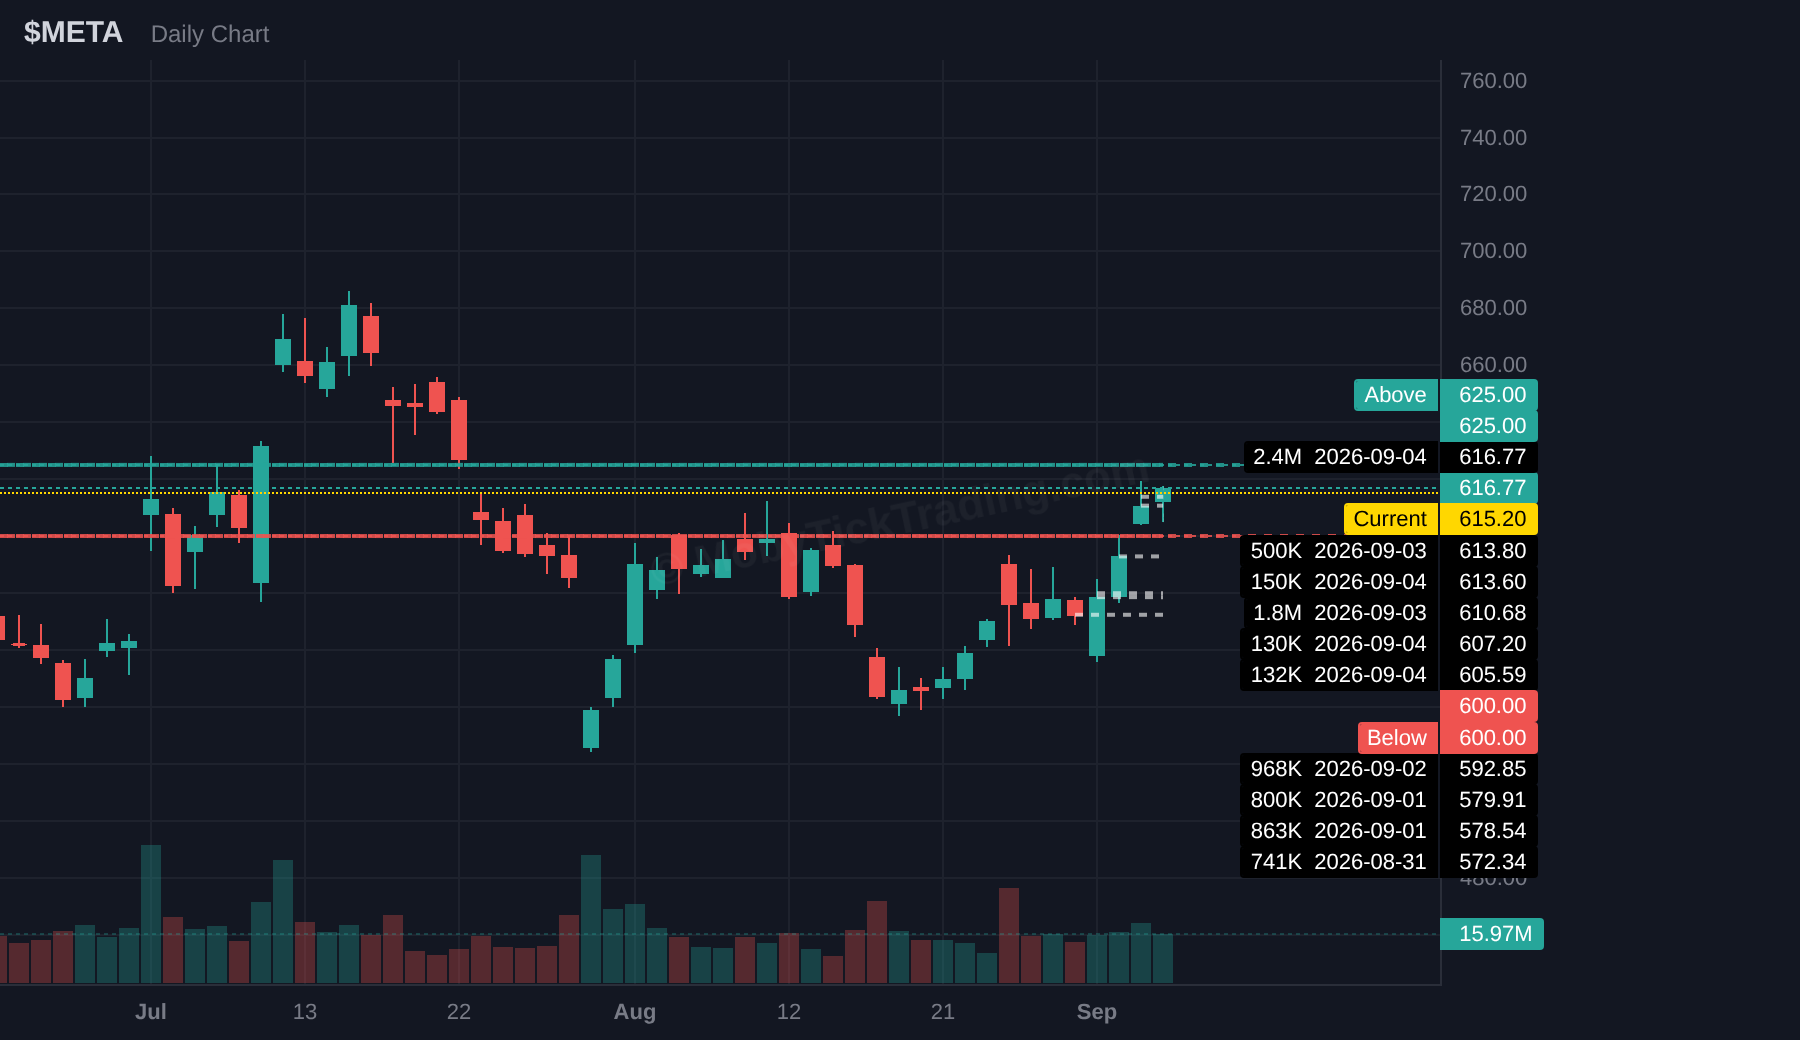
| META | $625 | $640 → $650 → $660 → $675 |
| CVX | $212.5 | $215 → $217.5 → $220 → $222.5 → $225 |
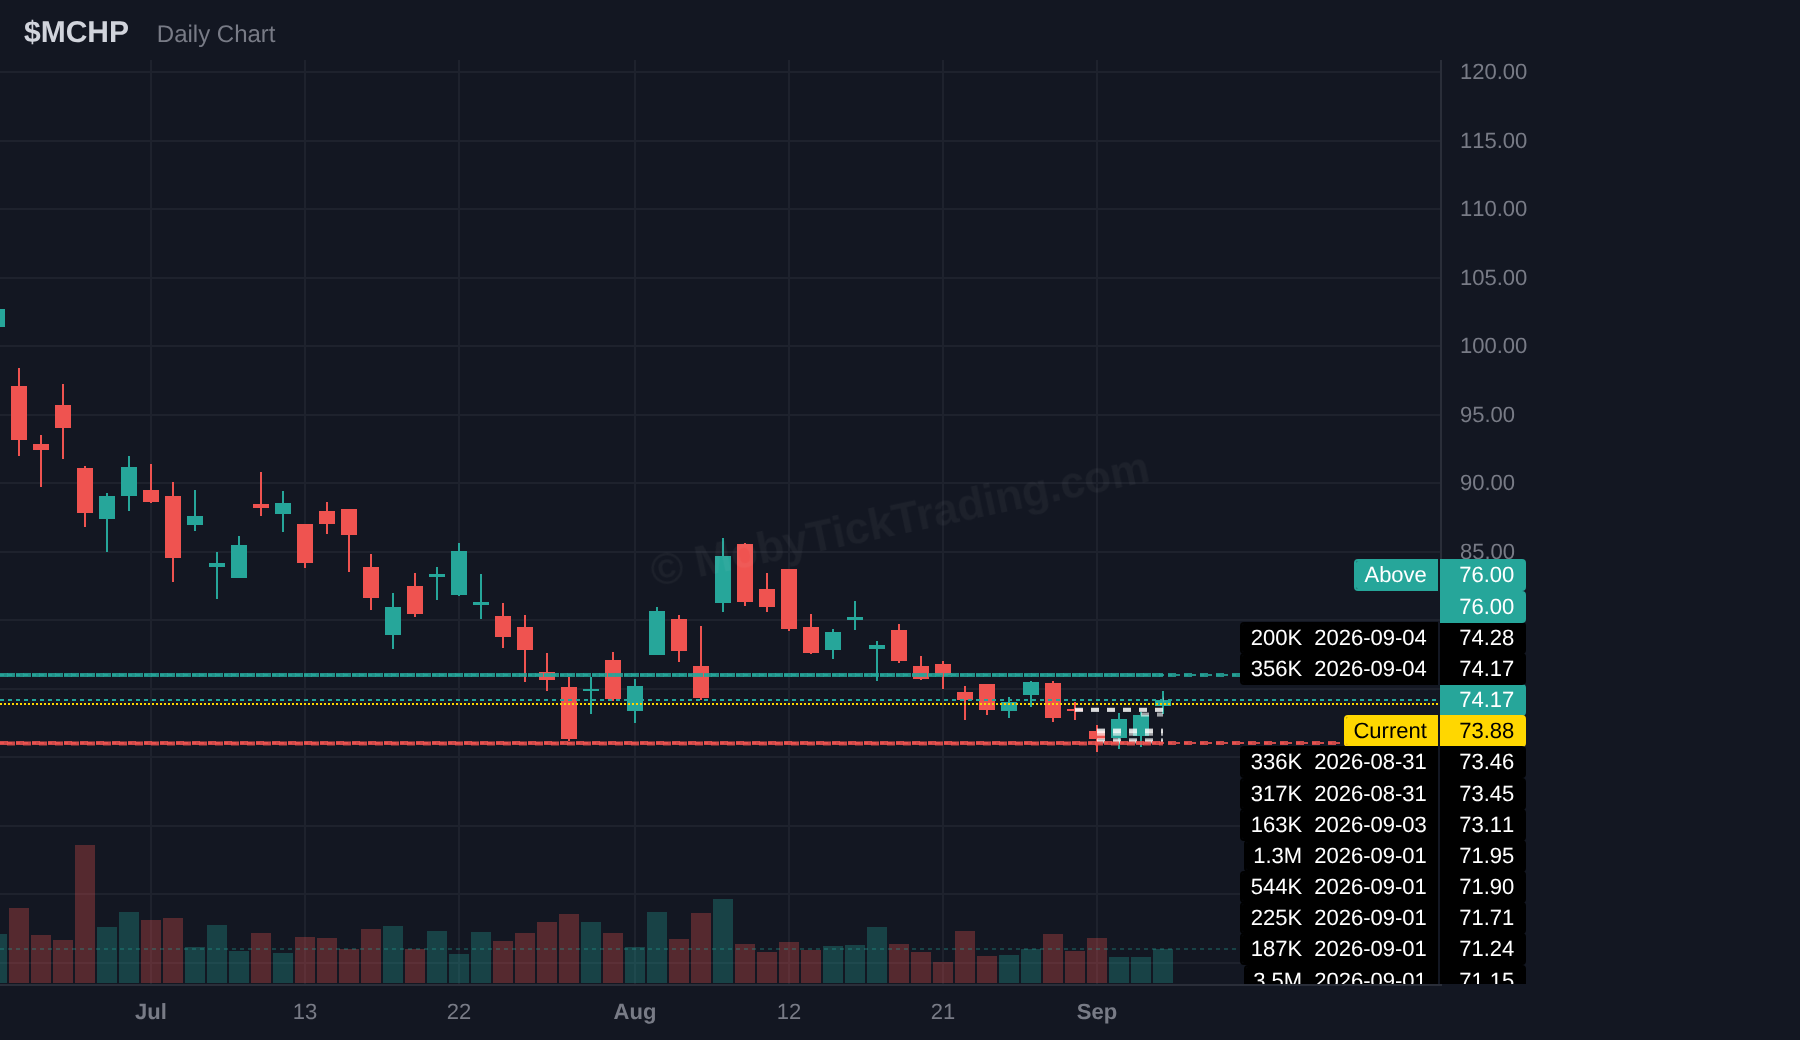
| MCHP | $76 | $77.5 → $80 → $82.5 → $85 → $87.5 |
| INTC | $97.5 | $100 → $102.5 → $105 → $110 → $115 → $120 |
| Ticker | Below Trigger | Targets |
|---|---|---|
| SPY | $760 | $757.5 → $750 → $745 → $740 → $735 → $730 |
| QQQ | $705 | $700 → $695 → $685 → $680 → $675 |
| IWM | $290 | $287.5 → $285 → $282.5 → $280 → $277.5 → $275 |
| SPCX | $132.5 | $130 → $125 → $120 → $115 → $110 |
| WDC | $440 | $420 → $400 → $380 → $360 → $340 → $320 |
| CRWV | $81 | $80 → $77.5 → $75 → $72.5 → $70 → $68 |
| MSFT | $480 | $475 → $470 → $460 → $450 → $440 |
| SUNB | $65 | $62.5 → $60 → $58.25 → $57.5 → $55 |
| PLTR | $169 | $167.5 → $165 → $162.5 → $160 |
| META | $600 | $590 → $570 → $560 → $550 |
| CVX | $200 | $197.5 → $195 → $192.5 → $190 |
| MCHP | $71 | $70 → $67.5 → $65 → $62.5 → $60 |
| INTC | $86.25 | $85 → $82.5 → $80 → $77.5 → $75 |
Each card below shows the dark pool flow data for the past week, along with the key trigger levels and profit targets for the upcoming week. Dark pool stats are sourced from MobyTick’s proprietary analytics.
Above $780 → $782.5 → $785 → $790 → $795 → $800
Below $760 → $757.5 → $750 → $745 → $740 → $735 → $730
Above $725 → $730 → $735 → $740 → $745 → $750
Below $705 → $700 → $695 → $685 → $680 → $675
Above $300 → $302.5 → $305 → $307.5 → $310
Below $290 → $287.5 → $285 → $282.5 → $280 → $277.5 → $275
Above $152.5 → $155 → $157.5 → $160 → $165 → $170 → $175 → $180
Below $132.5 → $130 → $125 → $120 → $115 → $110
Above $470 → $485 → $500 → $520 → $550 → $580 → $600
Below $440 → $420 → $400 → $380 → $360 → $340 → $320
Above $91 → $92.5 → $95 → $97.5 → $100 → $107.5
Below $81 → $80 → $77.5 → $75 → $72.5 → $70 → $68
Above $517.5 → $520 → $525 → $530 → $535 → $540
Below $480 → $475 → $470 → $460 → $450 → $440
Above $70 → $71.5 → $72.5 → $75 → $77.5 → $80
Below $65 → $62.5 → $60 → $58.25 → $57.5 → $55
Above $187.5 → $190 → $192.5 → $195 → $197.5 → $200
Below $169 → $167.5 → $165 → $162.5 → $160
Above $625 → $640 → $650 → $660 → $675
Below $600 → $590 → $570 → $560 → $550
Above $212.5 → $215 → $217.5 → $220 → $222.5 → $225
Below $200 → $197.5 → $195 → $192.5 → $190
Above $76 → $77.5 → $80 → $82.5 → $85 → $87.5
Below $71 → $70 → $67.5 → $65 → $62.5 → $60
Above $97.5 → $100 → $102.5 → $105 → $110 → $115 → $120
Below $86.25 → $85 → $82.5 → $80 → $77.5 → $75
Broad market ETFs printed $44.13B in dark pool notional from August 31 to September 4. The nine sector funds tracked here printed $3.20B. That is a 13.8-to-1 split, and it tells you exactly where size wanted to trade this week: the wrapper, not the slice.
IVV led at $15.91B, 1.44x SPY’s $11.07B. QQQ and VOO landed on the same figure, $8.26B each. IWM printed $0.63B. That puts the small cap vehicle at 1/25th of IVV and 1.4% of the broad market total. The four large cap vehicles took the other 98.6%. IVV and SPY alone accounted for $26.98B, or 61% of broad ETF notional.
| Sector ETF | Notional |
|---|---|
| SMH | $1.19B |
| XLI | $0.66B |
| XLF | $0.56B |
| XLE | $0.24B |
| XLU | $0.19B |
| XLV | $0.14B |
| XBI | $0.08B |
| XLB | $0.07B |
| XLRE | $0.07B |
SMH took 37% of all sector notional on its own. Its $1.19B nearly matched XLI and XLF combined at $1.22B, and ran 5.0x XLE. Stack the bottom six names together and you get $0.79B across XLE, XLU, XLV, XBI, XLB, and XLRE, and SMH still outprints that group by 1.5x. The semis fund also printed 1.9x IWM’s total, so one industry tracker carried more notional than the small cap index vehicle.
The top three, SMH, XLI, and XLF, held $2.41B, or 75% of sector notional. Everything from XLE down split the remaining $0.79B. The bottom three, XBI, XLB, and XLRE, combined for $0.22B, less than XLE by itself and less than 1.5% of IVV’s single-name total.
Defensives, materials, and real estate sat at the floor. XLU at $0.19B, XLV at $0.14B, and XBI at $0.08B rank fifth, sixth, and seventh in a nine-name field. XLU, XLV, XBI, XLB, and XLRE together reached $0.55B, just under XLF’s $0.56B on its own.
Three of this week’s 13 callouts are the index products above: SPY, QQQ, and IWM. Four more sit inside the SMH basket or adjacent to it: WDC, MCHP, INTC, and CRWV. One, CVX, maps to the $0.24B XLE line. The rest of the sheet reads SPCX, MSFT, SUNB, PLTR, and META.
Data sourced from MobyTick.
Two dark pool tapes can show the same notional and describe completely different activity. Count the prints.
WDC posted one print this week. One. That single block carried $406.3M on 0.92M shares, 0.12x its average daily volume. One large counterparty moved once, at one timestamp, and then the name went quiet. That is concentration with no repetition.
INTC ran the other pattern: 17 prints stacked to $2.13B, averaging $125.1M each across 23.24M shares. Same order of magnitude in dollars as five WDC blocks, but spread across 17 separate executions. Repetition is what separates them. One print records a single execution. Seventeen record repeated participation. Neither pattern ranks above the other; they describe different activity on the tape.
| Ticker | Prints | Total notional | Avg $ per print | Shares (M) | ADV multiple |
|---|---|---|---|---|---|
| WDC | 1 | $406.3M | $406.3M | 0.92 | 0.12 |
| SPCX | 3 | $292.7M | $97.6M | 2.06 | n/a (thin listing) |
| CRWV | 3 | $127.6M | $42.6M | 1.54 | 0.06 |
| PLTR | 4 | $606.1M | $151.5M | 3.31 | 0.08 |
| CVX | 4 | $647.5M | $161.9M | 3.13 | 0.40 |
| META | 8 | $3.64B | $455.3M | 6.05 | 0.35 |
| MSFT | 9 | $2.99B | $332.6M | 5.93 | 0.19 |
| MCHP | 9 | $349.7M | $38.9M | 4.90 | 0.50 |
| SUNB | 11 | $1.98B | $179.7M | 29.45 | 6.30 |
| INTC | 17 | $2.13B | $125.1M | 23.24 | 0.22 |
Print count alone will mislead you. META and MCHP sit one print apart at 8 and 9, and their totals differ by 10.4x. META averaged $455.3M per print, larger than WDC’s entire week in a single execution. MCHP averaged $38.9M, the smallest figure on the sheet. Frequent and small is a different tape than frequent and large.
SUNB combined both axes: 11 prints, $1.98B, 29.45M shares, and 6.30x ADV. Every other name on the list printed at or below 0.50x its average volume, with MCHP next highest at 0.50x. SUNB is the only entry where repetition and size scaled together.
> Key Takeaway: Read prints and notional as two separate readings, not one. A lone block tells you one participant transacted at size once; a run of prints tells you participation repeated, and the average print size tells you at what scale.
Data sourced from MobyTick.
Get institutional-grade dark pool intelligence delivered to your inbox every week.
Disclaimer: This newsletter is for informational and educational purposes only. It does not constitute financial advice, investment recommendations, or solicitation to buy or sell securities. Trading stocks, ETFs, and options involves substantial risk of loss. Past performance is not indicative of future results.