Physical Address
304 North Cardinal St.
Dorchester Center, MA 02124
Physical Address
304 North Cardinal St.
Dorchester Center, MA 02124

This week's Whale Playbook: 13 callouts spanning crypto spot proxies, semiconductor distribution, and a biotech breakout, plus a crypto market-structure deep dive on IBIT, ETHA, and MSTR.
Broad indices finished the week of August 17–21 lower, with the damage concentrated in technology and semiconductors while health care and biotech ran hard in the other direction. The S&P 500 and Nasdaq Composite snapped three-week winning streaks and the Dow logged a second consecutive weekly decline, per Investopedia’s August 21 recap, even though all three closed higher on Friday. Under the surface it was a rotation week rather than a uniform de-risking: money left semis and industrials and showed up in biotech, energy and materials, while crypto spot proxies posted double-digit gains. Six of last week’s 13 scorecard names traded through both their above and below levels intraweek, which is the cleanest single statistic for how two-sided the tape was.
| ETF | Index | Open → Close | Change |
|---|---|---|---|
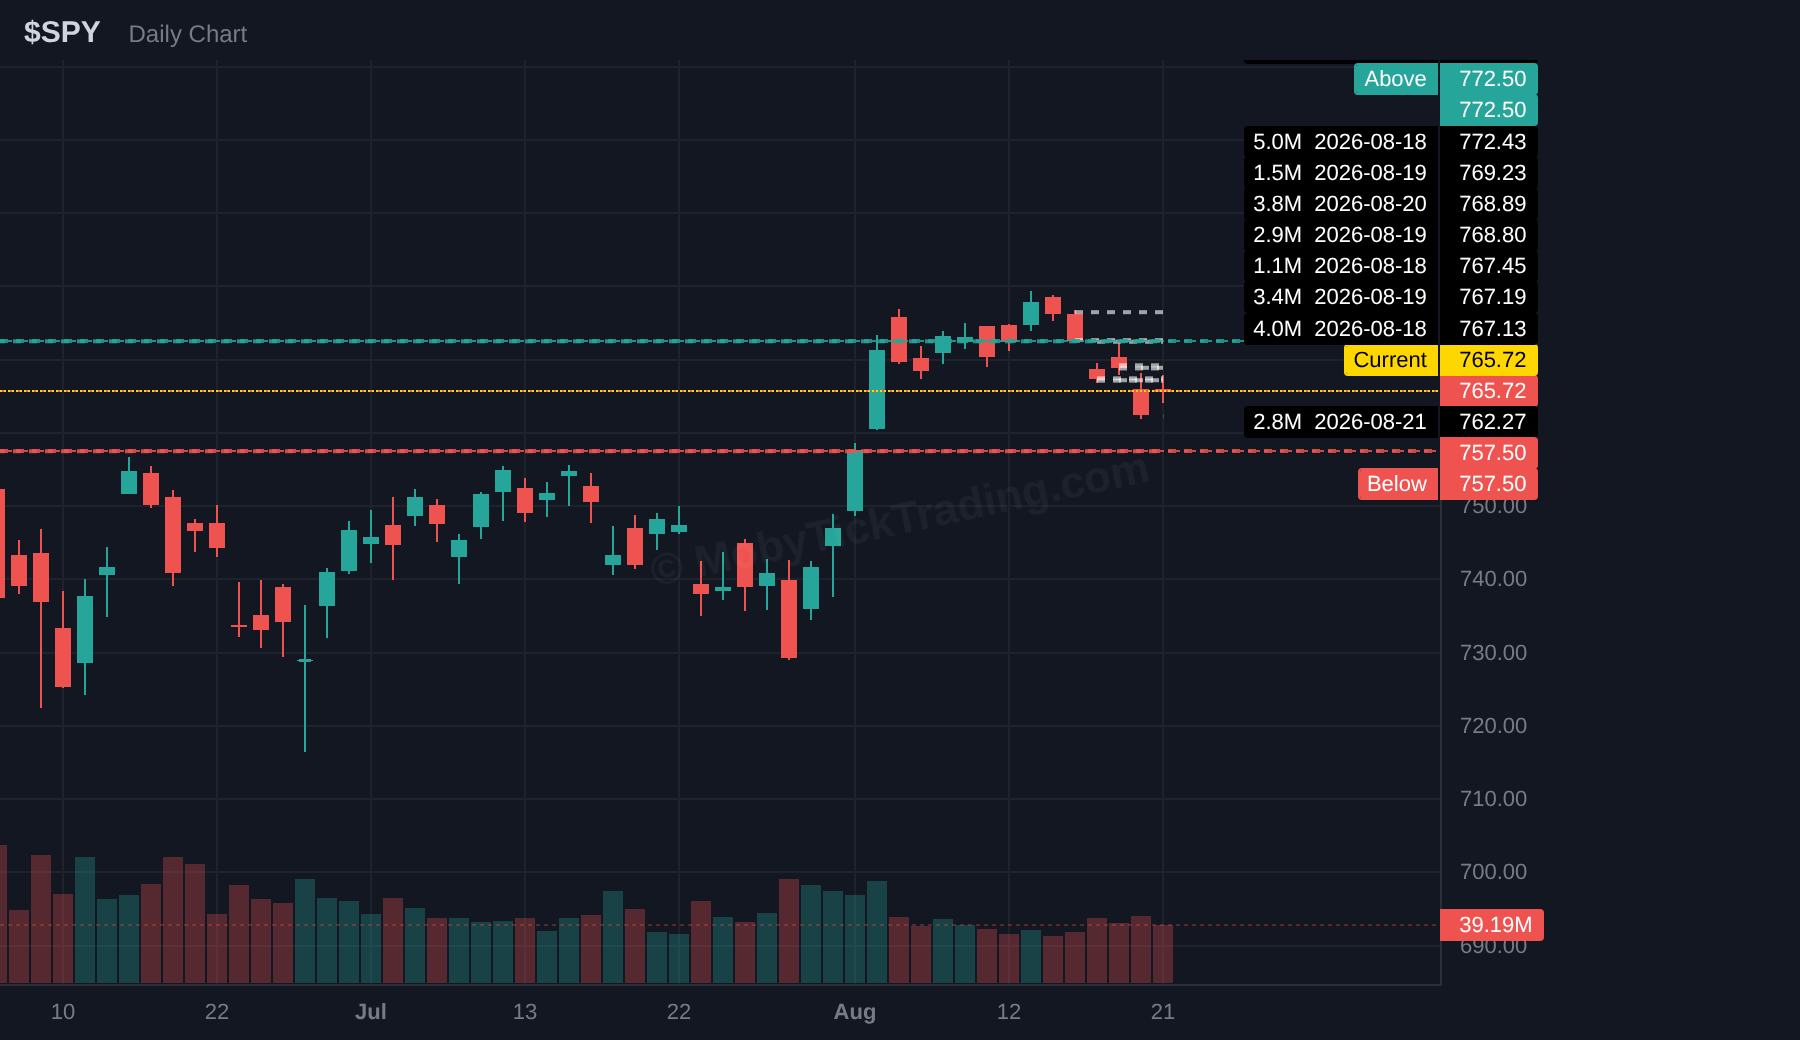
| SPY | S&P 500 | 776.18 → 765.72 | −1.35% |
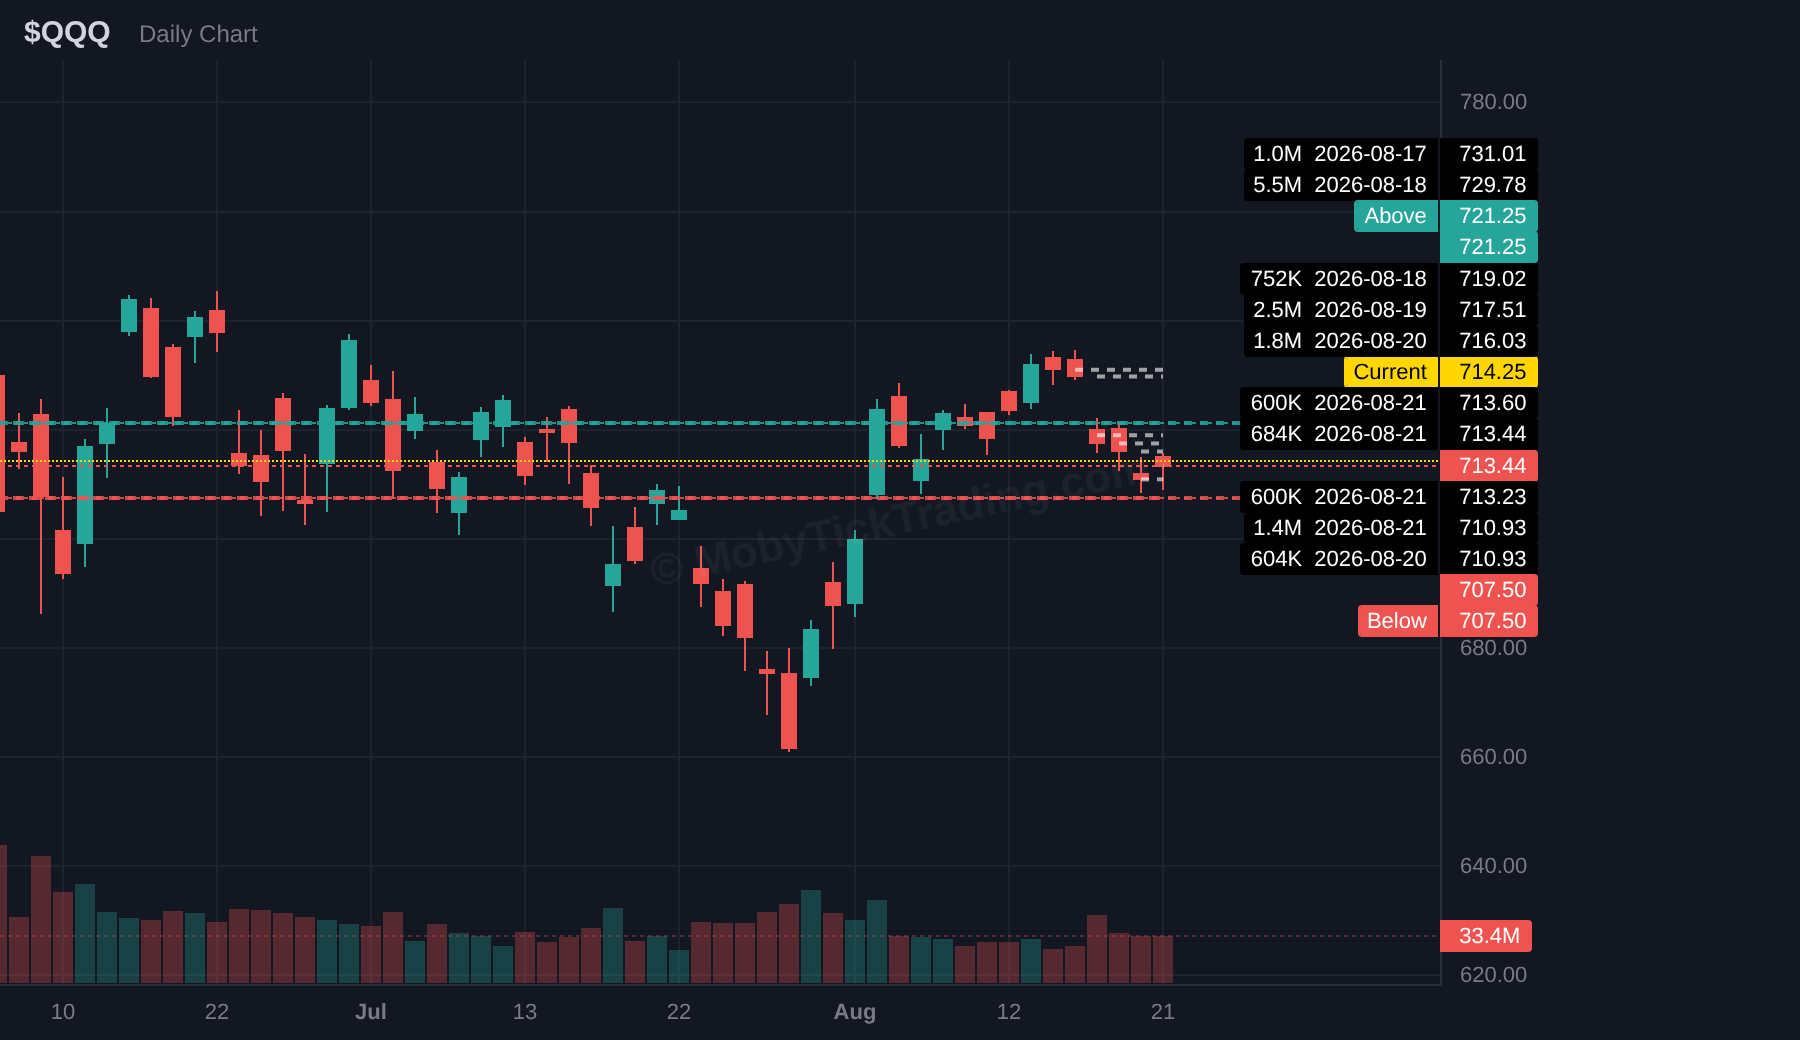
| QQQ | Nasdaq 100 | 732.95 → 713.44 | −2.66% |
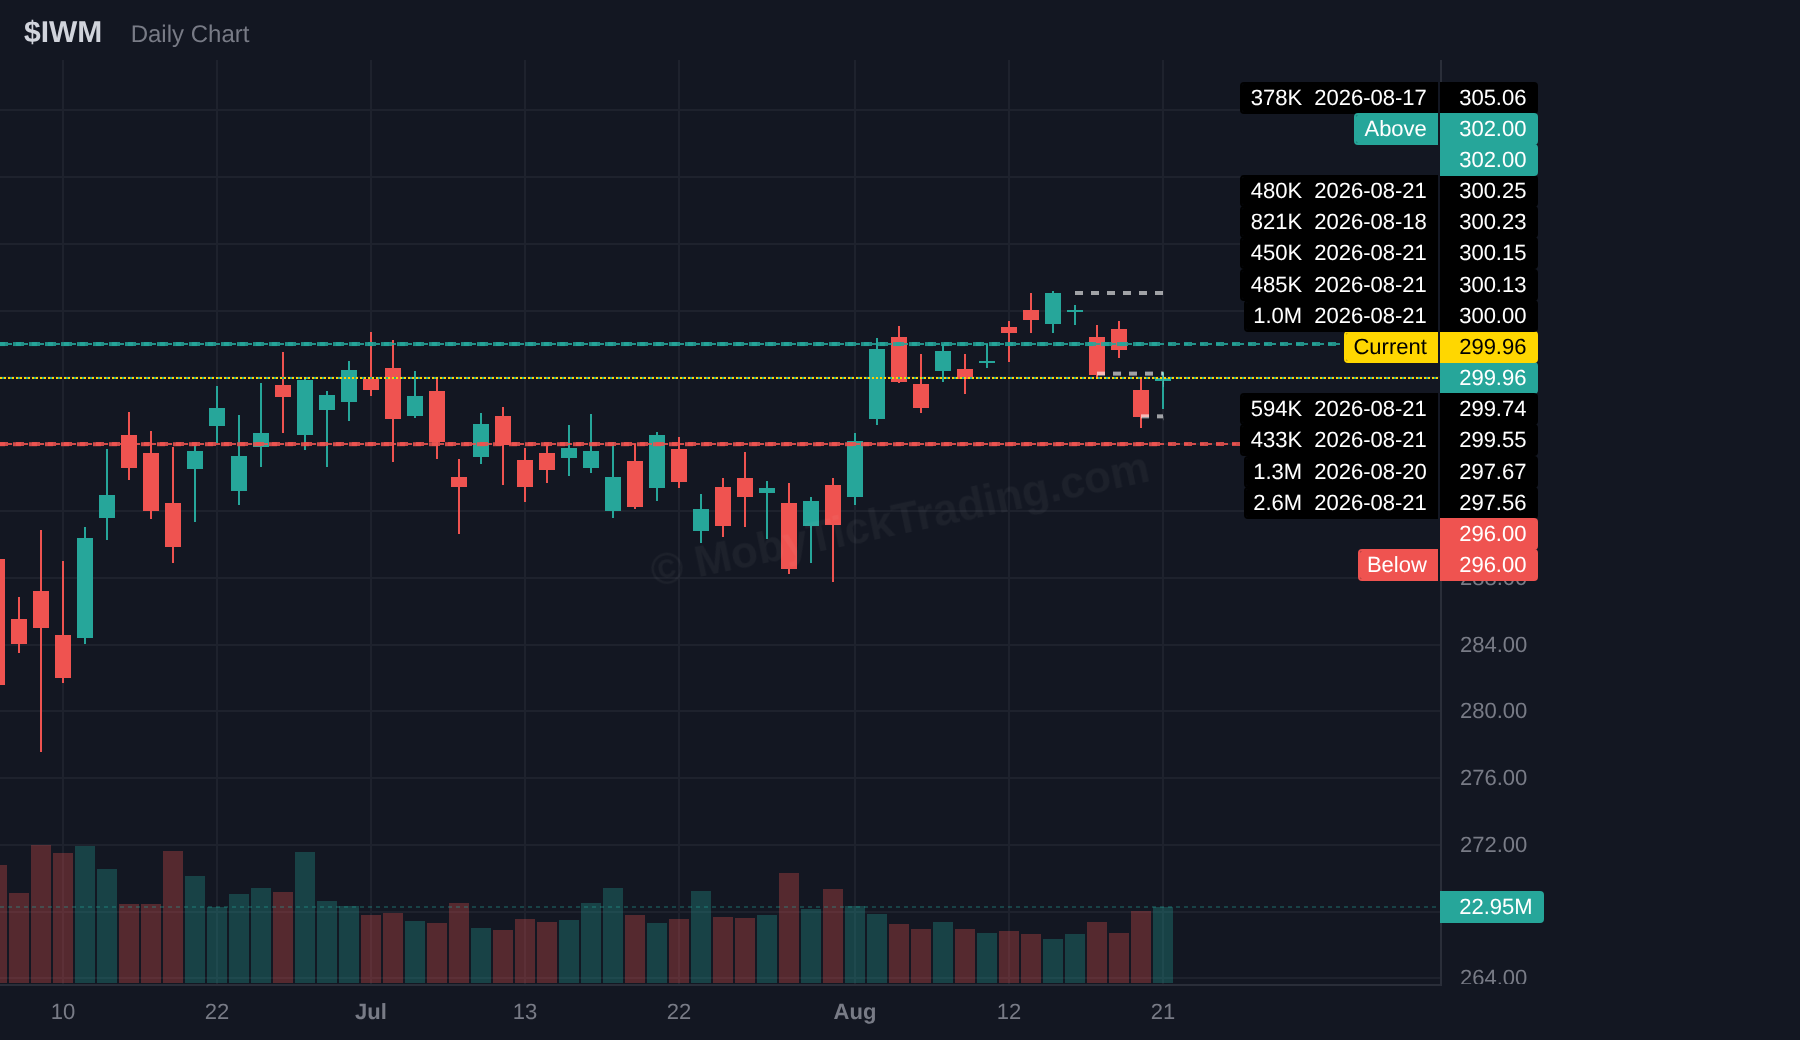
| IWM | Russell 2000 | 303.96 → 299.96 | −1.32% |
| DIA | Dow 30 | 534.50 → 532.22 | −0.43% |
Sector performance. Health care (XLV) led at +4.91%, with the biotech complex even stronger — XBI +5.67% and IBB +7.70%. Energy (XLE +2.29%) and materials (XLB +2.27%) were the next best, followed by staples (XLP +0.74%) and discretionary (XLY +0.05%). Real estate was flat (XLRE −0.04%). The bottom of the table was technology-heavy: XLK −3.92%, industrials (XLI) −3.29%, utilities (XLU) −3.24%, comm services (XLC) −0.98% and financials (XLF) −0.83%. Semiconductors were the week’s worst-performing group of all, with SMH −5.61% and SOXX −6.79%.
Macro data. The July 28–29 FOMC minutes, released Wednesday, August 19 at 2:00 p.m. ET, showed inflation concerns had increased among participants; most supported holding the funds rate unchanged, while several favored a hike (Reuters, Federal Reserve). Housing data was soft: Census reported July privately-owned housing starts at a 1,239,000 seasonally adjusted annual rate on August 18, down 12.4% from June’s revised 1,415,000 and down 13.5% year over year, with permits up on the month. The Philadelphia Fed manufacturing index for August came in at 47.4 versus a 25 consensus and 41.4 in July, and initial jobless claims printed 206K, slightly better than expected. The 10-year Treasury yield ended the week in the 4.7% area, near recent highs. Reported U.S.–Iran tensions and firmer oil prices were cited in coverage of the week’s midweek weakness; treat the geopolitical framing as press attribution rather than confirmed policy developments.
Rotation and biotech. The dominant flow story was out of tech/semis and into health care. Moderna (MRNA) closed Wednesday, August 19 at $174.38, up roughly 177% on the day, after Moderna and Merck reported positive Phase 3 melanoma data for their personalized mRNA cancer vaccine (intismeran). The move dragged the whole group higher — biotech indices hit post-pandemic highs on the news — and then reversed violently: MRNA fell about 25% Thursday on profit-taking before rebounding Friday, trading between roughly $131.53 and $159.47 on August 21. That single name accounts for much of the IBB +7.70% versus XBI +5.67% spread, though the sector move was broader than one headline. Energy (+2.29%) and materials (+2.27%) picked up the rest of the rotation dollars.
Crypto. Spot crypto proxies diverged sharply from the broader tape. IBIT finished the week +21.7%, ETHA +27.6% and MSTR +27.9% — all substantially positive in a week when SPY and QQQ were both down. That divergence, not the absolute size of the move, is the notable part: the strongest percentage gains of the week came from a group with no exposure to the semiconductor drawdown.
Dark pool flow. Institutional prints stayed overwhelmingly index-level. Broad index ETFs drew roughly $34.33B — VOO $9.96B, IVV $9.74B, SPY $8.97B, QQQ $4.30B and IWM $1.35B — against roughly $4.29B across all sector ETFs combined, about an 8:1 ratio. Single-stock flow clustered in semis and large-cap tech: NVDA ~$4.79B on 20 prints, INTC ~$3.29B on 27 prints, TSM ~$2.26B, CRM ~$2.12B and RDDT ~$1.86B. On the crypto side, prints were smaller but consistent — IBIT $195M across 6 prints and ETHA $126M across 5 prints, with MSTR at $113M.
Scorecard recap. Of the 13 callouts in last week’s report, 11 reached at least one target. Two triggered above only (HAL, CELH), four triggered below only (SPY, IWM, AMZN, MSFT), six triggered both directions intraweek (QQQ, PM, NVDA, NBIS, FLUT, AMAT), and one did not trigger (SMCI). CELH — a continuation from last week’s report — triggered above and ran through its T2 at $32.50, finishing +9.82% and making it the week’s cleanest single follow-through. FLUT worked the other way, breaking below through T3 at $93 for −7.16% from its below trigger. HAL added +3.09% through T1 at $36, and NBIS moved −5.34% through its below T1 at $212.50. The six both-direction triggers are the number to keep in mind: levels were reached, but many were reached twice.
*Data sourced from MobyTick*
| Ticker | Above | Below | High | Low | Close | Triggered | Targets Hit | Move From Trigger |
|---|---|---|---|---|---|---|---|---|
| SPY | 780 | 770 | 776.775 | 762.04 | 765.72 | Below | 2 of 5 → T2 ($762.5) | $770 → $762.04 (-1.03%) |
| QQQ | 732.5 | 720 | 734.58 | 708.52 | 713.44 | Both | ↑ 0 of 6 · ↓ 2 of 4 → T2 ($710) | $720 → $708.52 (-1.59%) |
| IWM | 306 | 300 | 304.33 | 297.04 | 299.96 | Below | 1 of 6 → T1 ($297.5) | $300 → $297.04 (-0.99%) |
| HAL | 35 | 31.8 | 36.08 | 34.17 | 35.34 | Above | 1 of 5 → T1 ($36) | $35 → $36.08 (+3.09%) |
| PM | 191 | 186 | 194.26 | 184.28 | 188.23 | Both | ↑ 2 of 5 → T2 ($193) · ↓ 1 of 5 → T1 ($185) | $191 → $194.26 (+1.71%) |
| CELH | 30.5 | 26.75 | 33.495 | 27.68 | 33.36 | Above | 2 of 5 → T2 ($32.5) | $30.5 → $33.495 (+9.82%) |
| NVDA | 227.5 | 217.5 | 227.92 | 214.5 | 214.72 | Both | ↑ 0 of 6 · ↓ 1 of 4 → T1 ($215) | $217.5 → $214.5 (-1.38%) |
| NBIS | 280 | 224 | 280.83 | 212.04 | 219.13 | Both | ↑ 0 of 5 · ↓ 1 of 5 → T1 ($212.5) | $224 → $212.04 (-5.34%) |
| AMZN | 272.5 | 262.5 | 266.4 | 257.035 | 258.63 | Below | 1 of 5 → T1 ($260) | $262.5 → $257.035 (-2.08%) |
| MSFT | 505 | 490 | 492.66 | 477.151 | 483.24 | Below | 1 of 5 → T1 ($480) | $490 → $477.151 (-2.62%) |
| FLUT | 102.5 | 100 | 103.5 | 92.84 | 102.61 | Both | ↑ 0 of 6 · ↓ 3 of 5 → T3 ($93) | $100 → $92.84 (-7.16%) |
| AMAT | 530 | 500 | 539.81 | 483.13 | 492.32 | Both | ↑ 0 of 7 · ↓ 0 of 6 | $500 → $483.13 (-3.37%) |
| SMCI | 41 | 35 | 39.51 | 35.582 | 37.24 | None | — | — |
| Ticker | Above Trigger | Targets |
|---|---|---|
| SPY | $772.50 | $775.00 → $777.50 → $780.00 → $787.50 → $790.00 → $800.00 |
| QQQ | $721.25 | $725.00 → $730.00 → $735.00 → $740.00 → $750.00 → $760.00 |
| IWM | $302.00 | $305.00 → $307.50 → $310.00 → $311.25 → $312.50 → $315.00 |
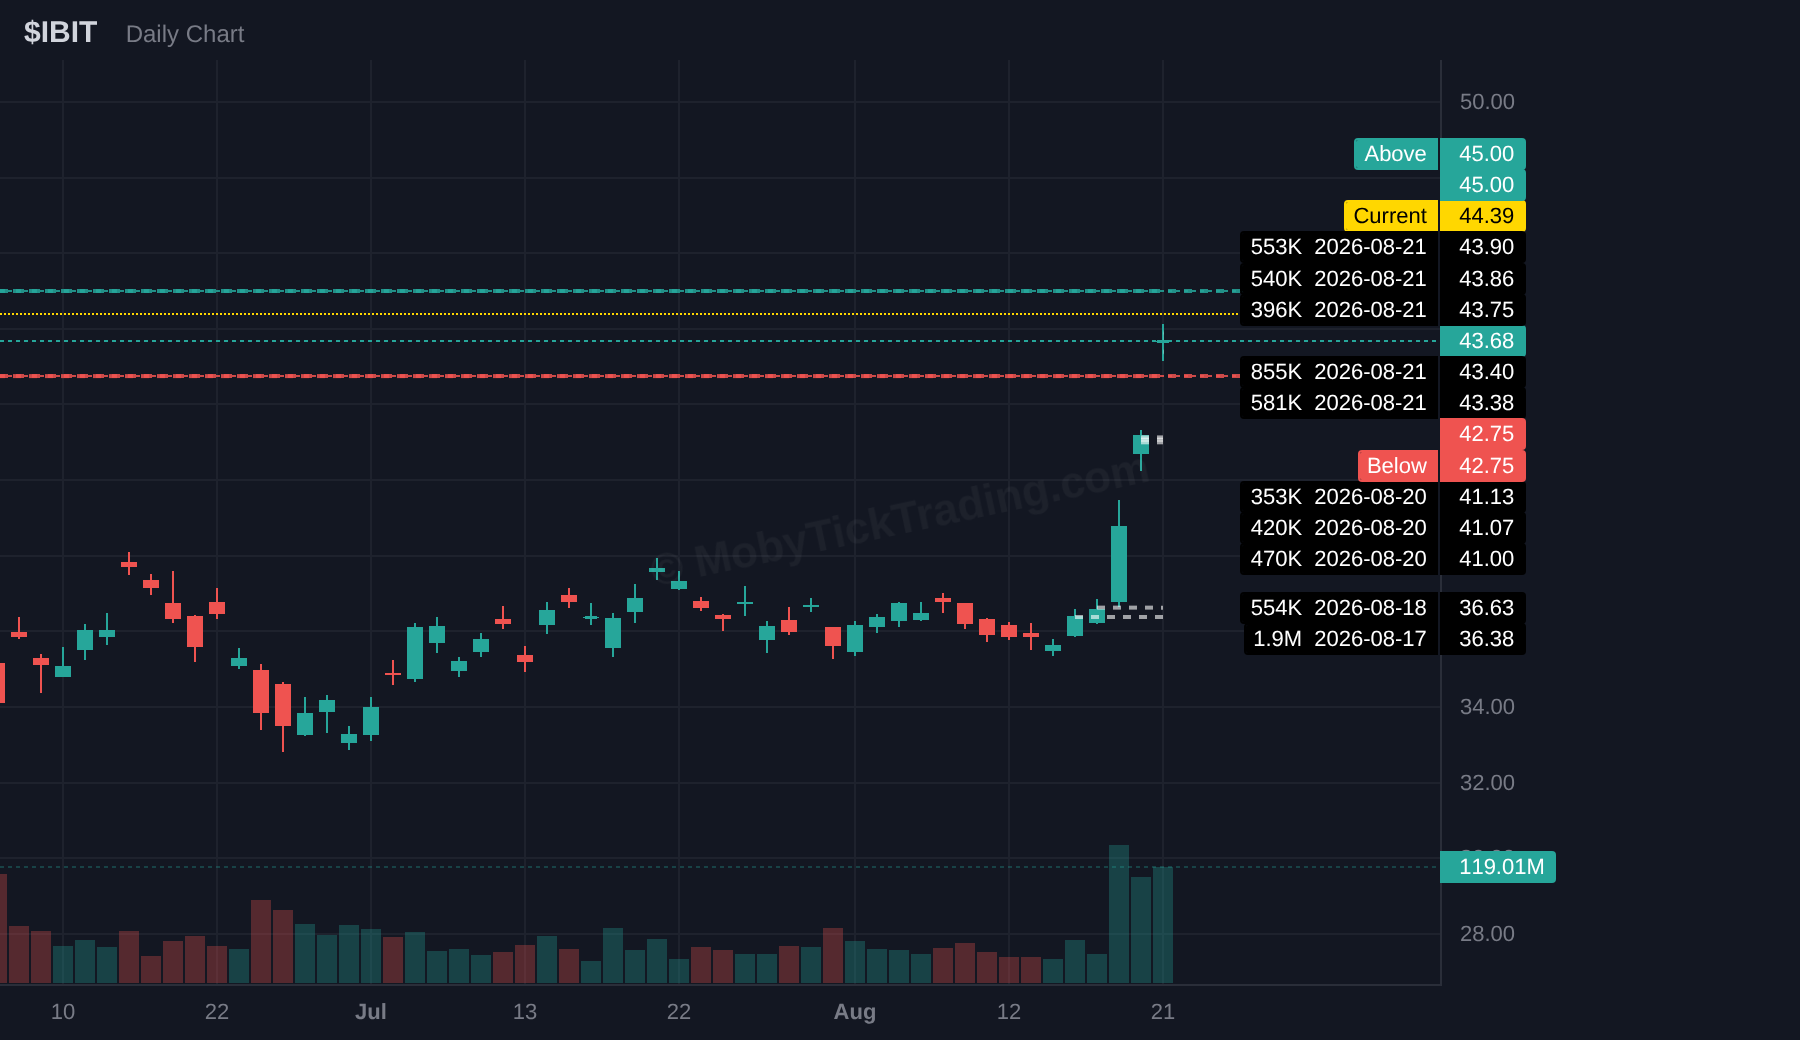
| IBIT | $45.00 | $46.00 → $46.37 → $48.50 → $50.00 → $52.50 → $55.00 → $60.00 |
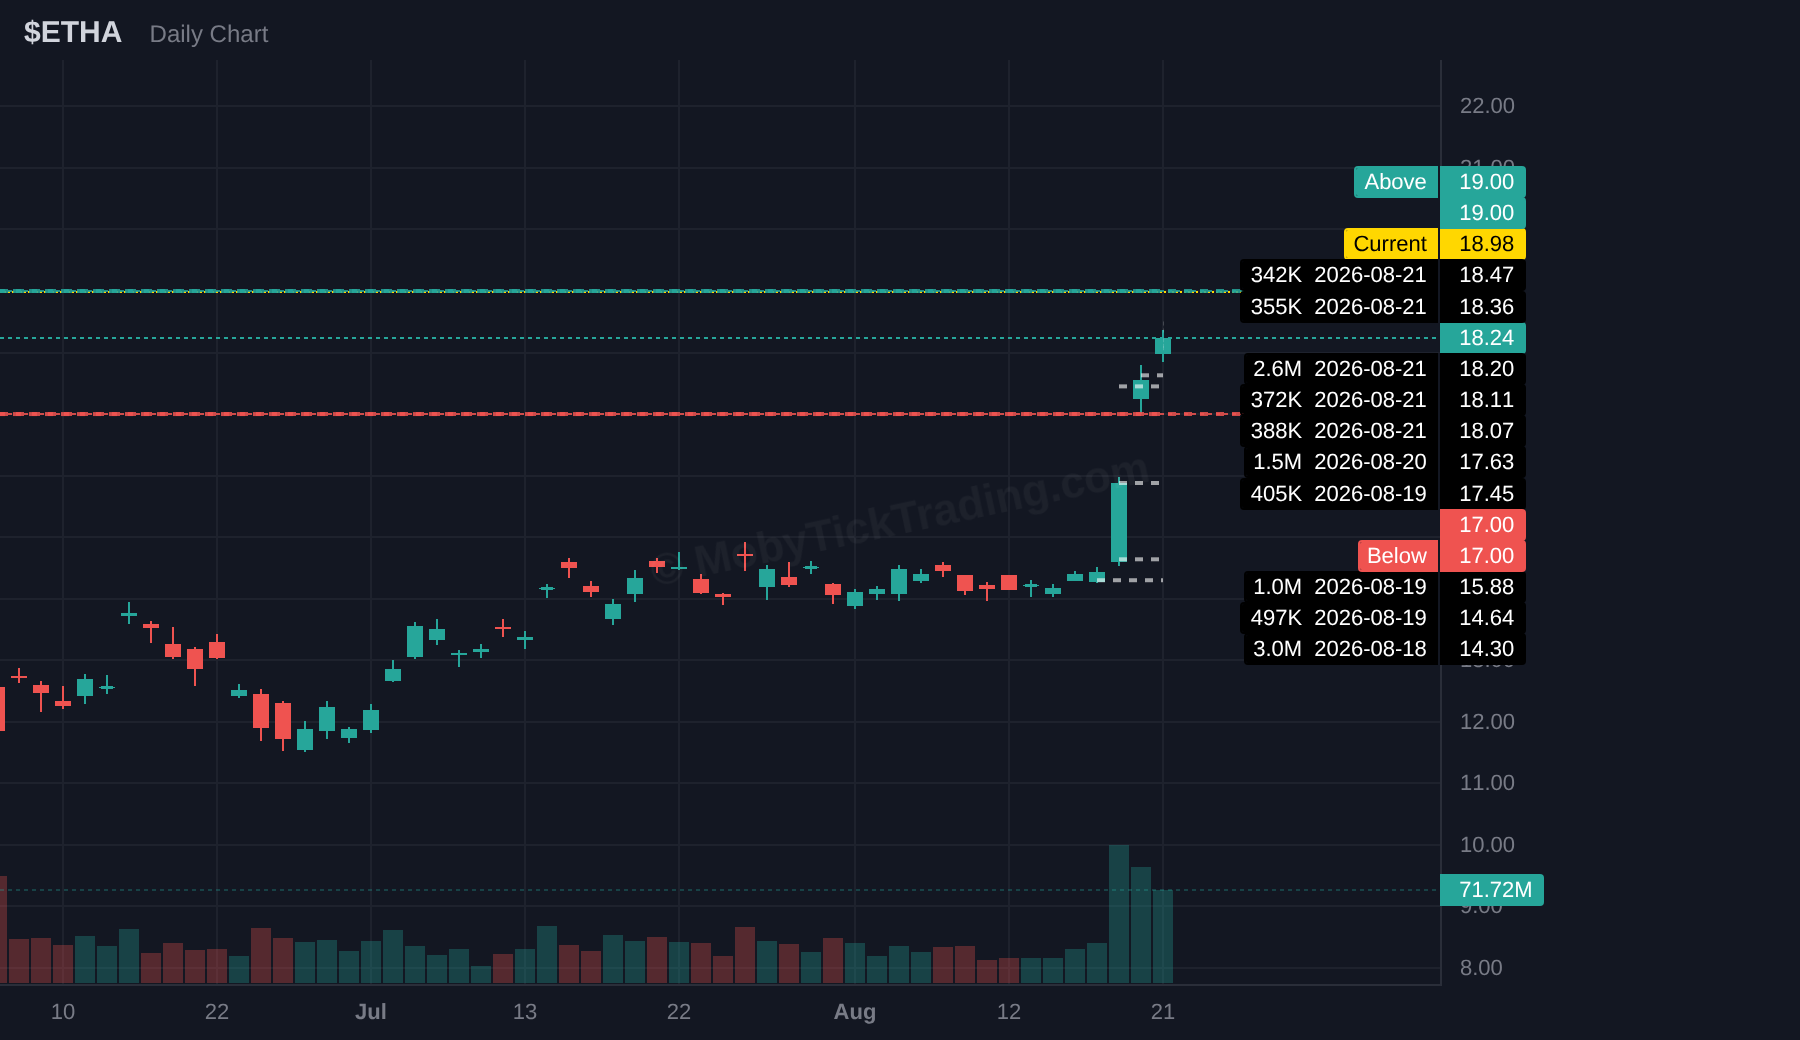
| ETHA | $19.00 | $19.75 → $20.00 → $21.00 → $22.00 → $22.50 → $25.00 |
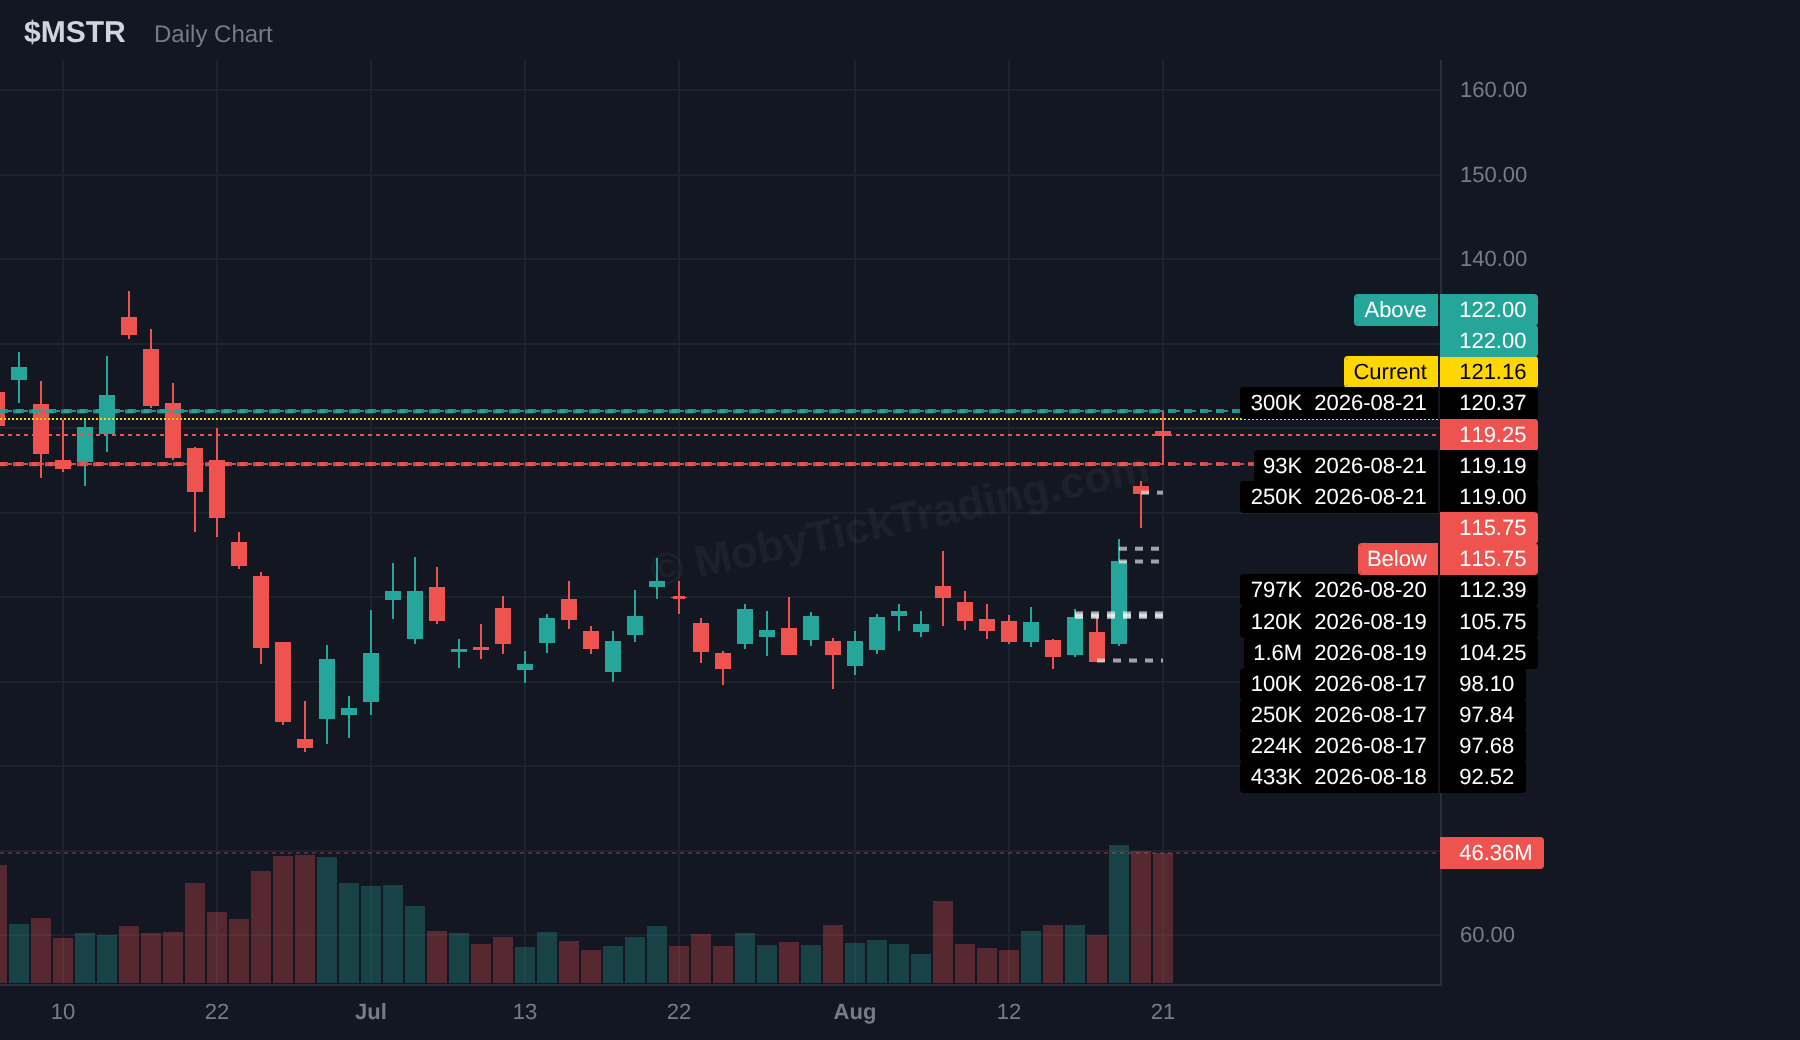
| MSTR | $122.00 | $125.00 → $127.50 → $130.00 → $135.00 → $140.00 |
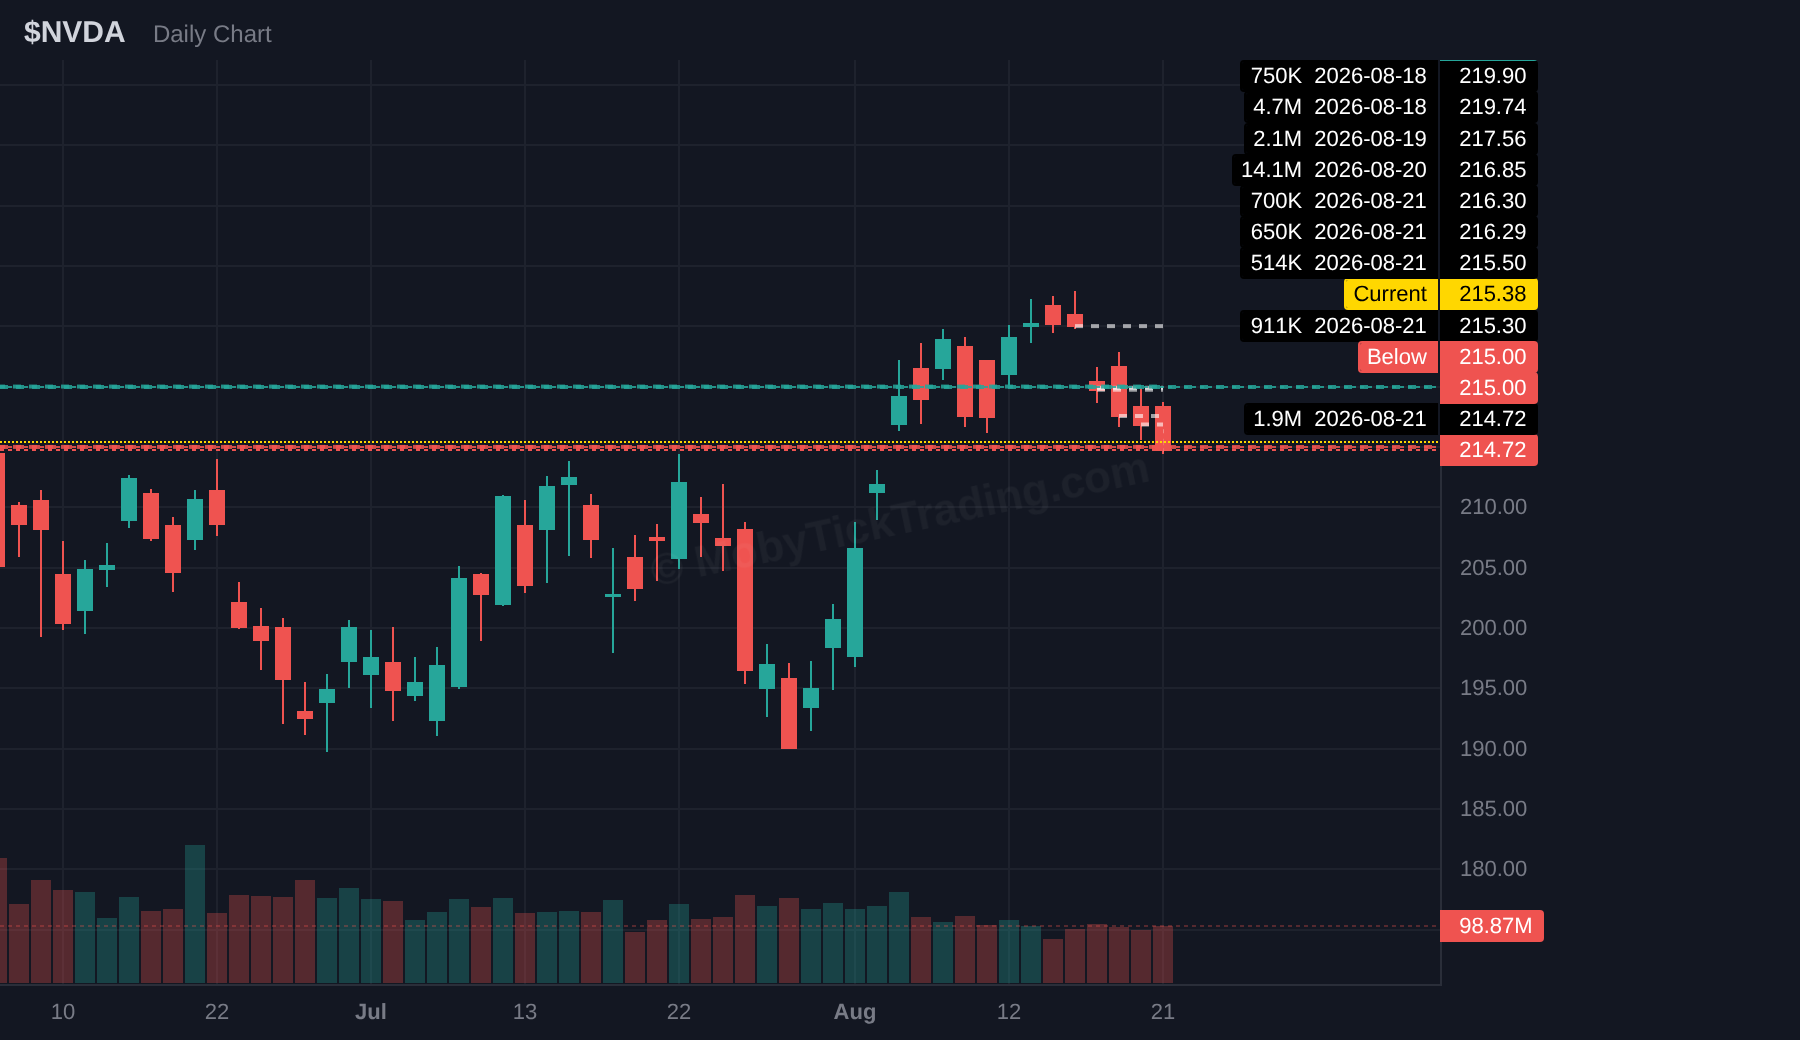
| NVDA | $220.00 | $222.50 → $225.00 → $227.50 → $230.00 → $235.00 → $240.00 |
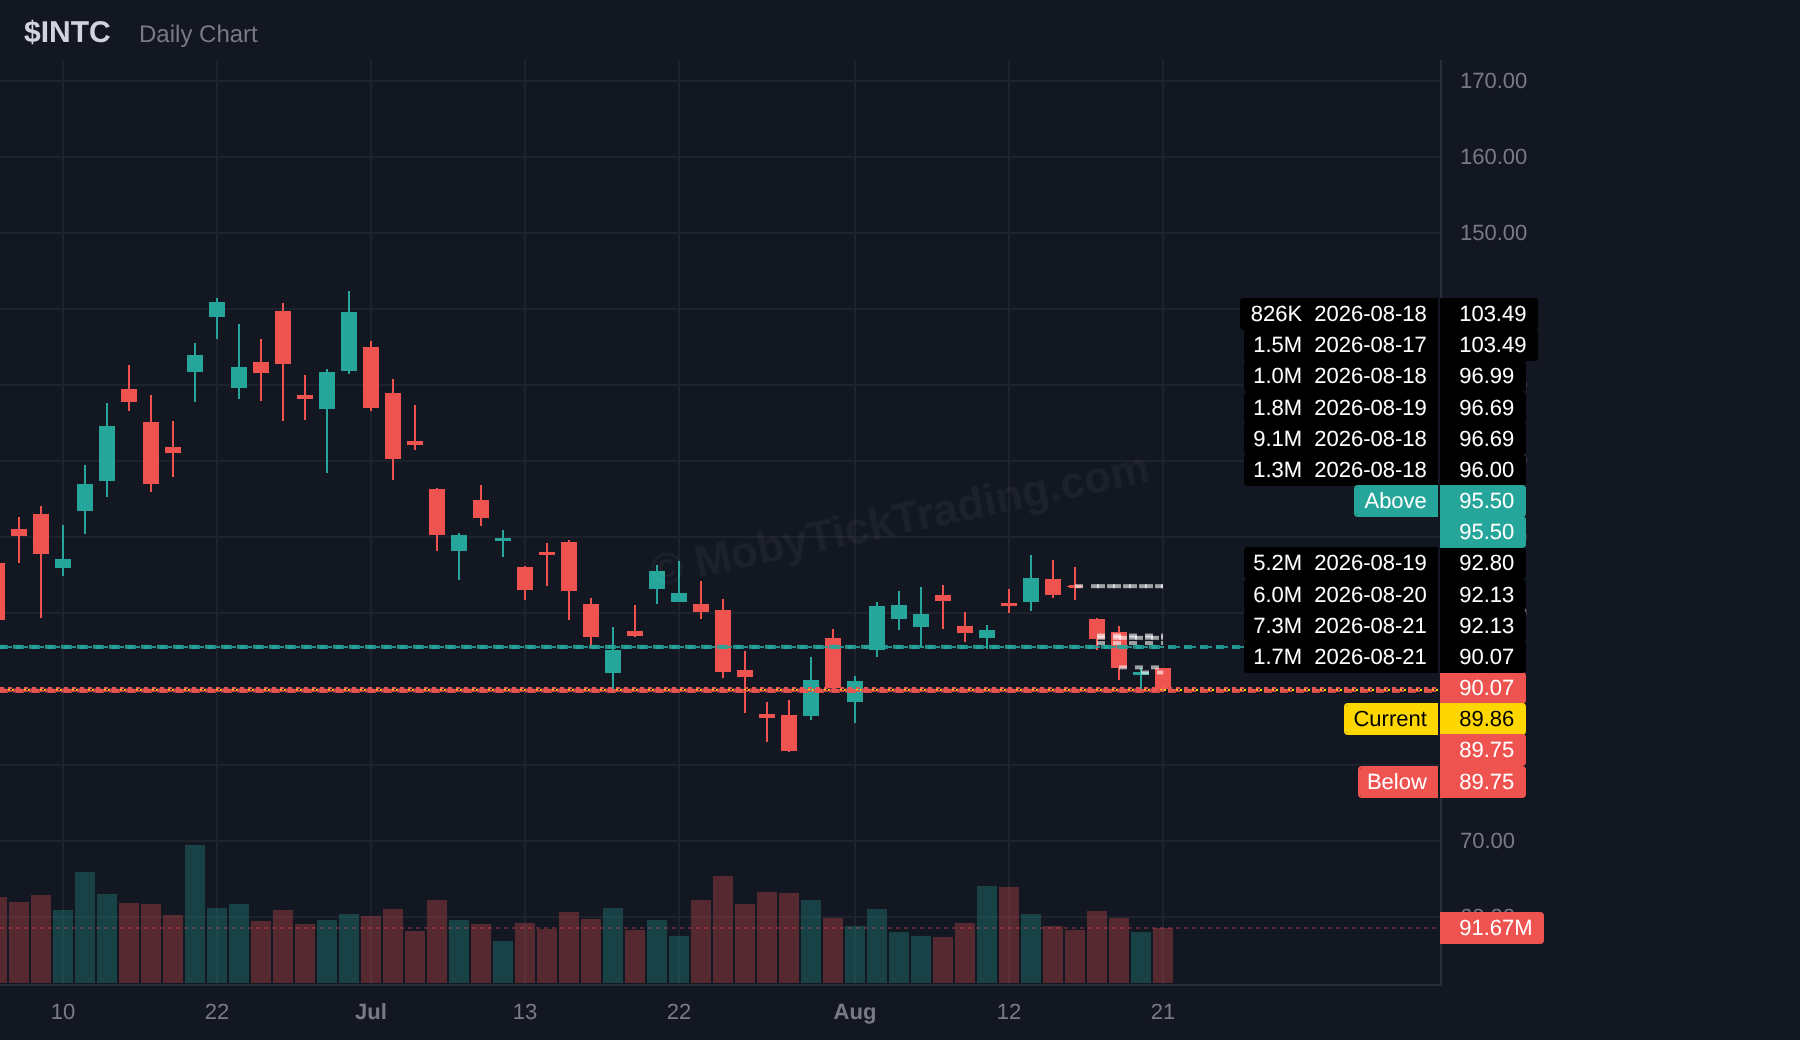
| INTC | $95.50 | $97.50 → $100 → $105 → $107.5 → $110 → $112.5 → $115 |
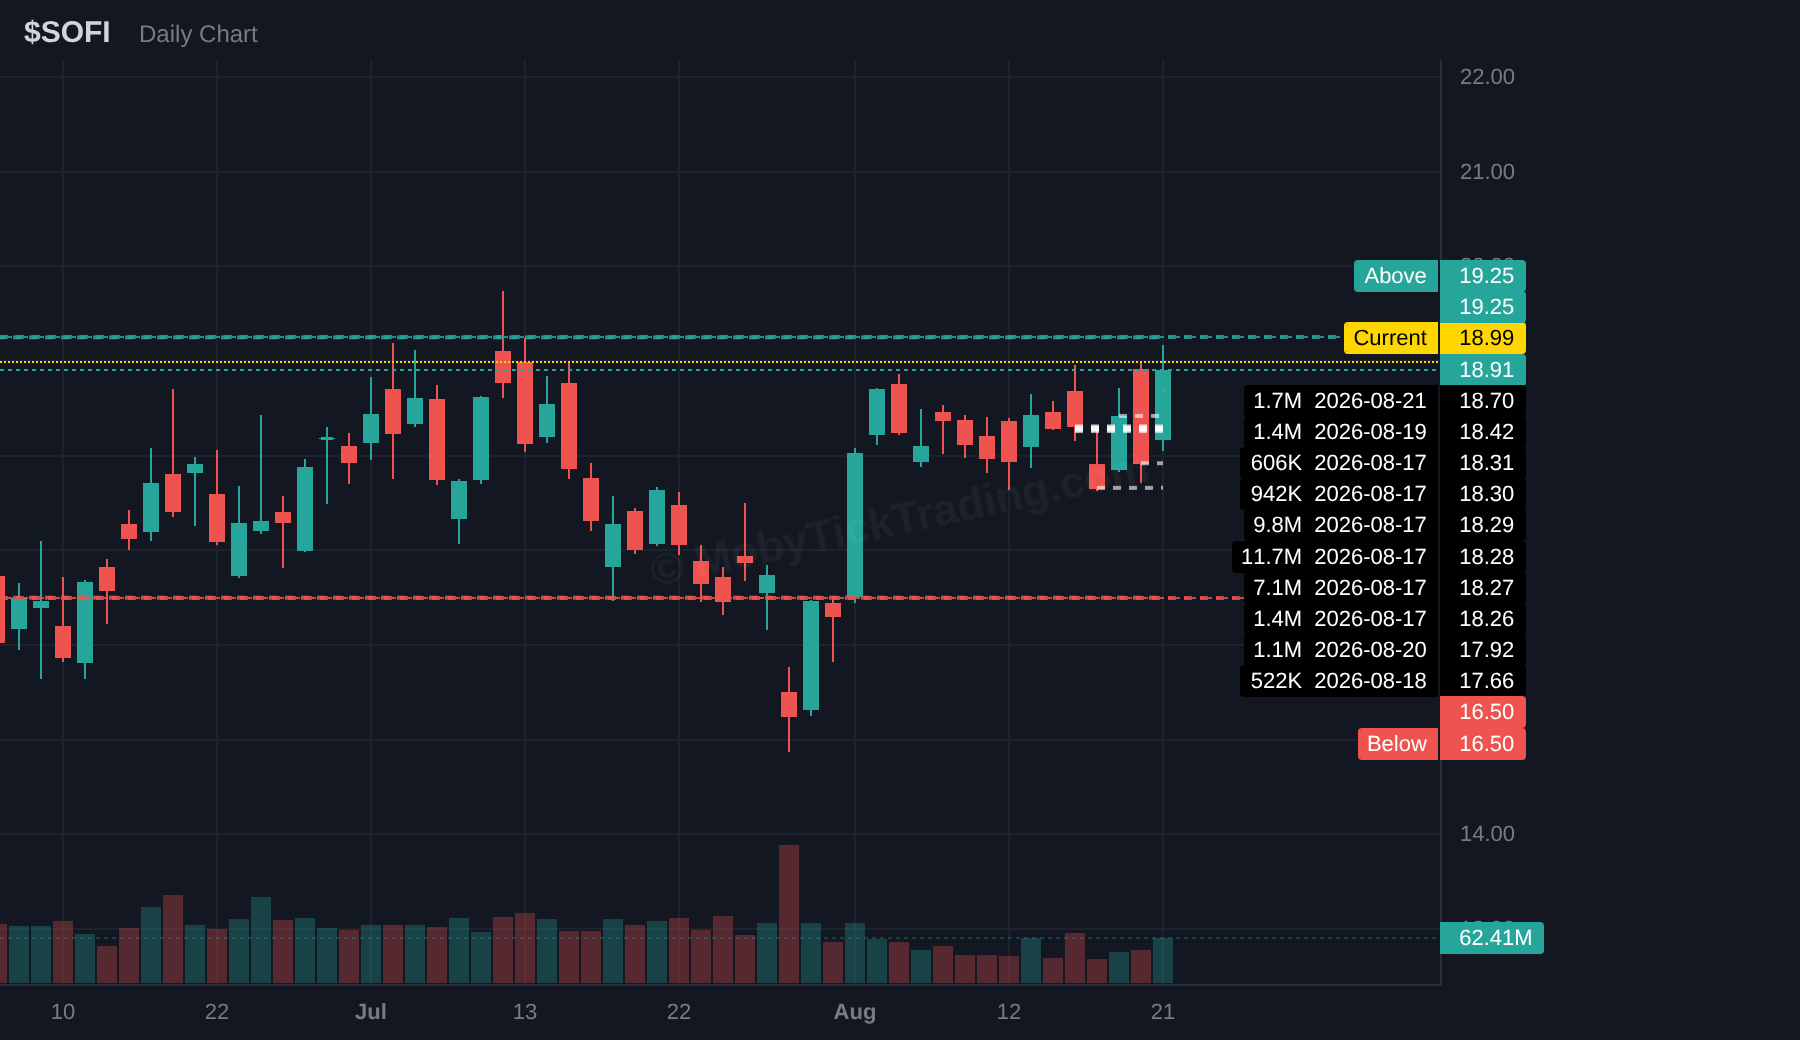
| SOFI | $19.25 | $20 → $21.50 → $22 → $24.25 → $25 → $26 |
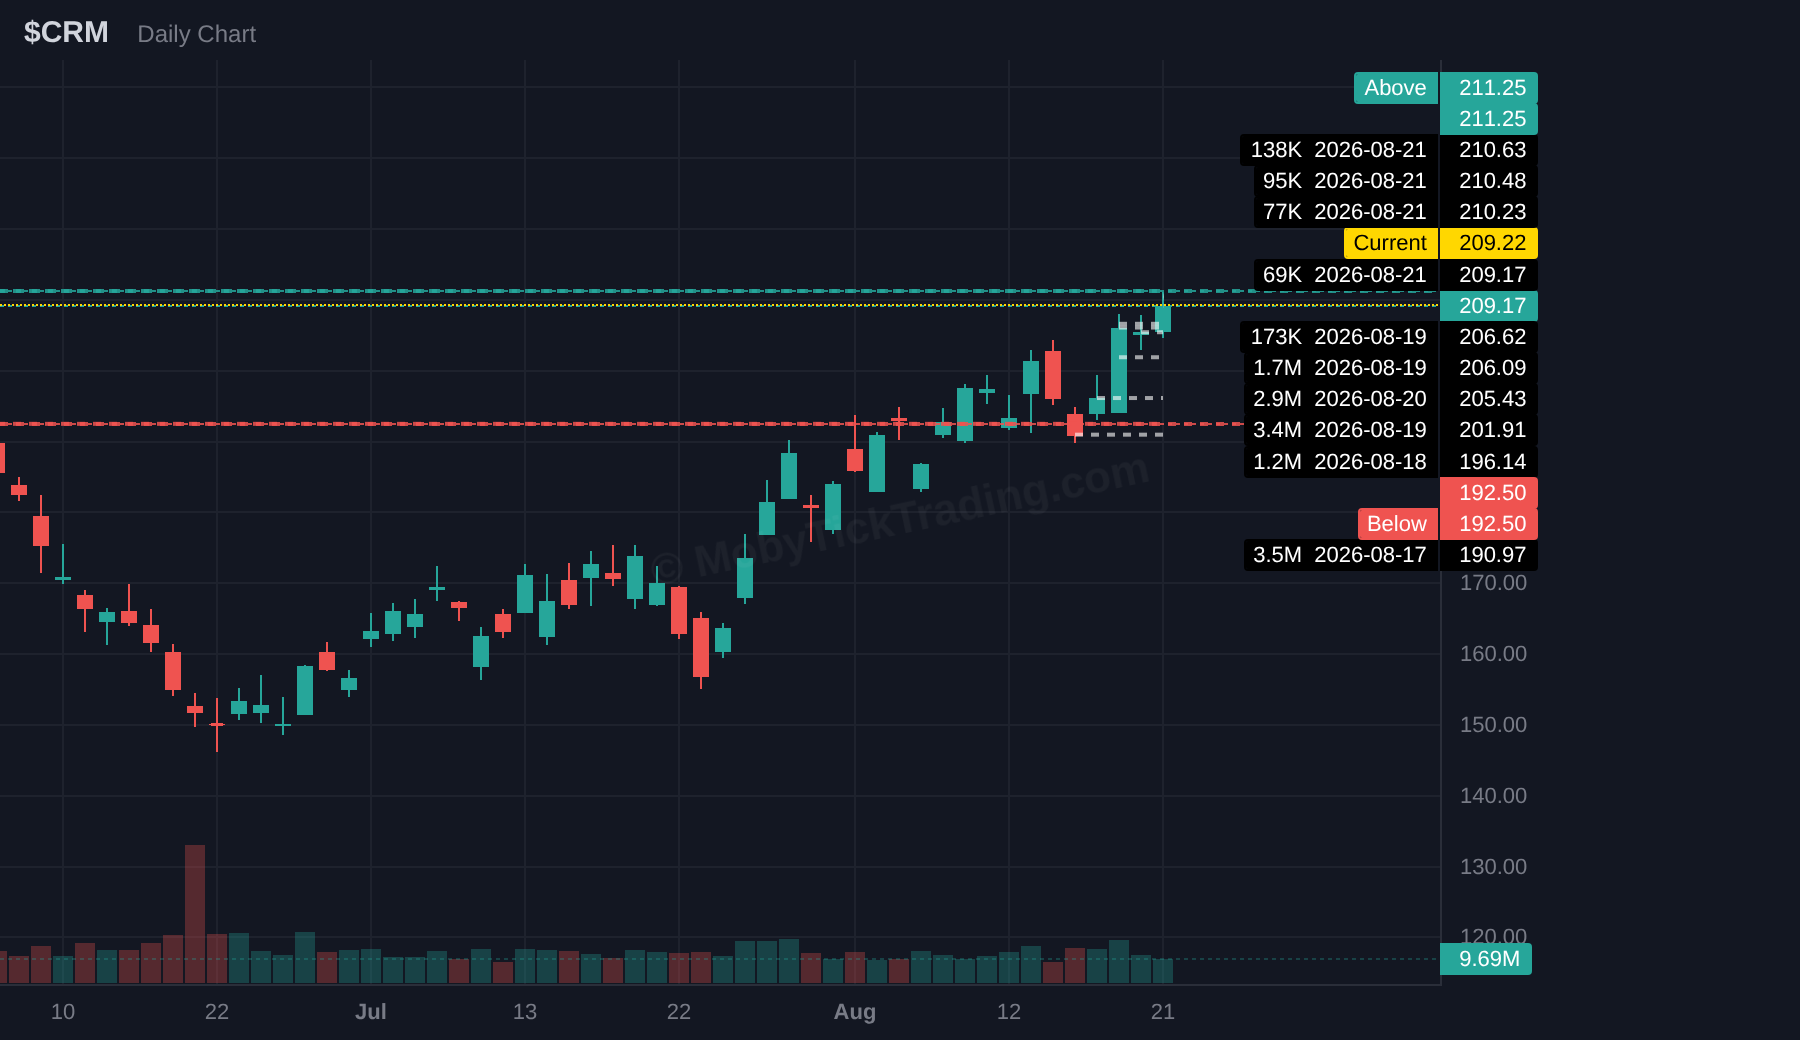
| CRM | $211.25 | $215 → $219 → $225 → $229 |
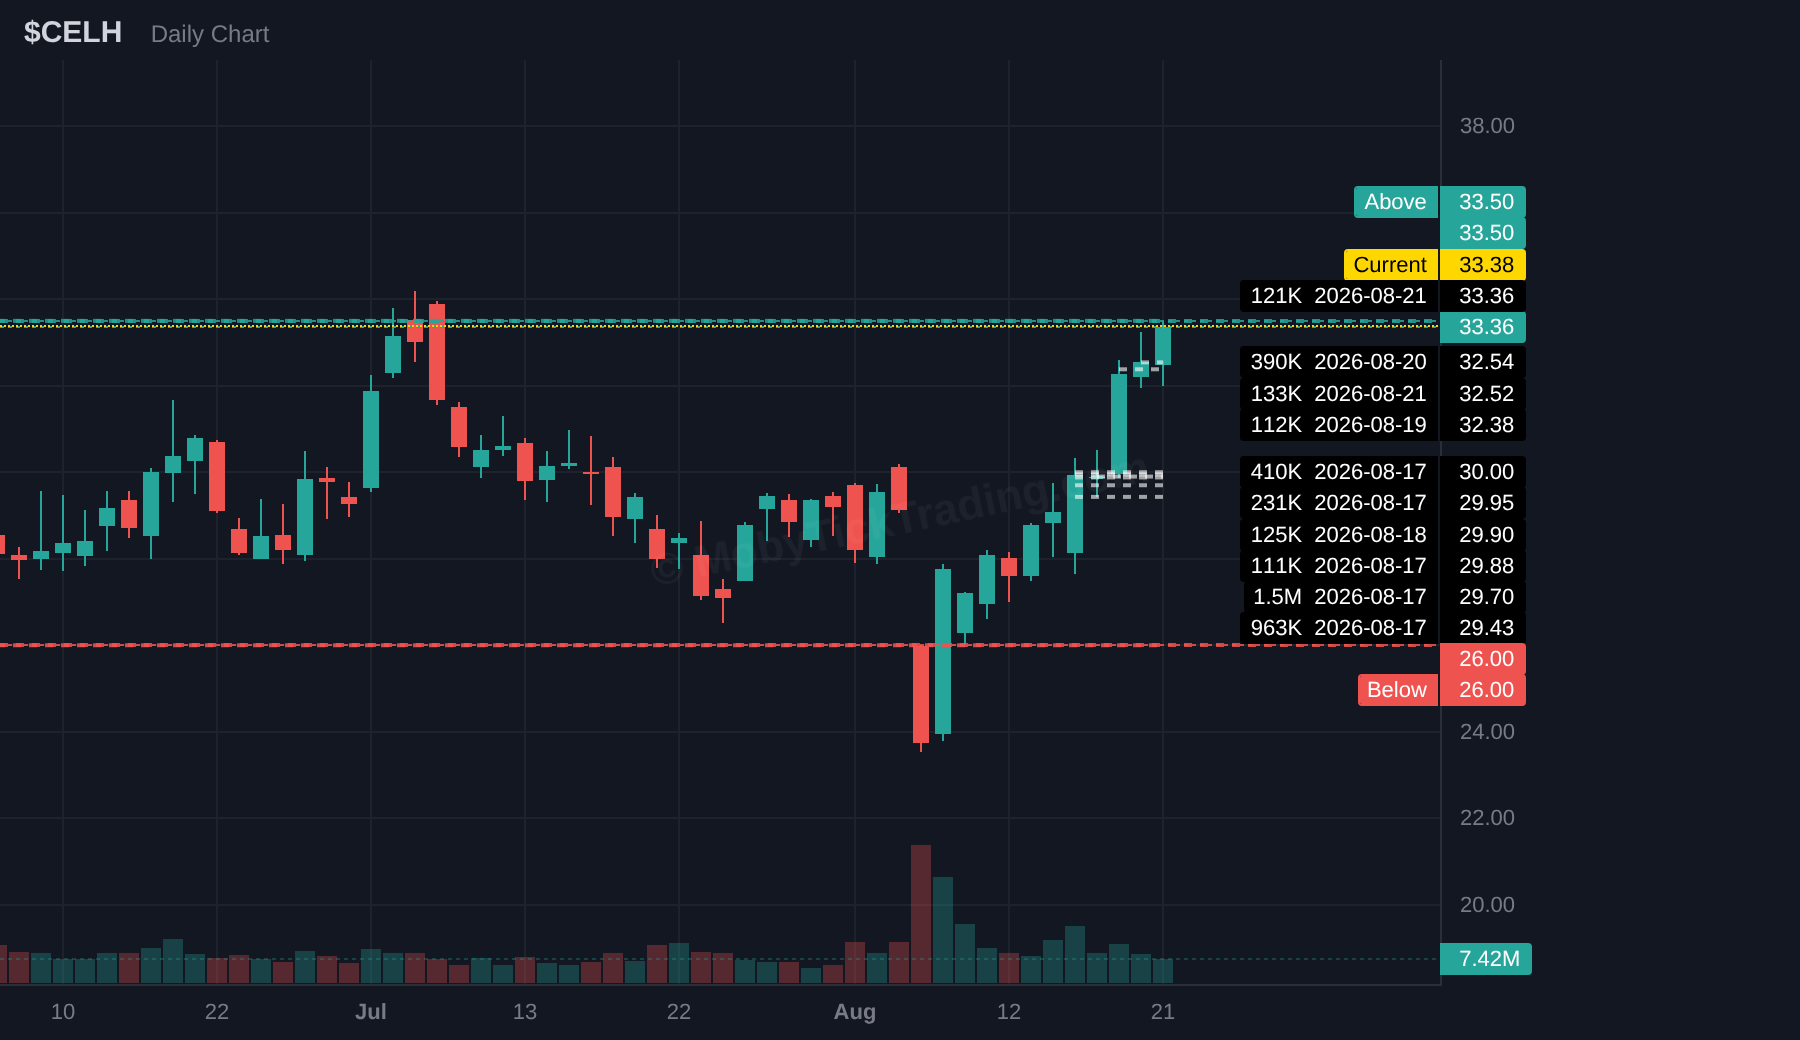
| CELH | $33.5 | $35 → $36.25 → $37.5 → $38.25 → $40 |
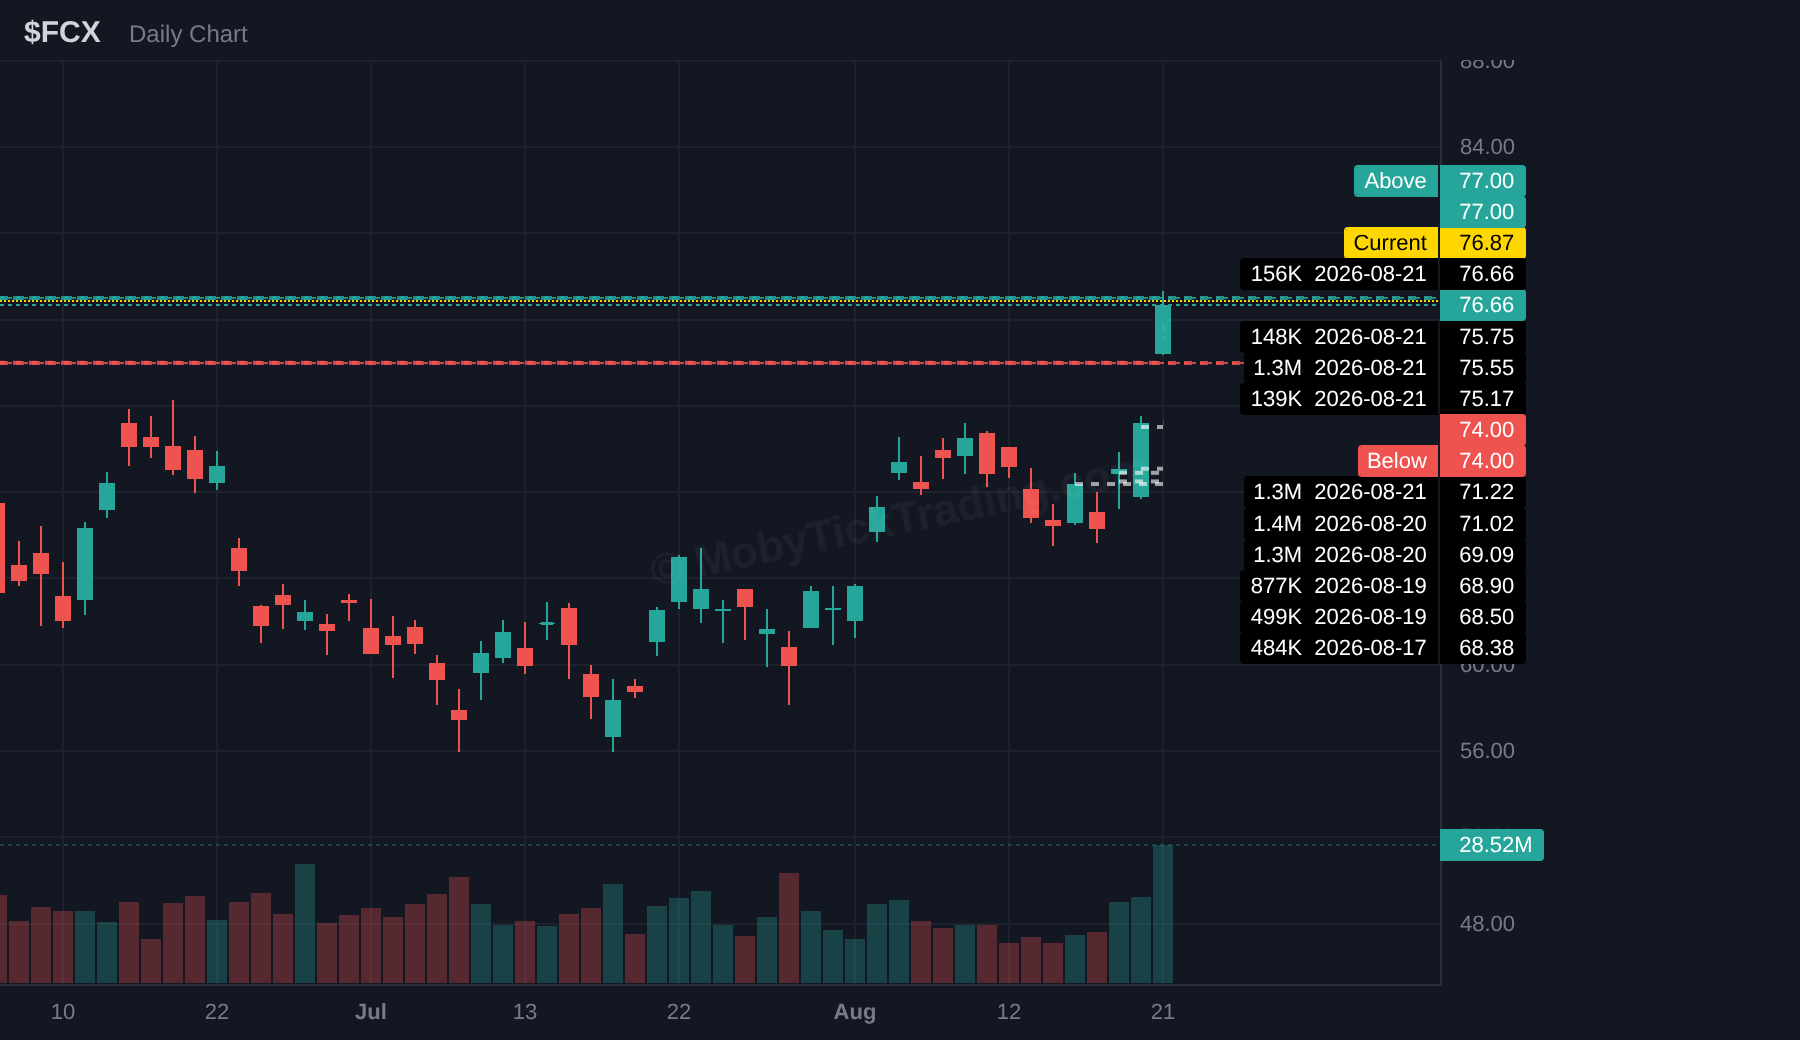
| FCX | $77 | $80 → $81.25 → $82.5 → $85 → $87.5 → $90 |
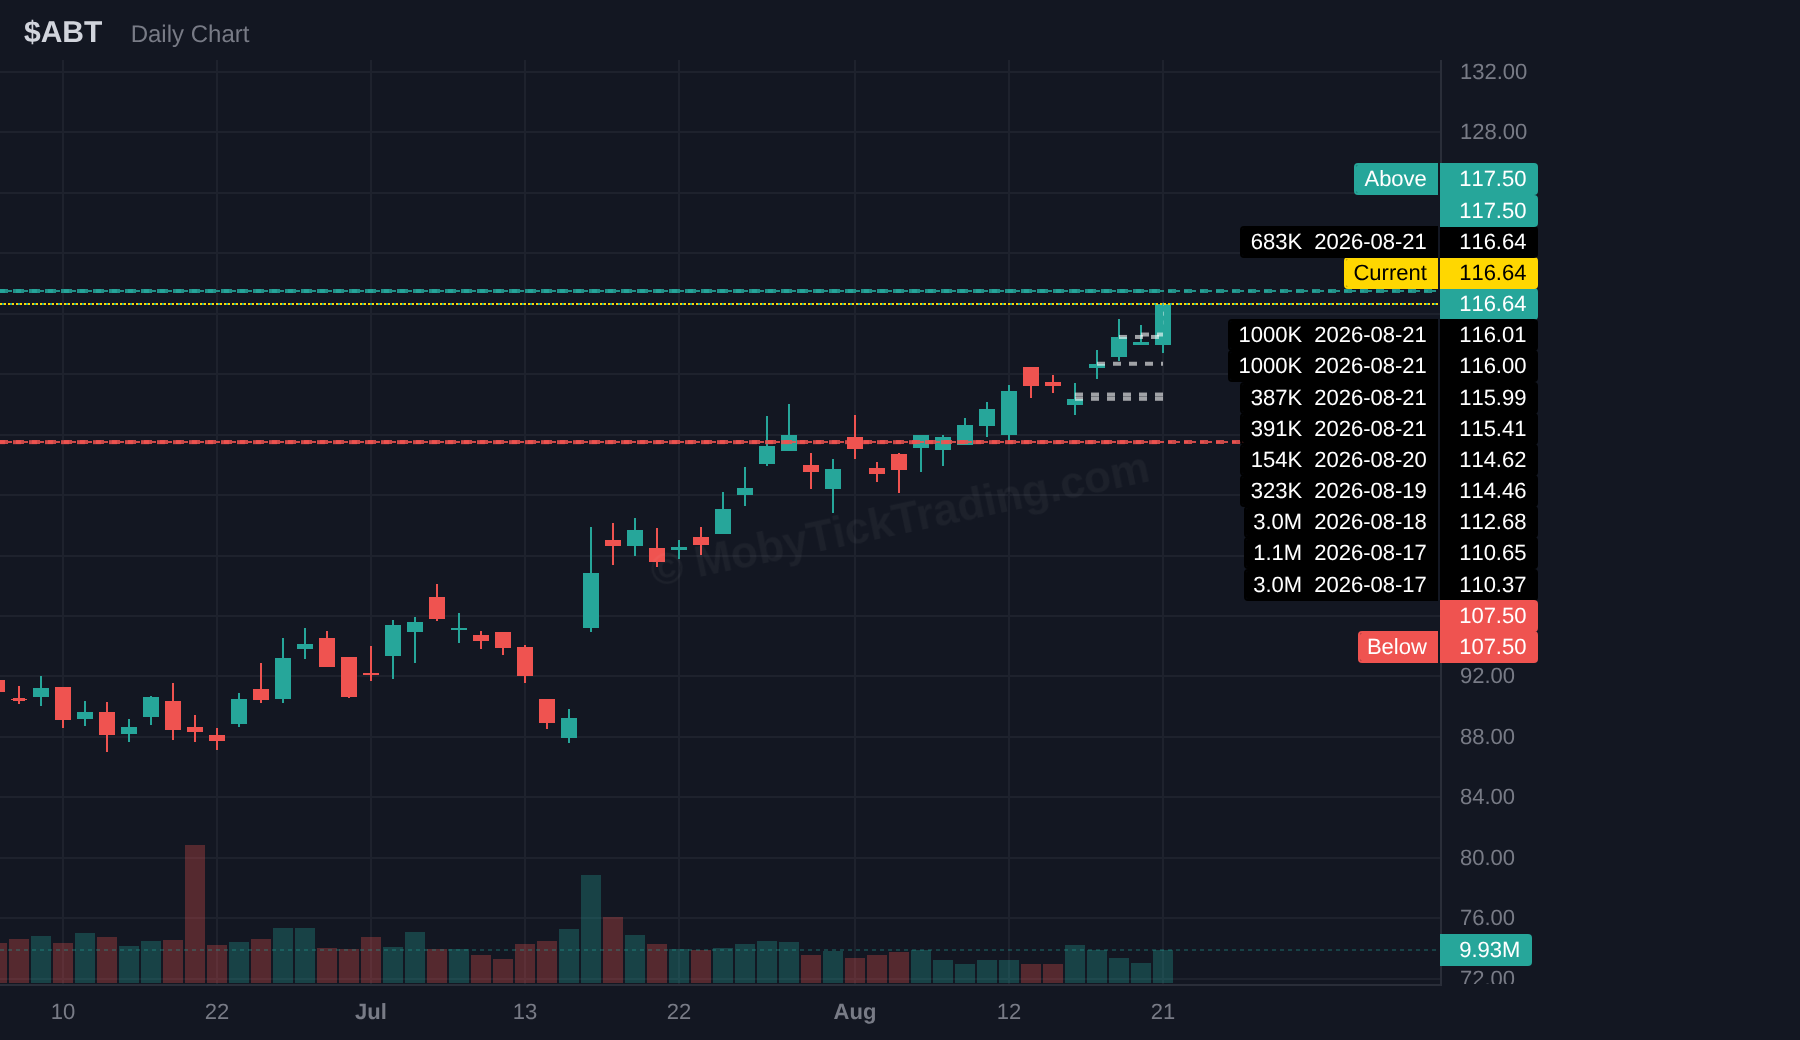
| ABT | $117.5 | $120 → $122.5 → $125 → $127.5 → $130 |
| Ticker | Below Trigger | Targets |
|---|---|---|
| SPY | $757.50 | $750.00 → $746.50 → $740.00 → $735.00 → $730.00 |
| QQQ | $707.50 | $700.00 → $692.50 → $687.50 → $680.00 → $675.00 → $670.00 |
| IWM | $296.00 | $294.00 → $293.00 → $292.00 → $290.00 → $287.50 → $285.00 |
| IBIT | $42.75 | $42.00 → $41.25 → $41.00 → $39.00 → $38.00 → $37.00 |
| ETHA | $17.00 | $16.12 → $15.88 → $15.50 → $15.00 → $14.62 |
| MSTR | $115.75 | $112.50 → $110.00 → $106.25 → $105.00 |
| NVDA | $215.00 | $212.50 → $210.00 → $207.50 |
| INTC | $89.75 | $86.50 → $85 → $82.50 → $80 → $75 → $72.50 |
| SOFI | $16.5 | $15 → $14 → $13.50 → $13 → $12.5 → $12 |
| CRM | $192.50 | $190 → $187.5 → $180 → $175 → $172.50 → $170 → $160 |
| CELH | $26 | $25 → $24 → $22 → $20 |
| FCX | $74 | $72.5 → $70 |
| ABT | $107.5 | $105 → $102.5 → $100 → $87.5 → $85 → $82.5 → $80 |
Each card below shows the dark pool flow data for the past week, along with the key trigger levels and profit targets for the upcoming week. Dark pool stats are sourced from MobyTick’s proprietary analytics.
Above $772.50 → $775.00 → $777.50 → $780.00 → $787.50 → $790.00 → $800.00
Below $757.50 → $750.00 → $746.50 → $740.00 → $735.00 → $730.00
Above $721.25 → $725.00 → $730.00 → $735.00 → $740.00 → $750.00 → $760.00
Below $707.50 → $700.00 → $692.50 → $687.50 → $680.00 → $675.00 → $670.00
Above $302.00 → $305.00 → $307.50 → $310.00 → $311.25 → $312.50 → $315.00
Below $296.00 → $294.00 → $293.00 → $292.00 → $290.00 → $287.50 → $285.00
Above $45.00 → $46.00 → $46.37 → $48.50 → $50.00 → $52.50 → $55.00 → $60.00
Below $42.75 → $42.00 → $41.25 → $41.00 → $39.00 → $38.00 → $37.00
Above $19.00 → $19.75 → $20.00 → $21.00 → $22.00 → $22.50 → $25.00
Below $17.00 → $16.12 → $15.88 → $15.50 → $15.00 → $14.62
Above $122.00 → $125.00 → $127.50 → $130.00 → $135.00 → $140.00
Below $115.75 → $112.50 → $110.00 → $106.25 → $105.00
Above $220.00 → $222.50 → $225.00 → $227.50 → $230.00 → $235.00 → $240.00
Below $215.00 → $212.50 → $210.00 → $207.50
Above $95.50 → $97.50 → $100 → $105 → $107.5 → $110 → $112.5 → $115
Below $89.75 → $86.50 → $85 → $82.50 → $80 → $75 → $72.50
Above $19.25 → $20 → $21.50 → $22 → $24.25 → $25 → $26
Below $16.5 → $15 → $14 → $13.50 → $13 → $12.5 → $12
Above $211.25 → $215 → $219 → $225 → $229
Below $192.50 → $190 → $187.5 → $180 → $175 → $172.50 → $170 → $160
Above $33.5 → $35 → $36.25 → $37.5 → $38.25 → $40
Below $26 → $25 → $24 → $22 → $20
Above $77 → $80 → $81.25 → $82.5 → $85 → $87.5 → $90
Below $74 → $72.5 → $70
Above $117.5 → $120 → $122.5 → $125 → $127.5 → $130
Below $107.5 → $105 → $102.5 → $100 → $87.5 → $85 → $82.5 → $80
Dark pool ETF activity was again concentrated at the index level, but this week the broad-market total swelled while sector participation thinned to a sliver. Broad-market funds printed roughly $34.33B in non-closing prints of $400K or larger, against $4.29B across the entire sector-ETF complex — a gap of about 8-to-1.
Three of the five largest broad-market funds each cleared $9B: VOO led at $9.96B (14.14M shares, 11 prints), IVV followed at $9.74B (12.67M shares, 6 prints), and SPY printed $8.97B (11.68M shares, 12 prints). QQQ added $4.30B (6.01M shares, 12 prints) and IWM $1.35B (4.53M shares, 5 prints). The week’s broad-market flow was heavily weighted to the S&P 500 wrappers, even as the underlying index finished lower.
Sector-ETF flow was thin and lopsided. XLF (Financials) led the group at $1.85B on 32.03M shares across 14 prints — the only sector fund to clear $1B. The next tier was XLV (Health Care) at $569.0M on just two prints (3.25M shares), followed by XLE (Energy) at $424.1M (6.67M shares, 8 prints), XLI (Industrials) at $393.7M (2.15M shares, 4 prints), and XLC (Communication Services) at $377.0M (3.37M shares, 3 prints). XLB (Materials) was the lightest at $57.6M on a single print.
Two sector readings line up with the week’s price action rather than against it. Health Care was the strongest sector on the week (XLV +4.91%, with the biotech trackers XBI +5.67% and IBB +7.70% on the Moderna news), and its sector fund drew the second-largest total — $569.0M — on only two prints. Energy, another of the week’s relative winners (XLE +2.29%), drew $424.1M across eight prints. Flow tracked the leaders.
The disconnect was on the downside. Technology was the week’s worst sector (XLK −3.92%, with semiconductors SMH −5.61% and SOXX −6.79%), yet the sector fund itself drew only $165.4M across two prints — among the lightest in the group. The tech selloff did not express itself as sector-ETF distribution; it showed up in the single-name tape instead, where NVDA, INTC, MSFT, and AMAT carried the heaviest individual dark pool flow of the week.
Net of it: index products absorbed nearly all of the week’s size, sector products remained a rounding error, and the two sectors with the clearest stories — health care’s biotech run and technology’s pullback — showed the sharpest contrast between where sector-ETF flow went and where it didn’t.
*Data sourced from MobyTick*

Three weeks ago in the “Building Smart Money Watchlists” webinar, I opened with a single trade: 29,212,864 shares of IBIT at $43.16 on May 26. About $1.26 billion, executed as an intermarket sweep and reported only after it was filled. Nothing on the chart marked it. Price dropped roughly 25% over the next eight trading days.
This week IBIT traded back through it.
Same number. Other side. Nobody had to draw a new line.
And here’s what I didn’t mention in the webinar, because I was focused on the size of that one trade: it wasn’t one trade. A month earlier, on April 28, another 1.2 million shares printed at $43.12. Two prints, four cents apart, four weeks apart, totalling more than thirty million shares. That’s not a level someone stumbled into. That’s a level someone built.
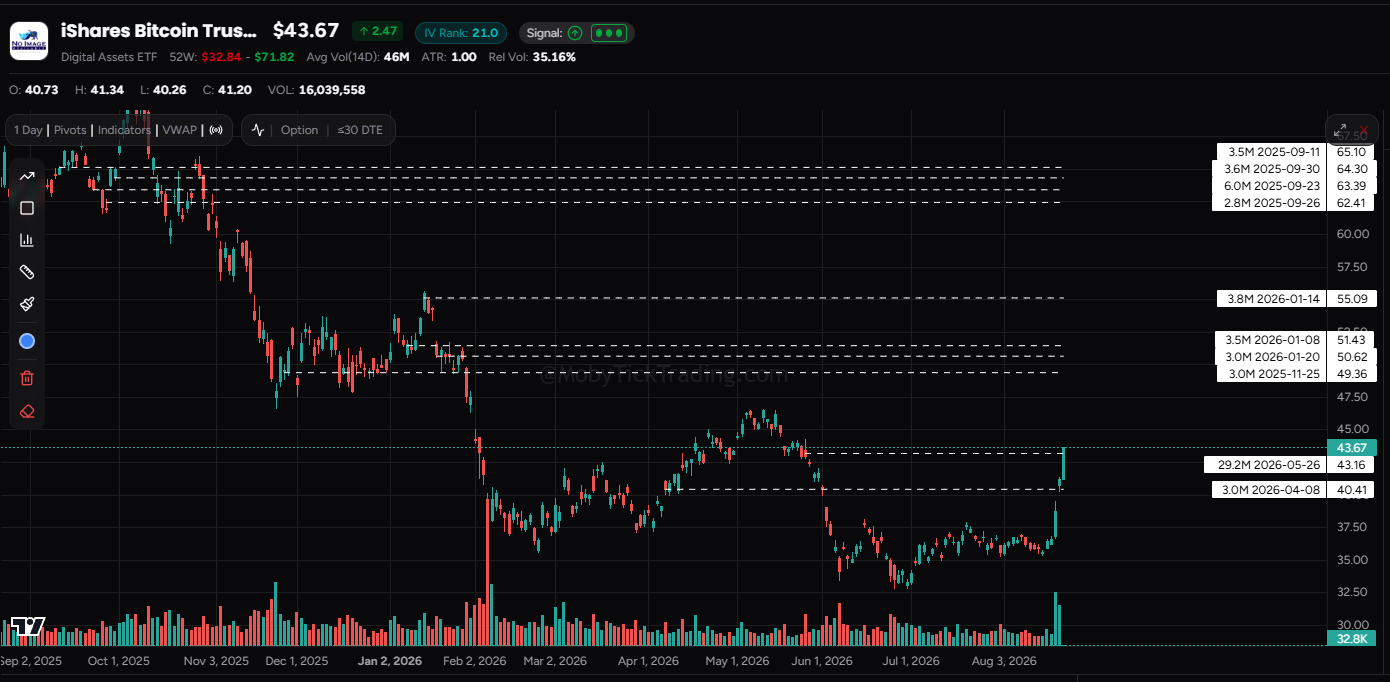
*IBIT, one year. The 29.2M print at $43.16 and the next institutional band at $49.36 — with nothing in between.*
The interesting part isn’t the round trip — it’s what the tape recorded while the chart looked dead.
From June through mid-August, IBIT built a shelf between roughly $33.50 and $37.35, and every step of it printed:
| Date | Shares | Price |
|---|---|---|
| Jun 3 | 1.0M | $37.23 |
| Jun 9 | 2.1M | $35.00 |
| Jun 12 | 1.0M | $36.09 |
| Jun 26 | 1.8M | $33.68 |
| Jun 29 | 2.4M | $33.50 |
| Jul 17 | 1.1M | $35.86 |
| Jul 22 | 2.2M | $37.34 |
| Aug 3 | 1.1M | $36.15 |
| Aug 17 | 1.9M | $36.38 |
Note that the shelf wasn’t new. There was already 1.4 million shares sitting at $36.67 from February 23 — a six-month-old print that the entire summer range built itself around.
Put those levels on the chart and ten weeks of chop stops looking like nothing happening. It looks like size showing up repeatedly in a four-dollar band. Nobody was calling a bottom. Nobody needed to.
That last entry deserves its own line. August 17: 1,916,134 shares at $36.38, intermarket sweep, printed above the ask. The SEC’s proposed crypto framework landed on the 19th. Treasury doubled long-dated buybacks the same day.
If you only study one chart this week, make it this one.
ETHA spent three weeks defending a band between $14.09 and $14.56, and it defended it repeatedly:
| Date | Shares | Price |
|---|---|---|
| Jul 21 | 2.0M | $14.52 |
| Jul 22 | 2.0M | $14.56 |
| Aug 3 | 1.0M | $14.09 |
| Aug 3 | 3.0M | $14.14 |
| Aug 7 | 2.0M | $14.52 |
| Aug 18 | 3.0M | $14.30 |
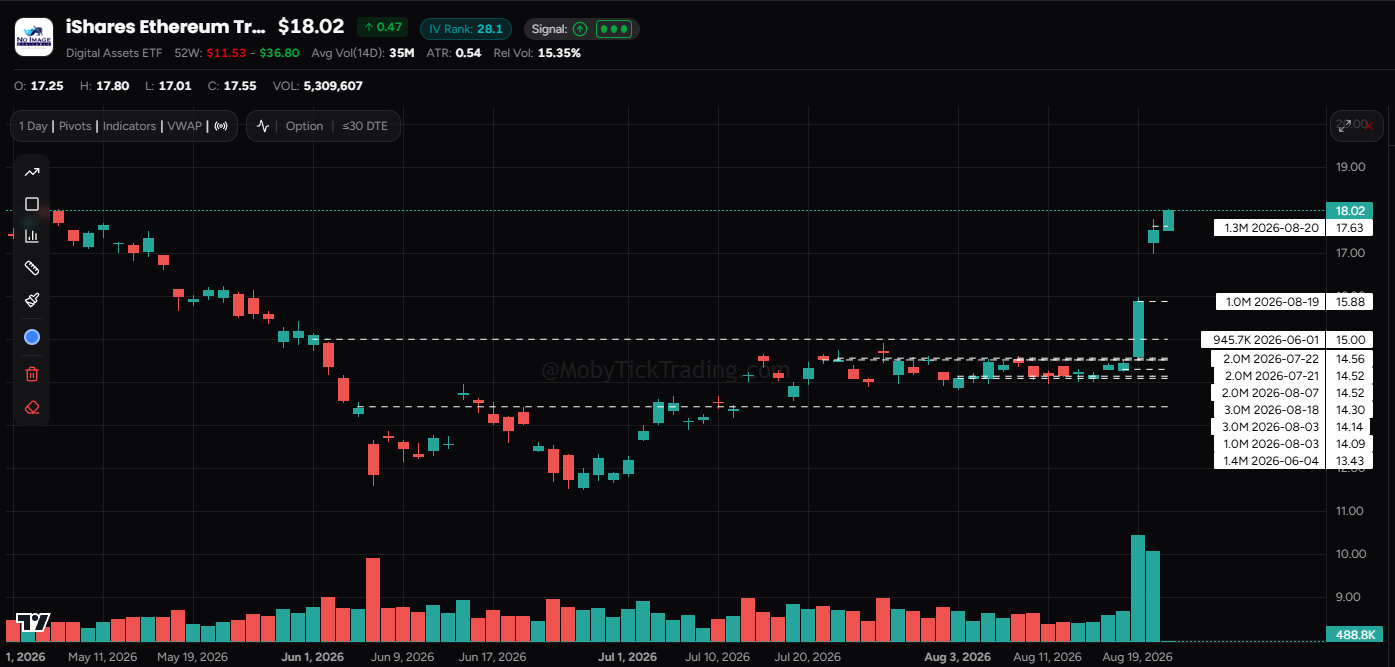
*ETHA. Thirteen million shares defended a 47-cent band — the last three million the day before the news.*
Look at $14.52 — printed twice, two million shares each time, seventeen days apart. Roughly thirteen million shares across a forty-seven cent band, and the last three million of it landed on August 18, the day before the news.
Then the part that makes this worth learning. The only print standing above that shelf was 945,700 shares at $15.00 from June 1. Price cleared it on the 19th, and above $15.00 there was nothing — no institutional structure at all until $18.13.
ETHA ran the gap and stopped at $18.02.
That ETHA move isn’t a coincidence. It’s the most useful structural read in this whole dataset, and it shows up in three names at once.
Prints cluster where institutions work. Between clusters, there’s empty space — price ranges where nobody large transacted. When price breaks a cluster and enters that space, there’s nothing to slow it down until it reaches the next one. Fast moves aren’t random. They happen in the gaps.
Right now:
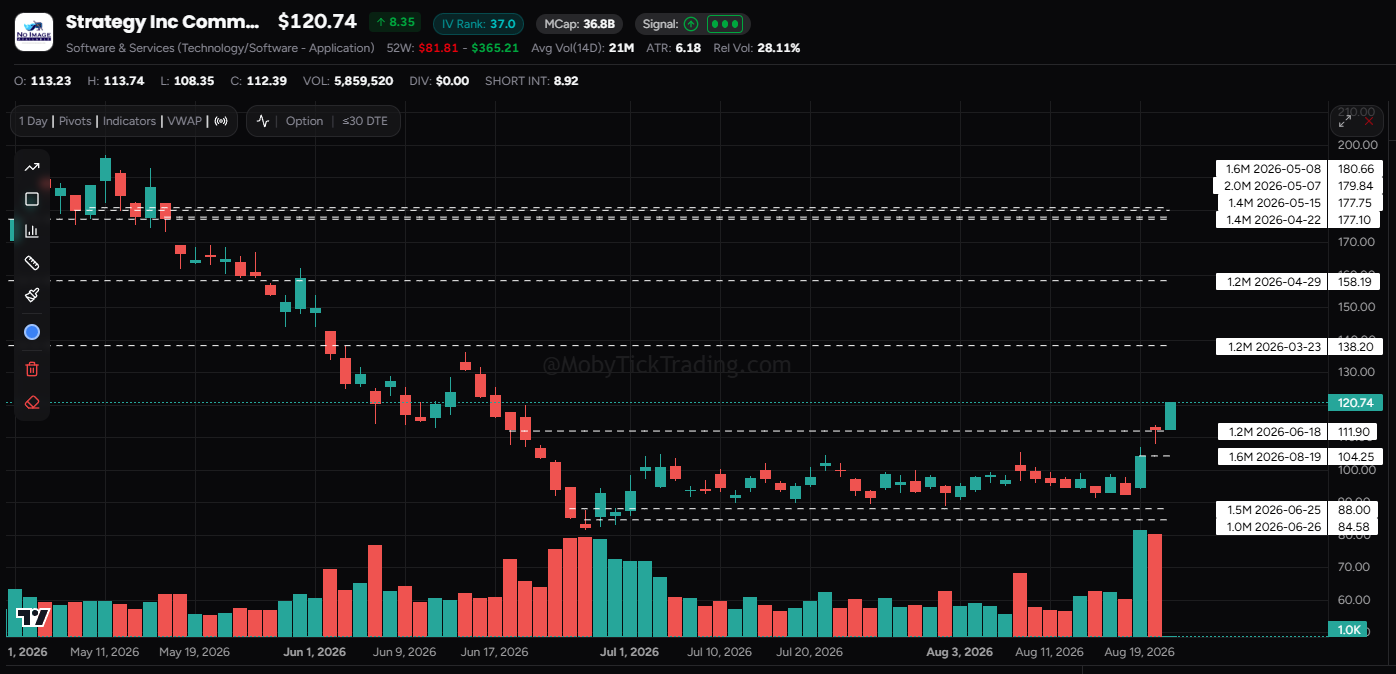
*MSTR cleared 1.2M shares at $111.90 from June 18. The next print above it is $138.20, from March.*
This cuts both ways, and I want to be clear about that. Thin structure means less resistance going up — and nothing to catch price if it turns. An air pocket is a fast elevator in both directions.
Here’s where the easy version of this article (“the whales knew”) falls apart.
The miners were not being accumulated into the news. MARA printed a million shares at $11.55 on August 5 and then stepped steadily down: $10.65, $10.00, $9.68, $9.62, $9.56, $9.21, and 370,600 shares at $8.96 on August 18. CLSK opened August printing between $14.17 and $14.55 and was down at $11.11 by the 19th. That’s size transacting at progressively worse prices right up to the day before the move. Nobody there had a crystal ball.
But look at where the selling stopped.
MARA’s August low sits directly on two old prints — 1.6 million shares at $8.92 from March 26, and 1.4 million at $8.72 from April 7. Five-month-old levels. Price fell into them and held. MARA has since reclaimed the 3.5 million share print at $11.21 from July 28 and now trades at $11.76, working into the April cluster at $11.94 and $11.99.
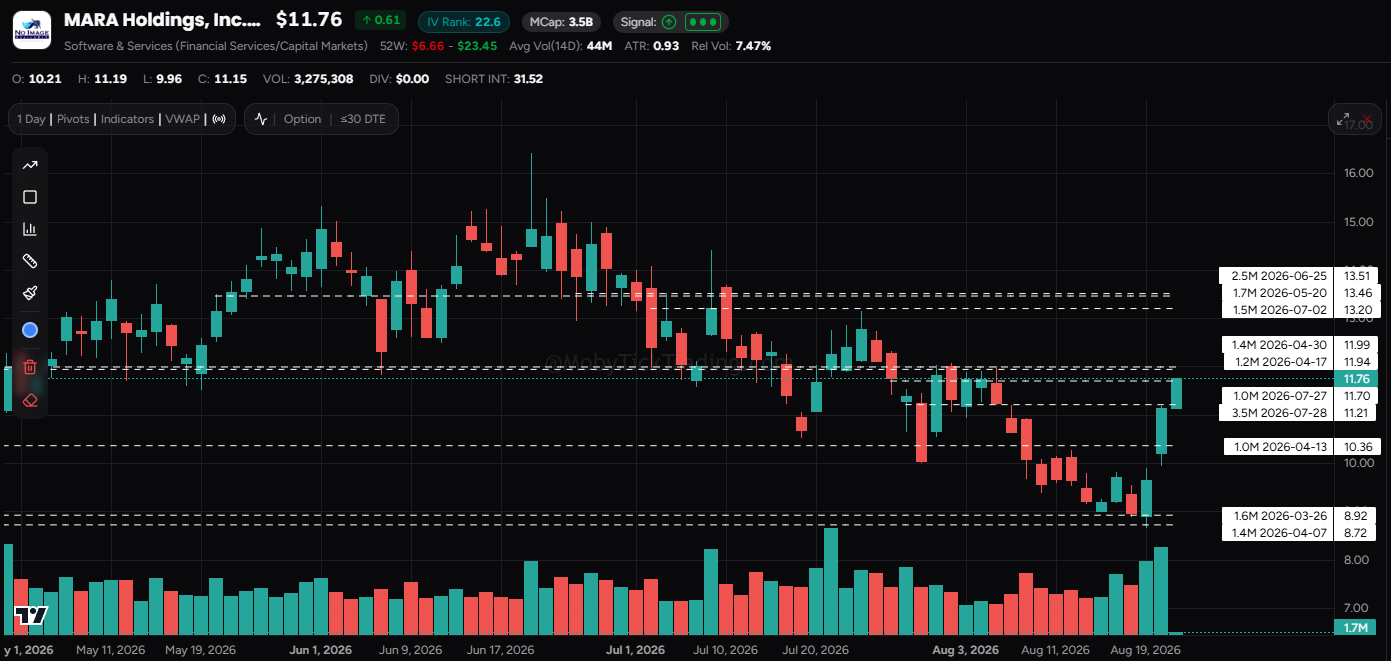
*MARA. The August low landed on prints from March 26 and April 7 — five months old and still defended.*
CLSK did the same thing. Its mid-August low ran into 2.0 million shares at $11.90 and 2.3 million at $12.05, both from mid-April — 4.3 million shares inside a fifteen-cent band. It held, and CLSK is now at $13.18, testing the July cluster at $13.68 to $13.96 from underneath.
So the miners give you the other half of the lesson. Prints aren’t a directional signal. They’re a map of where size lives. Sometimes that map catches a falling knife. In MARA’s case it was drawn in March and still worked in August.
One set of numbers explains a lot of the difference in character this week:
| Short interest | |
|---|---|
| CLSK | 40.3% |
| MARA | 31.5% |
| COIN | 9.9% |
| MSTR | 8.9% |
The miners squeezed. When 40% of a float is short and price runs into a print shelf that refuses to break, you get exactly the candles CLSK printed this week.
COIN and MSTR didn’t squeeze. They broke levels on volume with almost no short interest behind them — COIN clearing 500,000 shares at $176.10 from July 21 to reach $180, MSTR clearing $111.90 to reach $120. Those are cleaner breaks structurally, even though the percentage moves are smaller.
Worth knowing which kind of move you’re in. Bloomberg is reporting the underlying bitcoin rally as short-covering, with futures open interest yet to rebuild after roughly $3 billion in liquidations. A move driven by shorts being forced out can go further than anyone expects and give it back just as fast.
Two more things worth saying plainly:
A print has no direction. The August 17 IBIT sweep hit above the ask, which leans buyer — but every transaction has two sides. A print tells you *size traded here*, not *someone is long here*.
Institutions can be wrong. I said it in the webinar and this week is a good reminder. Whoever was working the miner book in early August was not positioned for what happened on the 19th.
Not prediction. A level and a plan, mapped before the news existed.
If you built your IBIT watchlist entry in late May the way we walked through it — bullish above $43.16, bearish below the shelf — then this week the alert fired and you already knew what you were doing. You didn’t need an opinion on the Clarity Act. You didn’t need to be early on Treasury buyback policy.
You’re not front-running the news. You’re refusing to be surprised by it.
| Ticker | Price | ATR | Level cleared | Next print up | Structural support |
|---|---|---|---|---|---|
| IBIT | $43.67 | $1.00 | $43.12–$43.16 | $49.36 | $41.00, then $36.38 |
| ETHA | $18.02 | $0.54 | $15.00 | at $18.13 now | $14.30–$14.56 |
| COIN | $180.47 | $9.23 | $176.10 | $195.80 | $167.21, $164.28 |
| MSTR | $120.74 | $6.18 | $111.90 | $138.20 | $104.25, then $88.00 |
| MARA | $11.76 | $0.93 | $11.21 | $11.94–$11.99 | $8.92, $8.72 |
| CLSK | $13.18 | $1.16 | $12.70 | $13.68–$13.96 | $12.05, $11.90 |
Run the ATR math yourself: 2.5× the 14-day ATR, added to entry, rounded to the nearest major level — then check whether a print sits in the way. On MSTR, 2.5 × $6.18 is about $15, which lands near $136 — just under that $138.20 print. On IBIT, $2.50 puts you around $46, well inside the gap. That’s the process, not a recommendation.
One discipline note to close on. Bitcoin’s daily RSI is stretched and price arrived at these levels on a squeeze. The criteria exist for exactly this situation: a setup isn’t confirmed because price touched a level. Wait for the close, on increasing volume, with little wick on top. If it doesn’t come, you’ve lost nothing but patience.
> Key Takeaway: Prints aren’t a directional signal — they’re a map of where institutional size lives. The edge isn’t knowing what the news will say; it’s having your levels drawn before the news exists, and letting the tape tell you which side of the map you’re on.
*Prices intraday and moving. Educational purposes only — nothing here is a trade recommendation. Data sourced from MobyTick.*
Get institutional-grade dark pool intelligence delivered to your inbox every week.
Disclaimer: This newsletter is for informational and educational purposes only. It does not constitute financial advice, investment recommendations, or solicitation to buy or sell securities. Trading stocks, ETFs, and options involves substantial risk of loss. Past performance is not indicative of future results.