Physical Address
304 North Cardinal St.
Dorchester Center, MA 02124
Physical Address
304 North Cardinal St.
Dorchester Center, MA 02124

SPY, QQQ, NVDA, AMZN, AAPL, MSFT, INTC, AVGO — institutional dark pool levels and trade setups for the week of Feb 9-13, 2026. Deep dives on INTC accumulation, AMZN post-earnings catch, and NVDA monster print bounce ahead of Feb 25 earnings.
Follow the Money. See What Others Can’t.
This week saw significant institutional activity across the board. The broader market sold off mid-week with SPY dropping from $695 to $677, before bouncing back to $690 on Friday. Dark pool data revealed who was buying the dip — and who was taking profits.
Key events this week: Amazon reported earnings (price dropped from $238 to $210), CIEN announced S&P 500 inclusion (Feb 9), and NVDA continues to see massive institutional flows ahead of Feb 25 earnings.
The focus of these newsletters is to review the current institutional positions and map out possible swing trade setups for the coming week(s). We will discuss key insights as needed and look at how institutional dark pool activity impacts the price.
Dark pools sound like insidious beasts. Retail traders get caught out selling at the bottom and buying at the top. Of course, this happens as these big players need to buy or sell their shares from someone and they can’t use a limit order for 3 million shares — the stock would scream through the chart. This is why the trades happen “off exchange” and after the fact. Our job is to identify these levels and use them as institutional support and resistance.
Does this instantly make more sense? The white dashed lines on the chart start at the date of the trade and the label on the right is the number of shares, date and price that the trade occurred. The blue horizontal lines are the dark pool price levels that big players have interest in.
Remember that institutions are not scalpers. They are in it for the longer term and it takes them a while to accumulate and distribute shares. Switching your view to the mindset of how the big guys trade will help you immensely in your own trading.
This preamble is important for traders who have either never heard of dark pools or institutional trading or know what it is but there is some disconnect on how to trade it.
Now onto our trade setups for the week!
Each ticker below includes the key institutional levels from the last 10–30 days, where price sits relative to those levels, and our trade setup for the week.
Based on institutional dark pool levels from the past 10–30 days. Bullish bias when price is above key institutional print levels. Bearish bias when price is below. These are NOT recommendations — they’re institutional-grade levels for your watchlist.
| Ticker | Price | Above | T1 | T2 | T3 | T4 | T5 | T6 |
|---|---|---|---|---|---|---|---|---|
| SPY | $690.62 | $697.50 | $700 | $702.50 | $705 | $710 | ||
| QQQ | $609.54 | $622.50 | $625 | $627.50 | $630 | $635 | $637.50 | $640 |
| IWM | $265.02 | $267 | $268.25 | $270 | $272.50 | $275 | $280 | |
| NVDA | $185.18 | $190 | $192.50 | $195 | $200 | $203.25 | $207.50 | $210 |
| AAPL | $277.08 | $277.50 | $279.62 | $282.50 | $285 | $290 | $295 | $300 |
| AMZN | $210.05 | $212.50 | $215 | $217.50 | $220 | $225 | $230 | $231.31 |
| MSFT | $403.00 | $405 | $410 | $412 | $414 | $420 | $423 | $427.50 |
| INTC | $50.66 | $51.25 | $52.50 | $53.75 | $54.25 | $55 | $57.50 | $60 |
| AVGO | $333.50 | $335 | $337.50 | $340 | $350 | $365 | $380 |
| Ticker | Price | Below | T1 | T2 | T3 | T4 | T5 | T6 | T7 |
|---|---|---|---|---|---|---|---|---|---|
| SPY | $690.62 | $687 | $685 | $680 | $679 | $678 | $675 | $670 | |
| QQQ | $609.54 | $594.50 | $592.50 | $590 | $585 | $582.50 | $580 | ||
| IWM | $265.02 | $259 | $257.50 | $256 | $252.50 | $250 | $245 | ||
| NVDA | $185.18 | $180 | $178 | $176.01 | $174.19 | $172.50 | $171.25 | $170 | $165 |
| AAPL | $277.08 | $267 | $265 | $262.50 | $260 | $255 | $250 | ||
| AMZN | $210.05 | $205 | $200 | $195 | $192.50 | $190 | $185 | ||
| MSFT | $403.00 | $397 | $395 | $390 | $380 | $370 | $360 | ||
| INTC | $50.66 | $45 | $44 | $42.50 | $40 | ||||
| AVGO | $333.50 | $307.50 | $305 | $300 | $295 | $280 |
🟢 ABOVE institutional average
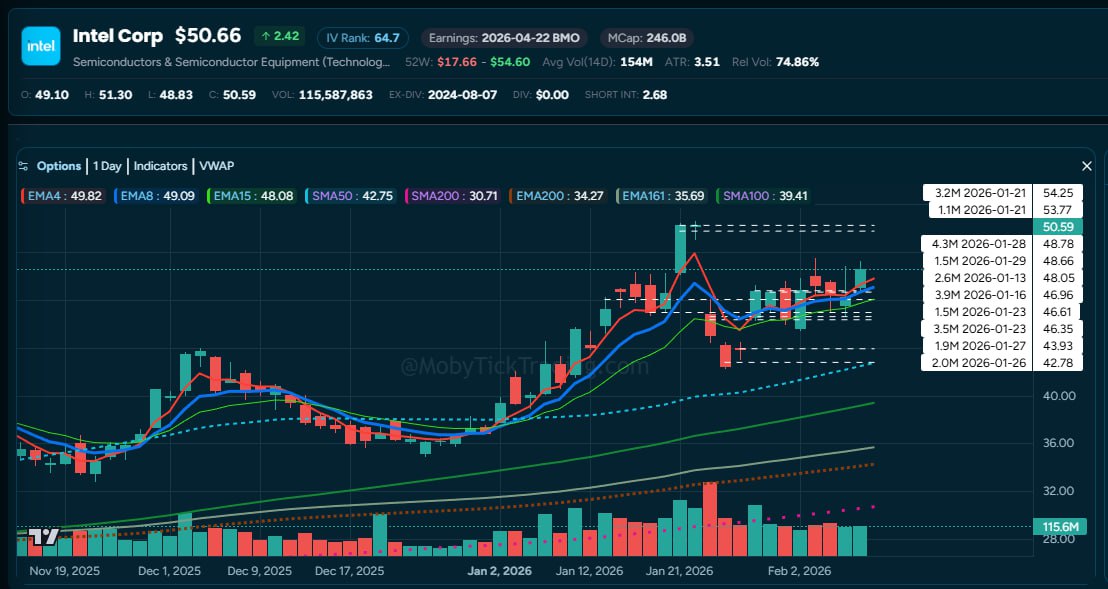
Intel is showing a classic accumulation pattern. Institutions loaded up heavily at $43–49 through January, with the $48–49 zone becoming a fortress of support — 29.4 million shares worth $1.43 billion.
📈 Bullish above $51.25 → targets: $52.50, $53.75, $54.25, $55, $57.50, $60
📉 Bearish below $46.00 → targets: $45, $44, $42.50, $40
🔴 WELL BELOW institutional average
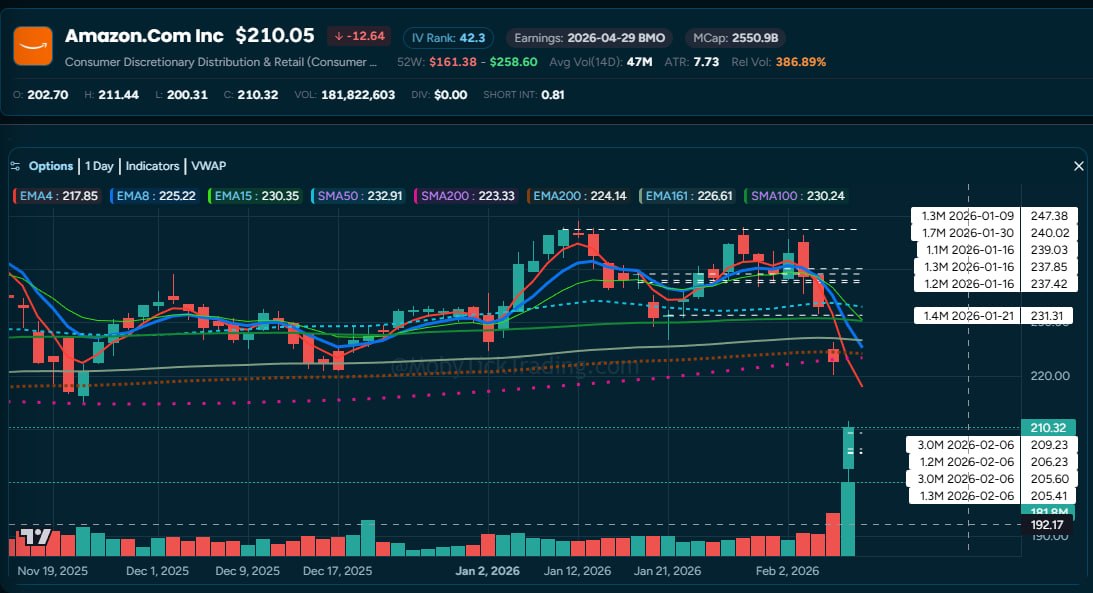
Amazon is this week’s drama pick. Institutions built a massive $237–241 position through January — 15.8 million shares, nearly $3.8 billion in dark pool volume. Then earnings hit and the stock cratered.
The big question: is $205 the floor, or are institutions profit-taking on the short side and we may go lower? Either way, we need a plan for both scenarios. The fact that we saw 8 separate prints in a single day at $205–209 suggests fresh accumulation.
📈 Bullish above $212.50 → targets: $215, $217.50, $220, $225, $230, $231.31
📉 Bearish below $205.00 → targets: $200, $195, $192.50, $190, $185
🟡 RIGHT AT institutional average
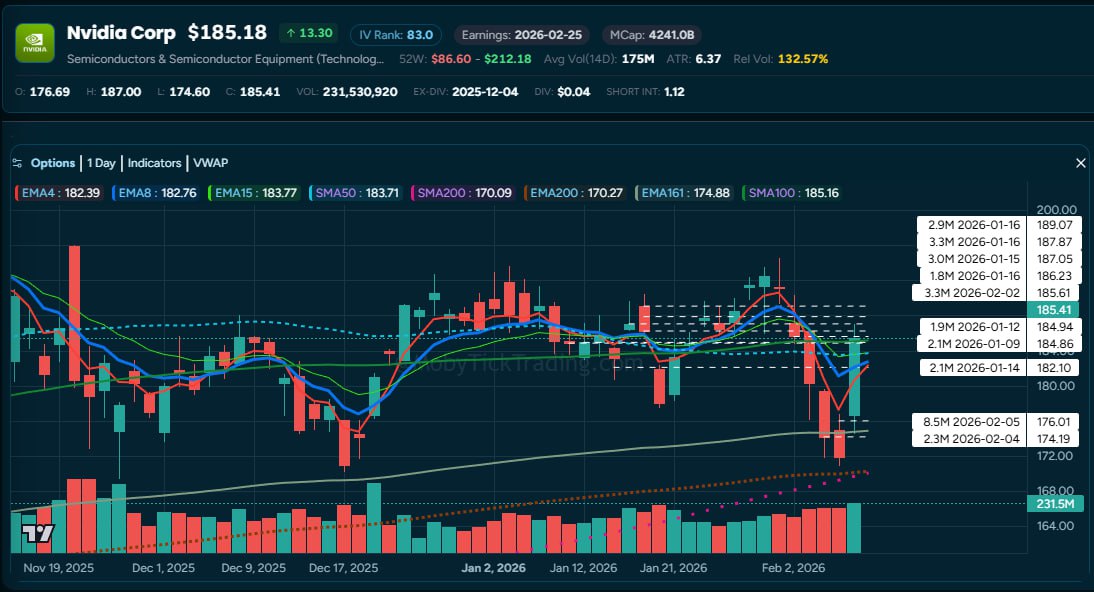
NVIDIA is the institutional darling of 2026. In 30 days: 128.7 million shares, $23.7 billion in dark pool volume across 71 prints. The $184–191 range is a fortress.
The headline: On February 5th, an 8.5 million share print at $176.01 — a single trade worth $1.5 billion. That’s someone with deep pockets saying “this is where I want to own it.” Price immediately bounced.
With earnings on February 25th, this is classic pre-earnings institutional positioning. They’re building. “First come the prints, then the news.”
📈 Bullish above $190 → targets: $192.50, $195, $200, $203.25, $207.50, $210
📉 Bearish below $180 → targets: $178, $176.01, $174.19, $172.50, $171.25, $170, $165
Every trader has heard the phrase: “Follow the money.” It’s repeated in every trading book, every YouTube video, every Discord server. But here’s the problem — most traders have no idea how to actually do it.
Charts show you price and volume. They tell you what happened. But they don’t tell you WHO is behind the moves. A 5-million share print on NVDA at $176 doesn’t show up as anything special on a candlestick chart.
Here’s what makes dark pool data different:
As Mark Douglas wrote in Trading in the Zone: “The best traders think in probabilities.” Dark pool data doesn’t give you certainty — nothing does. But it gives you an edge that most traders don’t have: seeing where the biggest players in the market are putting their money.
Next week, we’ll review how these trades did, find more and discuss profit taking.
Free weekly dark pool watchlist with institutional trade setups and education. Delivered to your inbox before the market opens Monday.
Moby Tick Trading provides institutional-grade dark pool and block trade intelligence to retail traders. Our platform tracks 10,000+ stocks with 5+ years of historical data, delivering the insights that professional traders use — to everyone.
Most retail traders rely on charts that show what already happened. MobyTick shows you where institutions are quietly positioning right now — the same dark pool data that hedge funds pay millions for.
10,000+ stocks · 5+ years of history · 91% accuracy on trade callouts
Disclaimer: This report is for educational purposes only and does not constitute financial advice. Dark pool data shows institutional activity but does not guarantee future price movement. Always do your own research and consult a licensed financial advisor before making investment decisions.