Physical Address
304 North Cardinal St.
Dorchester Center, MA 02124
Physical Address
304 North Cardinal St.
Dorchester Center, MA 02124

AAPL, NVDA, INTC, MSFT, and GOOGL led this week's institutional dark pool activity as the S&P 500 and Nasdaq closed at record highs. Review the scorecard, fresh setup levels, and pre-earnings institutional positioning for PLTR, AMD, and ARM.
Week of April 27–May 1, 2026
Follow the Money. See What Others Can’t.
MobyTick Trading weekly dark pool report. This draft covers institutional positioning from the prior week, reviews how last week’s setup sheet performed, and maps the new trade setup levels for the week ahead.
The Apr. 27–May 1 callout sheet produced 12 of 13 Above triggers, 6 of 13 Below triggers, and 27 listed targets reached across the slate. GOOGL delivered the strongest upside extension, MSFT triggered both sides, and UNH moved higher rather than triggering the downside setup.
The major U.S. indexes finished the week of Apr. 27 through May 1 with the S&P 500 and Nasdaq Composite both closing at fresh record highs. The S&P 500 ended at 7,230, up 0.9% for the week, while the Nasdaq Composite closed at 25,114, up 1.1%. The Dow Jones Industrial Average closed at 49,498, down 0.31% on Friday but still higher by 0.5% for the week, and the Russell 2000 finished Friday at 2,812, up 0.46% on the day.
The macro calendar was dense. On April 29, the Federal Reserve left the federal funds target range unchanged at 3.5% to 3.75%. The decision came on an 8-4 vote, the widest split since 1992, underscoring a more visible policy divide even as the Committee kept rates unchanged. The statement noted that inflation remained elevated and that developments in the Middle East were contributing to a high level of uncertainty. On April 30, the advance estimate for Q1 GDP came in at 2.0% annualized, an improvement from 0.5% in the prior quarter. The same BEA release showed the PCE price index at 4.5% and core PCE at 4.3% for the quarter. On May 1, ISM Manufacturing PMI was 52.7, unchanged from March, while the prices paid component increased to 84.6 from 78.3.
Earnings strength remained a central support for the tape. Analysts now see aggregate S&P 500 first-quarter earnings growth at 27.8% year over year, the fastest pace since the fourth quarter of 2021, according to Reuters citing LSEG I/B/E/S data. That backdrop helped reinforce the continued concentration in large-cap technology and index ETF participation.
Dark pool activity stayed concentrated in the broad market ETFs and the large-cap technology complex. SPY led the weekly board with $8.80B in off-exchange flow, followed by QQQ at $3.37B and IWM at $2.86B. Among single stocks, AAPL led at $7.01B, followed by NVDA at $4.43B, INTC at $2.53B, MSFT at $2.46B, and MU at $2.37B. The most notable individual stock move inside this group was INTC, which traded from a weekly low of 80.80 to a high of 100.45 and finished the week up 19.06%.
Sector ETF flow showed the heaviest off-exchange participation in energy and financials, with XLE at $345.4M and XLF at $299.3M, followed closely by XLRE at $258.5M and XLK at $254.7M. In the commodity and volatility backdrop, WTI crude settled at $101.94/bbl, Brent at $108.17/bbl, gold at $4,644.50/oz, and the VIX traded down to 16.44. The broad backdrop into next week was a cross-current of strong earnings growth, elevated energy prices, lower implied volatility, and concentrated institutional participation in the index and semiconductor complex.
Broad market ETF flow remained the dominant feature of the week. Combined dark pool activity in SPY, QQQ, IWM, VOO, and IVV totaled $18.63B. SPY alone accounted for $8.80B across 13 prints, while QQQ added $3.37B and IWM contributed $2.86B. That concentration kept the index ETF complex firmly in control of the weekly tape.
Sector rotation beneath the surface was more mixed. The highest sector SPDR flow came from XLE at $345.4M, followed by XLF at $299.3M, XLRE at $258.5M, and XLK at $254.7M. Behind them were XLI at $195.3M and XLY at $162.0M. At the bottom of the ranking, XLB saw just $27.4M, while XLU and XLV were also light at $49.8M and $70.5M, respectively.
The ranking matters. XLE drew more than 12 times the dark pool flow of XLB, and it also outpaced the traditionally defensive XLU by nearly 7 times. At the same time, XLK still remained near the top of the list, which fits the broader pattern of strong participation in large-cap technology earnings names. The result was a tape where institutions remained active in both the earnings-heavy technology complex and in commodity-sensitive energy exposure.
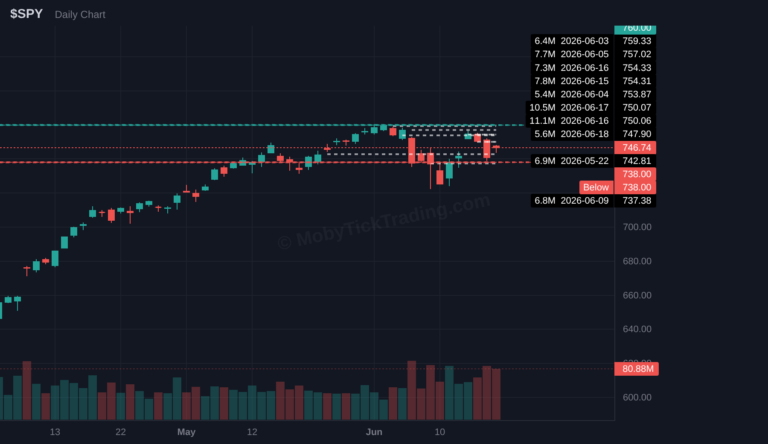
Dark Pool Context: $8,799.8M total flow | 12.30M shares | 13 prints | Avg print $715.32
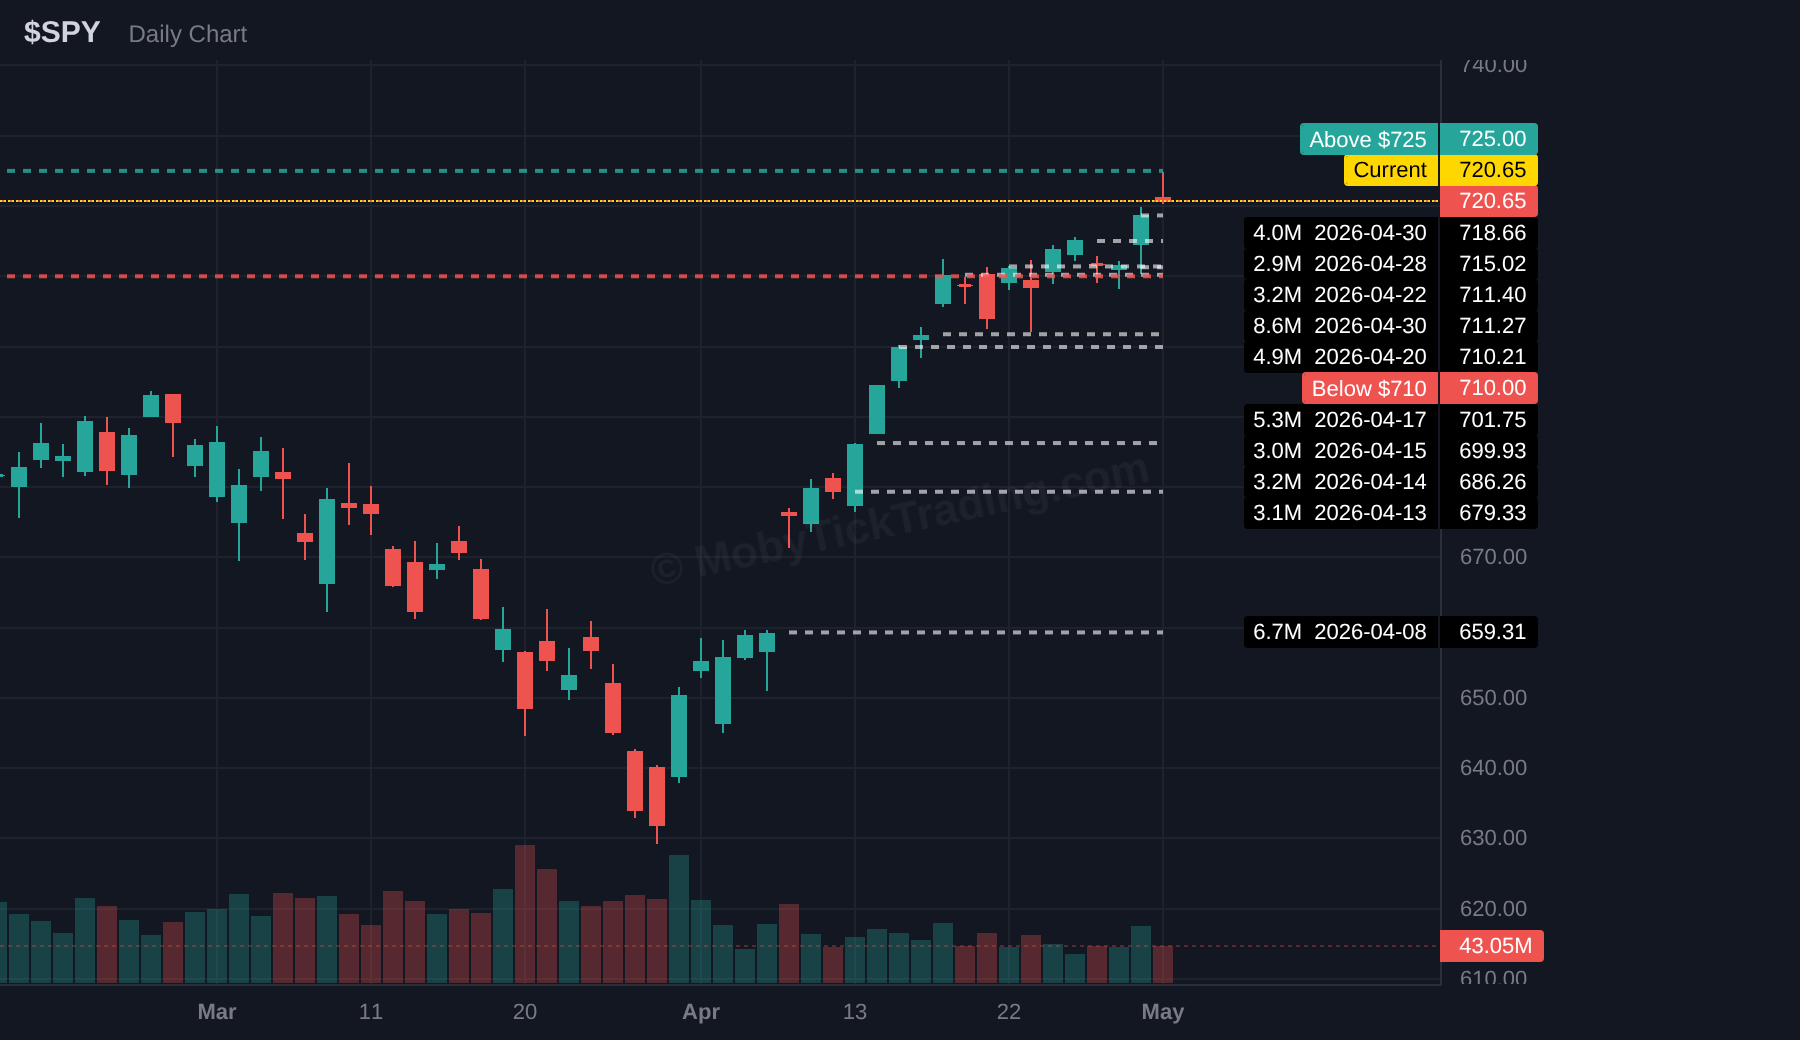
SPY remained the broad-market reference this week with $8.80B in dark pool flow across 13 prints. Price opened at 713.17, traded as high as 724.87, and closed at 720.65, keeping the index ETF complex firmly at the center of the tape.
The new callout ladder starts at 725 on the upside and 710 on the downside. With broad ETF flow still dominant and multiple earnings reactions due next week, SPY is the cleanest map for overall market participation.
Above $725 → Targets: $727.5, $730, $732.5, $735, $740
Below $710 → Targets: $707.5, $705, $702.5, $700, $695, $690
Dark Pool Context: $2,864.9M total flow | 10.36M shares | 10 prints | Avg print $276.48
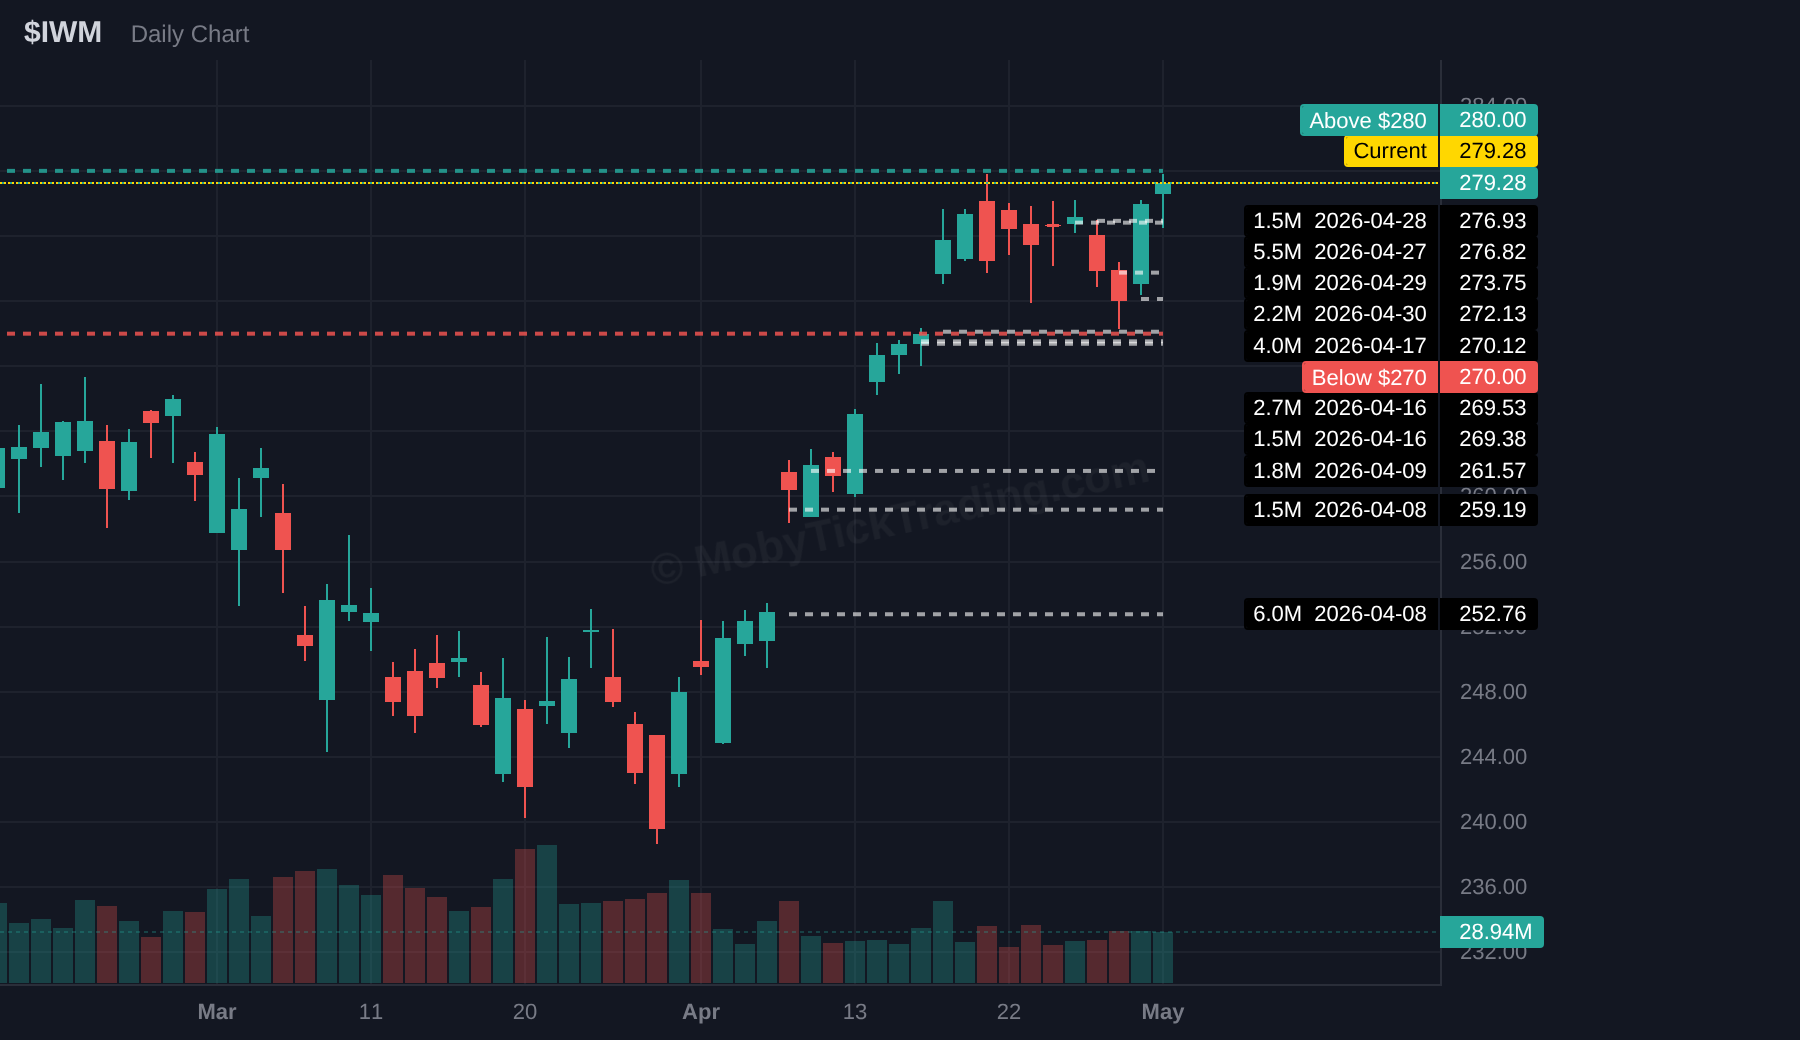
IWM printed $2.86B across 10 dark pool prints and closed the week at 279.28 after trading between 270.36 and 279.81. Small caps participated, but with more volatility than the large-cap ETF complex.
The fresh setup is centered on 280 above and 270 below. That range is useful because it sits just outside the week’s actual extremes and gives a clean read on whether participation broadens beyond mega-cap leadership.
Above $280 → Targets: $282.5, $285, $287.5, $290, $292.5
Below $270 → Targets: $267.5, $265, $262.5, $260, $257.50
Dark Pool Context: $3,374.1M total flow | 5.08M shares | 7 prints | Avg print $663.74
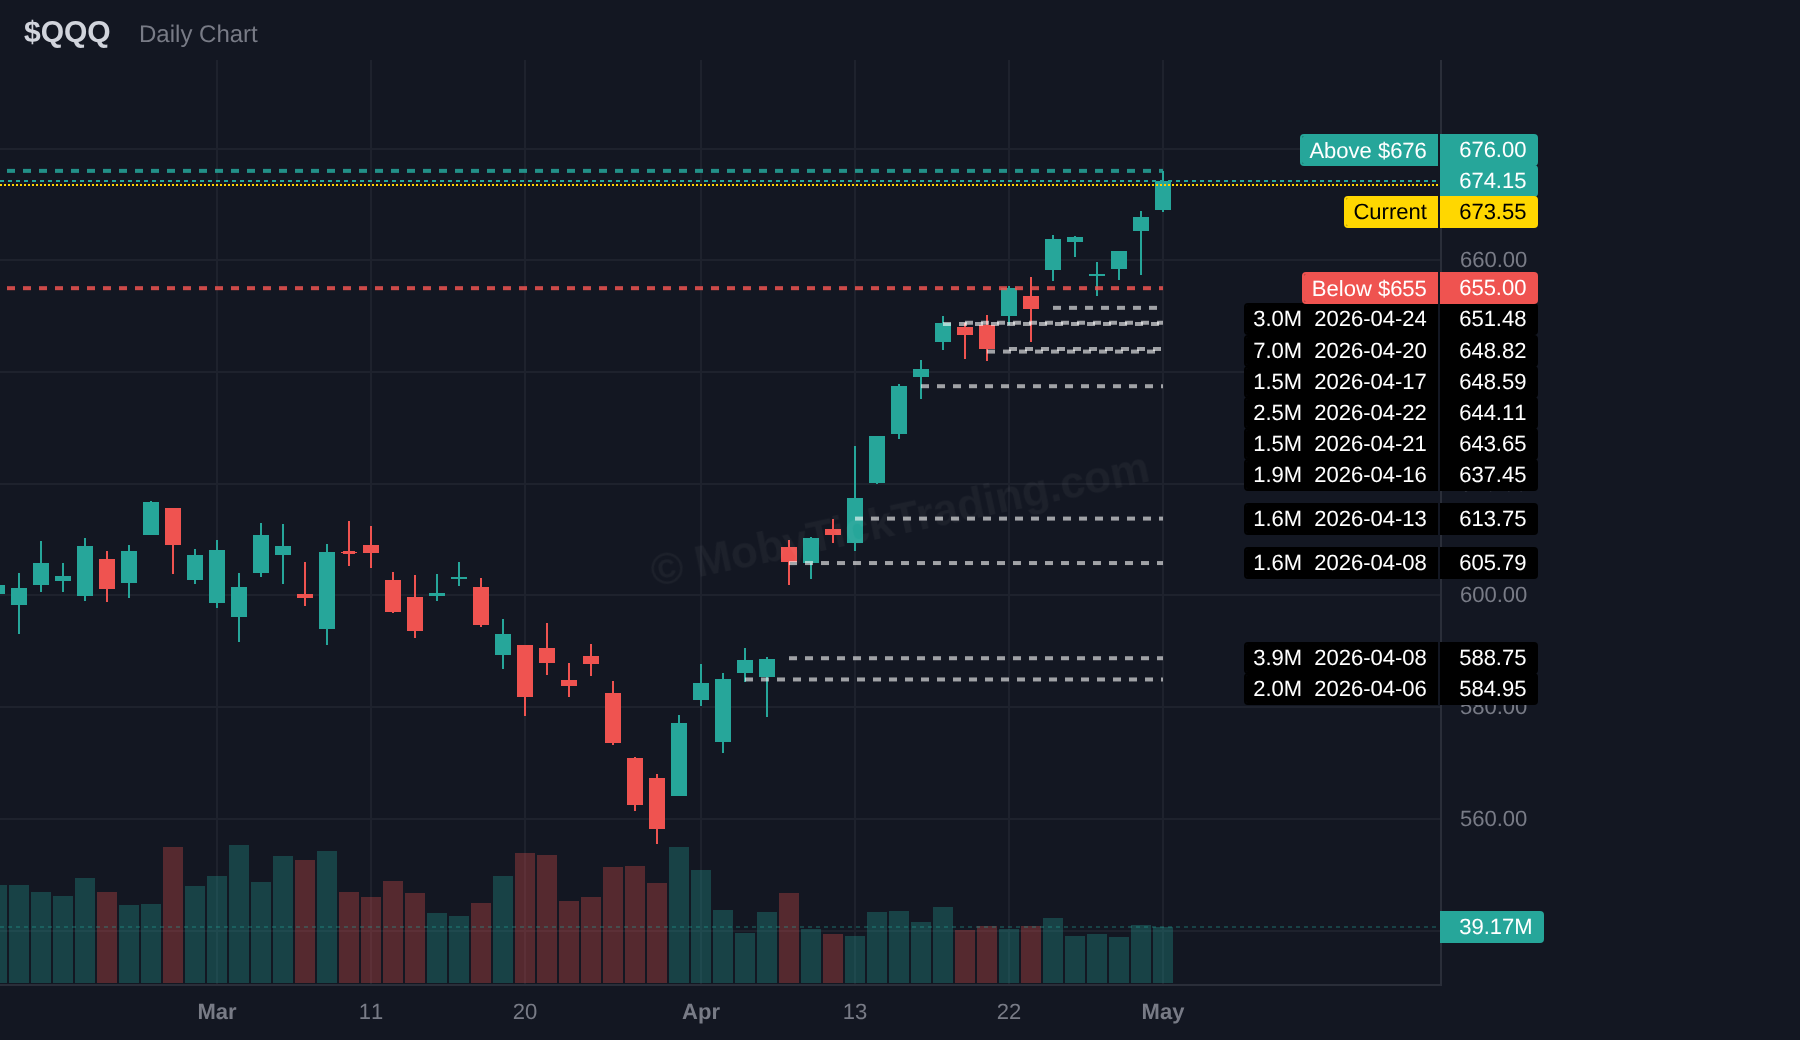
QQQ generated $3.37B in dark pool flow across 7 prints and closed at 674.15 after reaching a weekly high of 675.97. The Nasdaq complex remained one of the strongest areas of the market into the close.
The new ladder starts at 676 above and 655 below. With large-cap technology still dominating both earnings attention and off-exchange participation, QQQ remains one of the most important charts in the report.
Above $676 → Targets: $680, $682.5, $685, $687.5, $690
Below $655 → Targets: $652.5, $650, $647.5, $645, $642.5, $640
Dark Pool Context: $7,012.4M total flow | 25.70M shares | 11 prints | Avg print $272.86
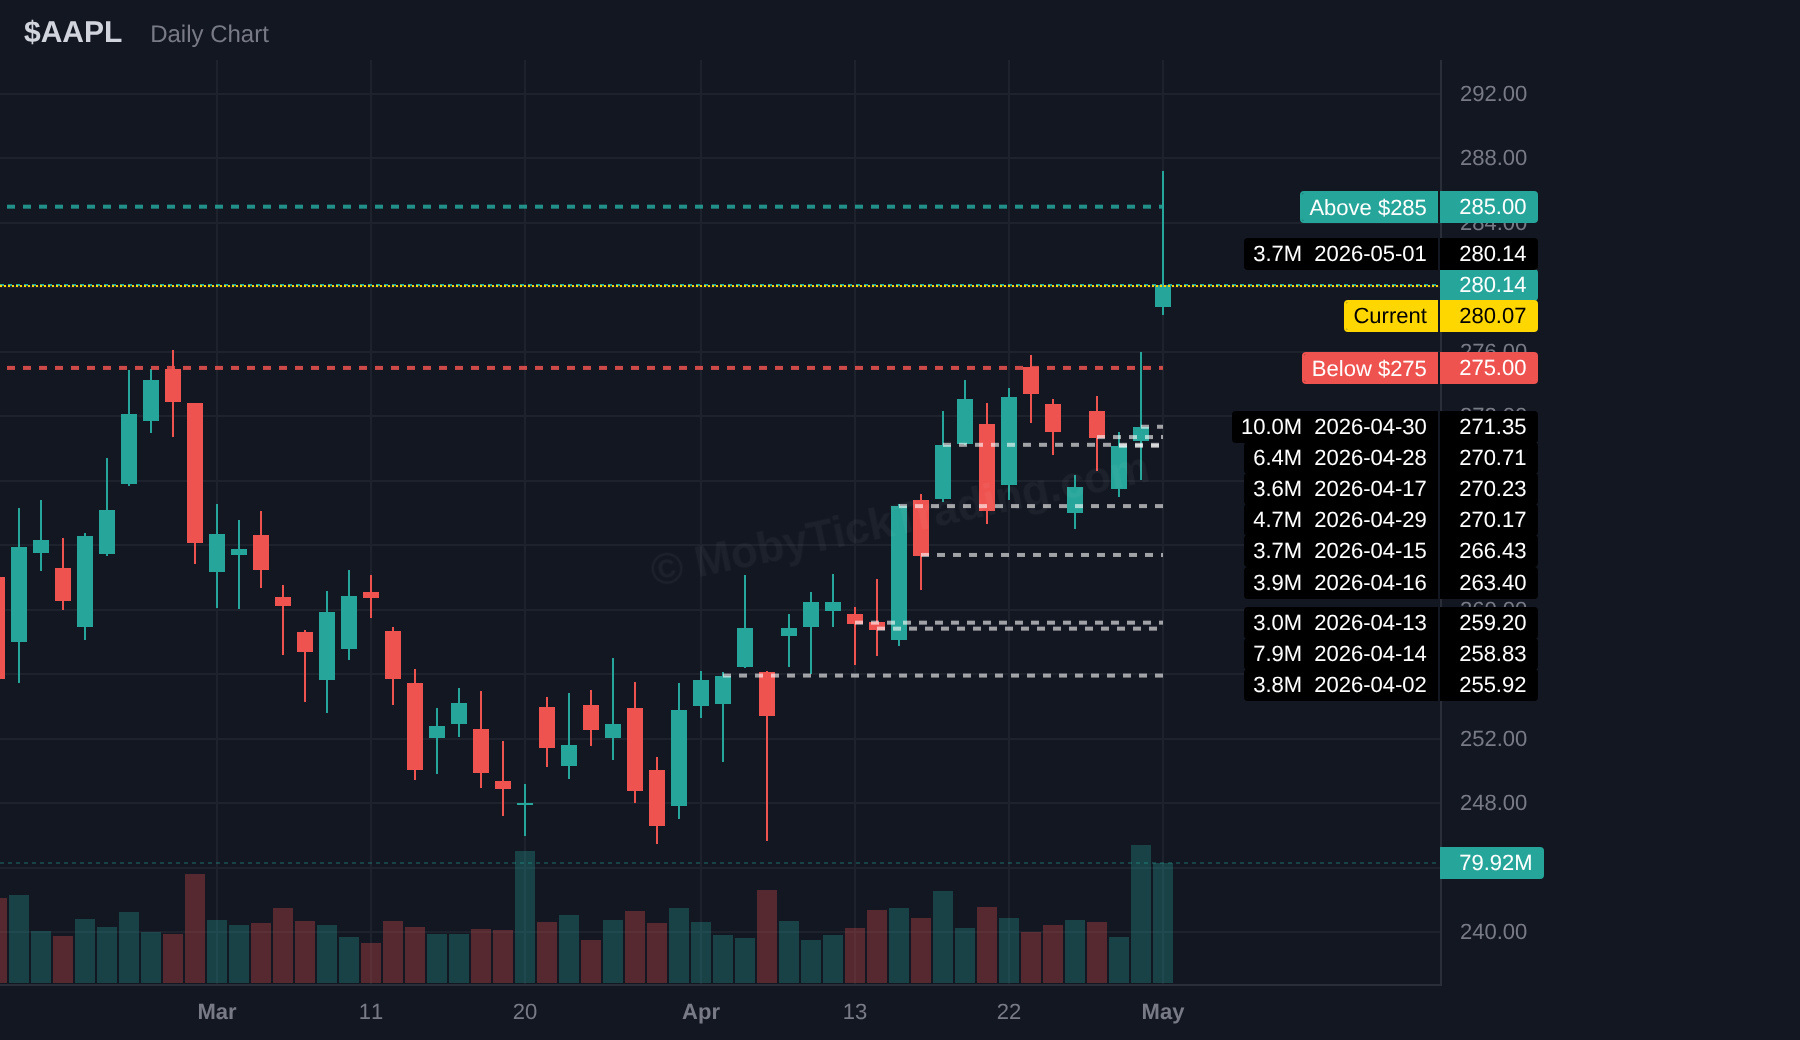
AAPL led all single stocks this week with $7.01B in dark pool flow across 11 prints and 25.70M shares. The stock closed at 280.14 after trading between 265.07 and 287.22.
That institutional size matters heading into the new week. The updated callout map begins at 285 above and 275 below, placing the setup close to both the current close and the actual weekly range.
Above $285 → Targets: $287.5, $290, $295, $300, $302.5, $305
Below $275 → Targets: $272.5, $270, $267.5, $265, $262.5, $260
Dark Pool Context: $4,425.7M total flow | 21.59M shares | 16 prints | Avg print $205.00
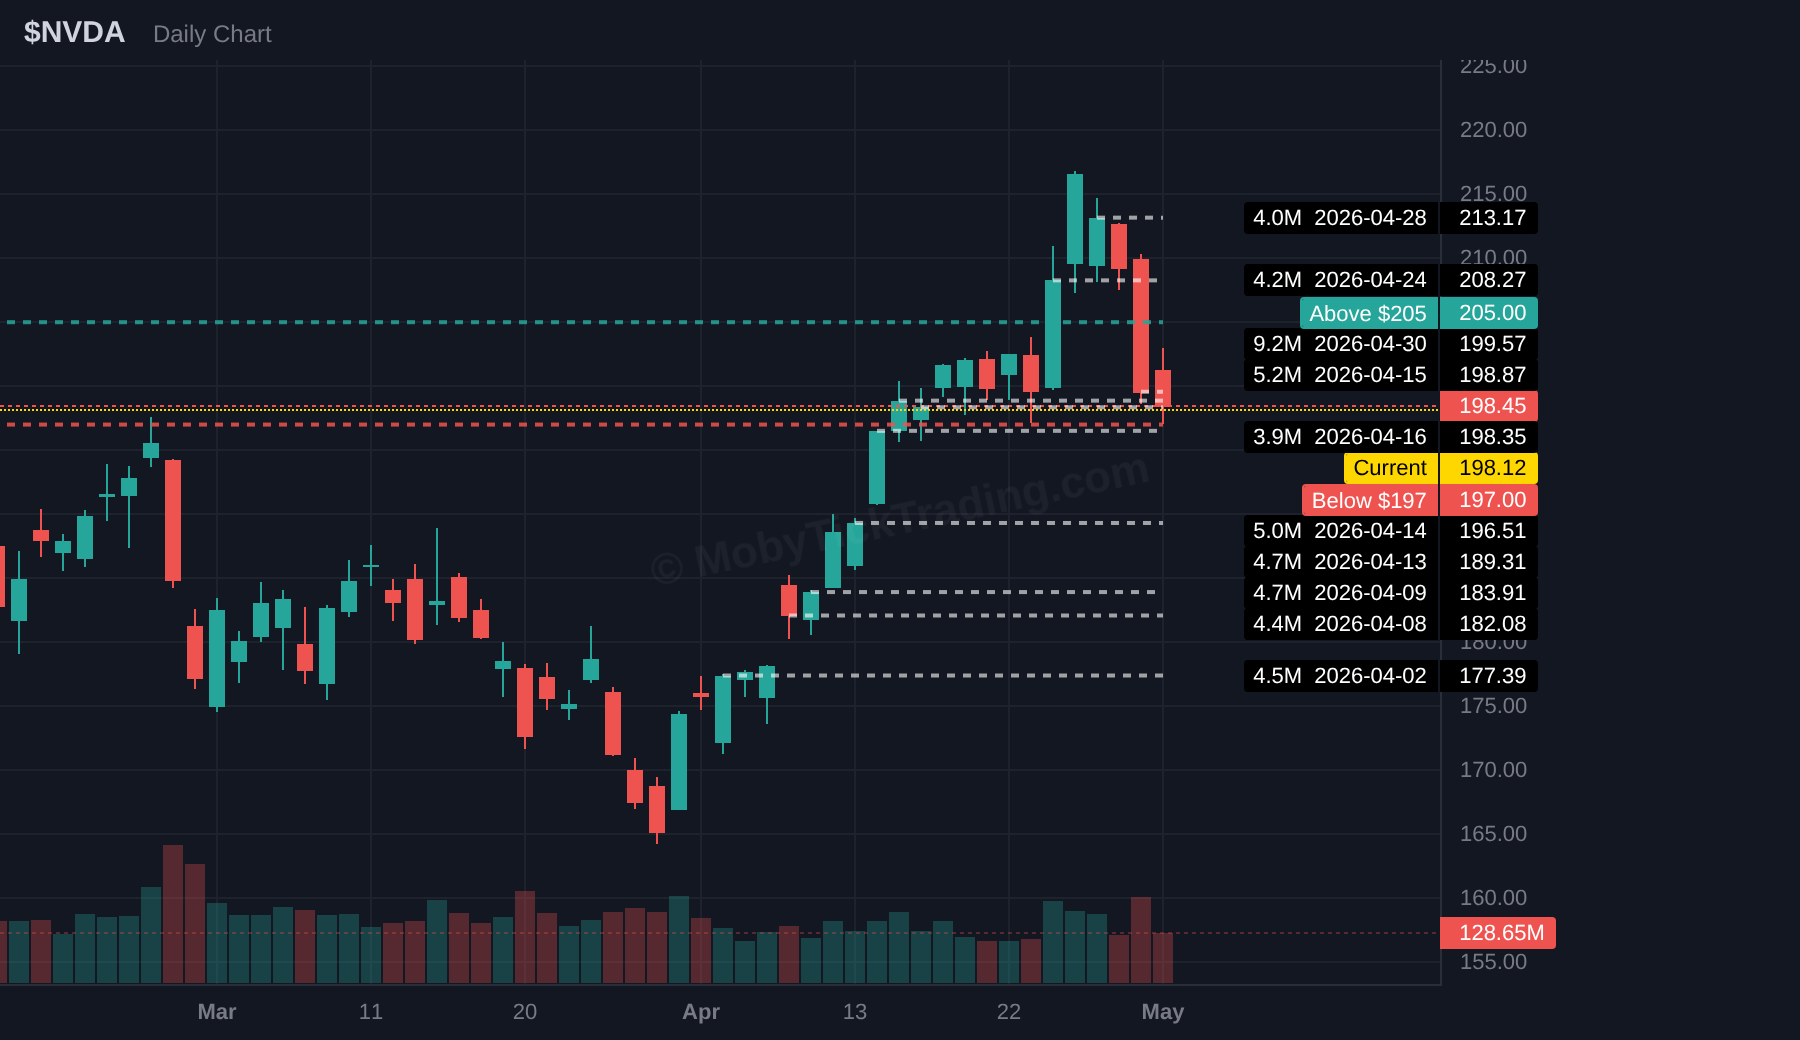
NVDA printed $4.43B across 16 dark pool prints, one of the largest institutional footprints on the entire board. The stock traded between 197.12 and 216.82 and closed at 198.45, leaving a wide earnings-sensitive range in place.
The fresh setup begins at 205 above and 197 below. With average dark pool execution near 205.00, the chart is already organized around a visible institutional reference zone heading into next week.
Above $205 → Targets: $207.5, $210, $212.5, $215, $217.50, $220
Below $197 → Targets: $195, $192.5, $190, $187.5, $185
Dark Pool Context: $2,529.4M total flow | 28.57M shares | 8 prints | Avg print $88.54
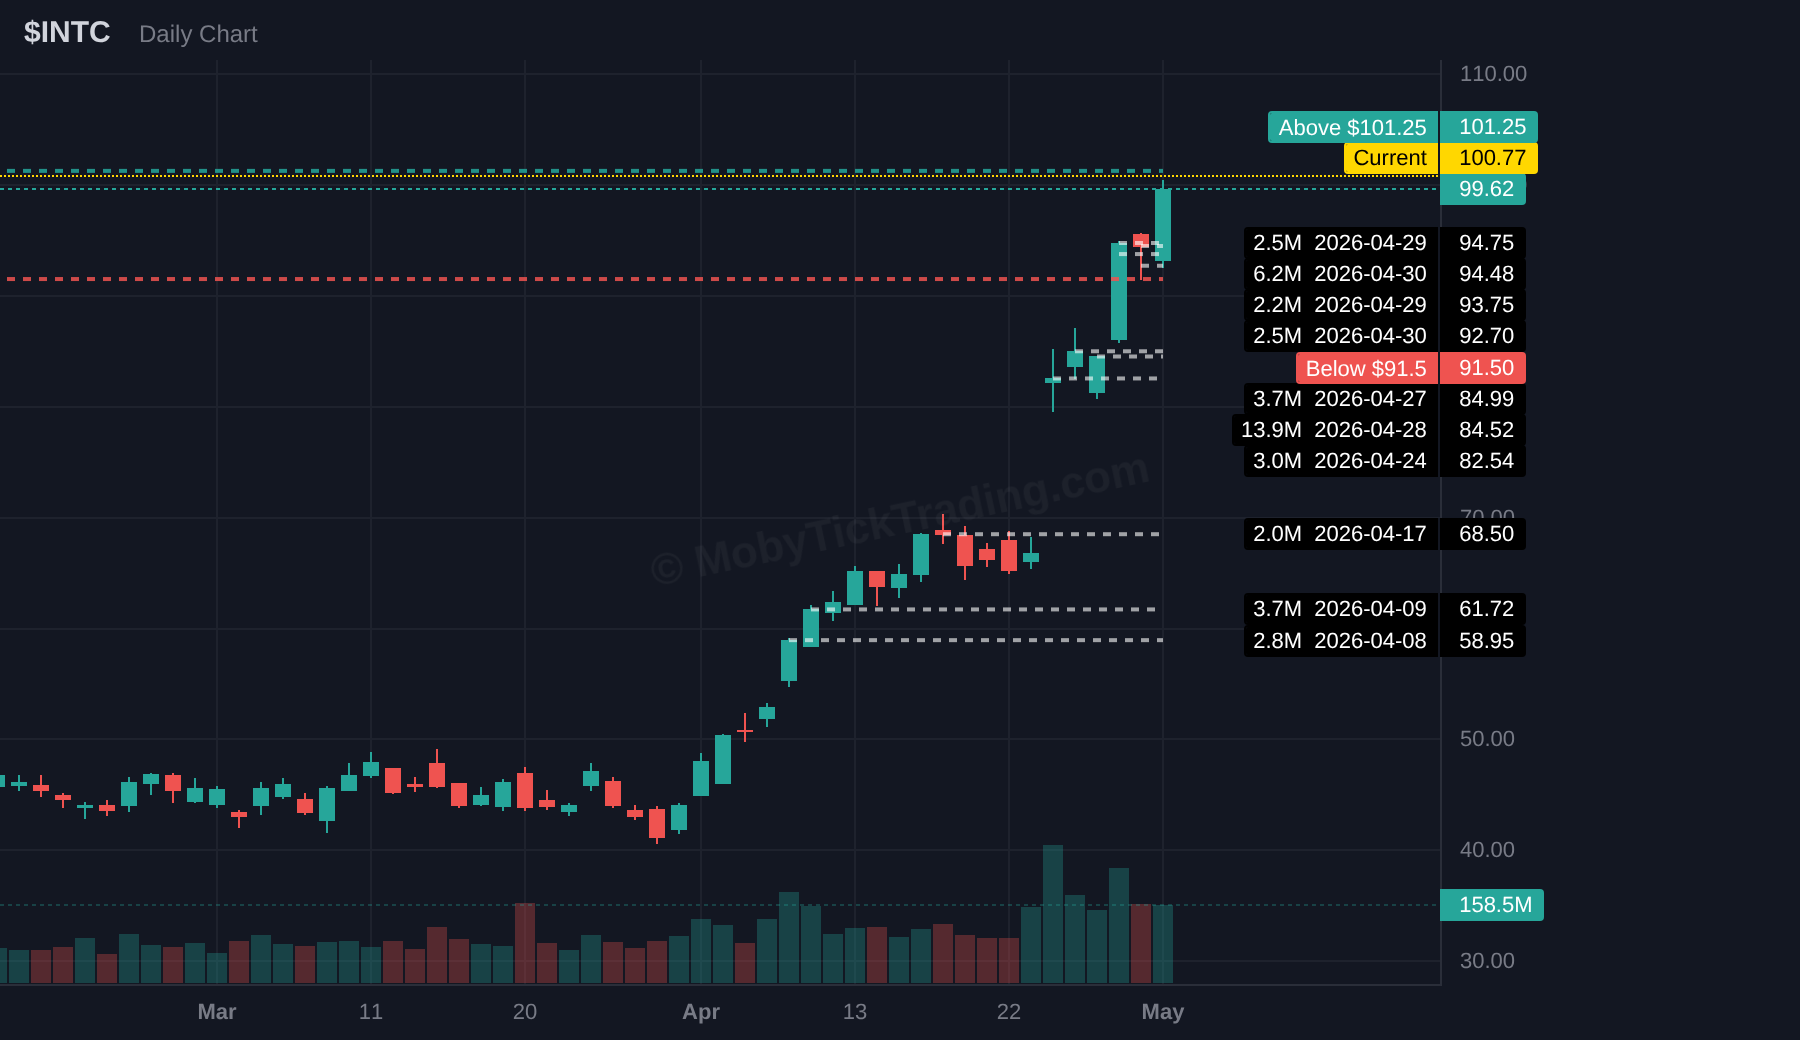
INTC was one of the standout movers of the week, printing $2.53B across 8 dark pool blocks and rising 19.06% from Monday open to Friday close. The stock traded from 80.80 to 100.45 and finished at 99.62.
That massive move is exactly why this name deserves discussion in the report. The new setup starts at 101.25 above and 91.50 below, framing whether price accepts above the expansion zone or rotates back into the lower band after the surge.
Above $101.25 → Targets: $102.5, $105, $107.5, $110, $112.5, $115, $120
Below $91.5 → Targets: $90, $89.25, $87.50, $85, $82.50, $80
Dark Pool Context: $2,460.7M total flow | 5.92M shares | 8 prints | Avg print $415.65
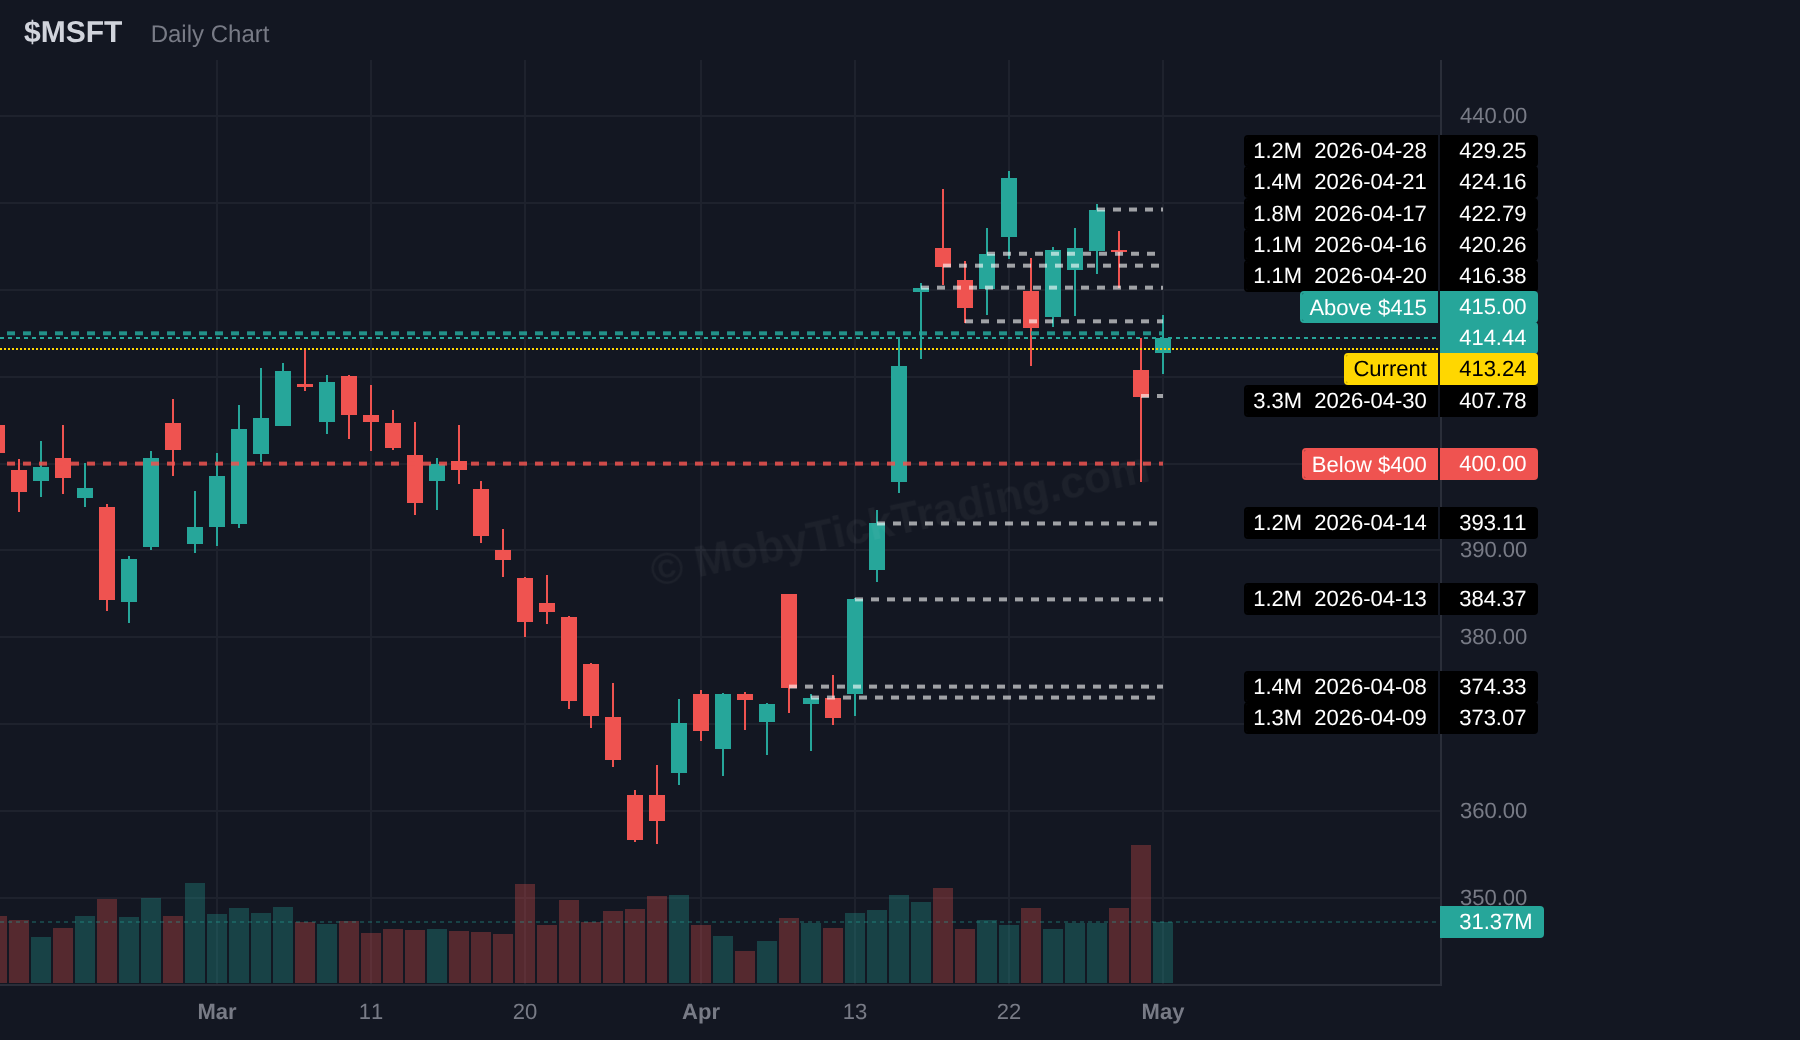
MSFT generated $2.46B in dark pool flow across 8 prints and traded between 398.01 and 429.92. The stock closed at 414.44, leaving the 415 area directly in play for the week ahead.
The new trigger ladder begins at 415 above and 400 below. With large institutional prints clustered near 415.65 average execution, the chart already has a well-defined reference zone.
Above $415 → Targets: $420, $425, $427.50, $430, $435, $440, $450
Below $400 → Targets: $397.5, $395, $390, $385, $380, $370, $365
Dark Pool Context: $2,372.9M total flow | 4.63M shares | 6 prints | Avg print $512.72
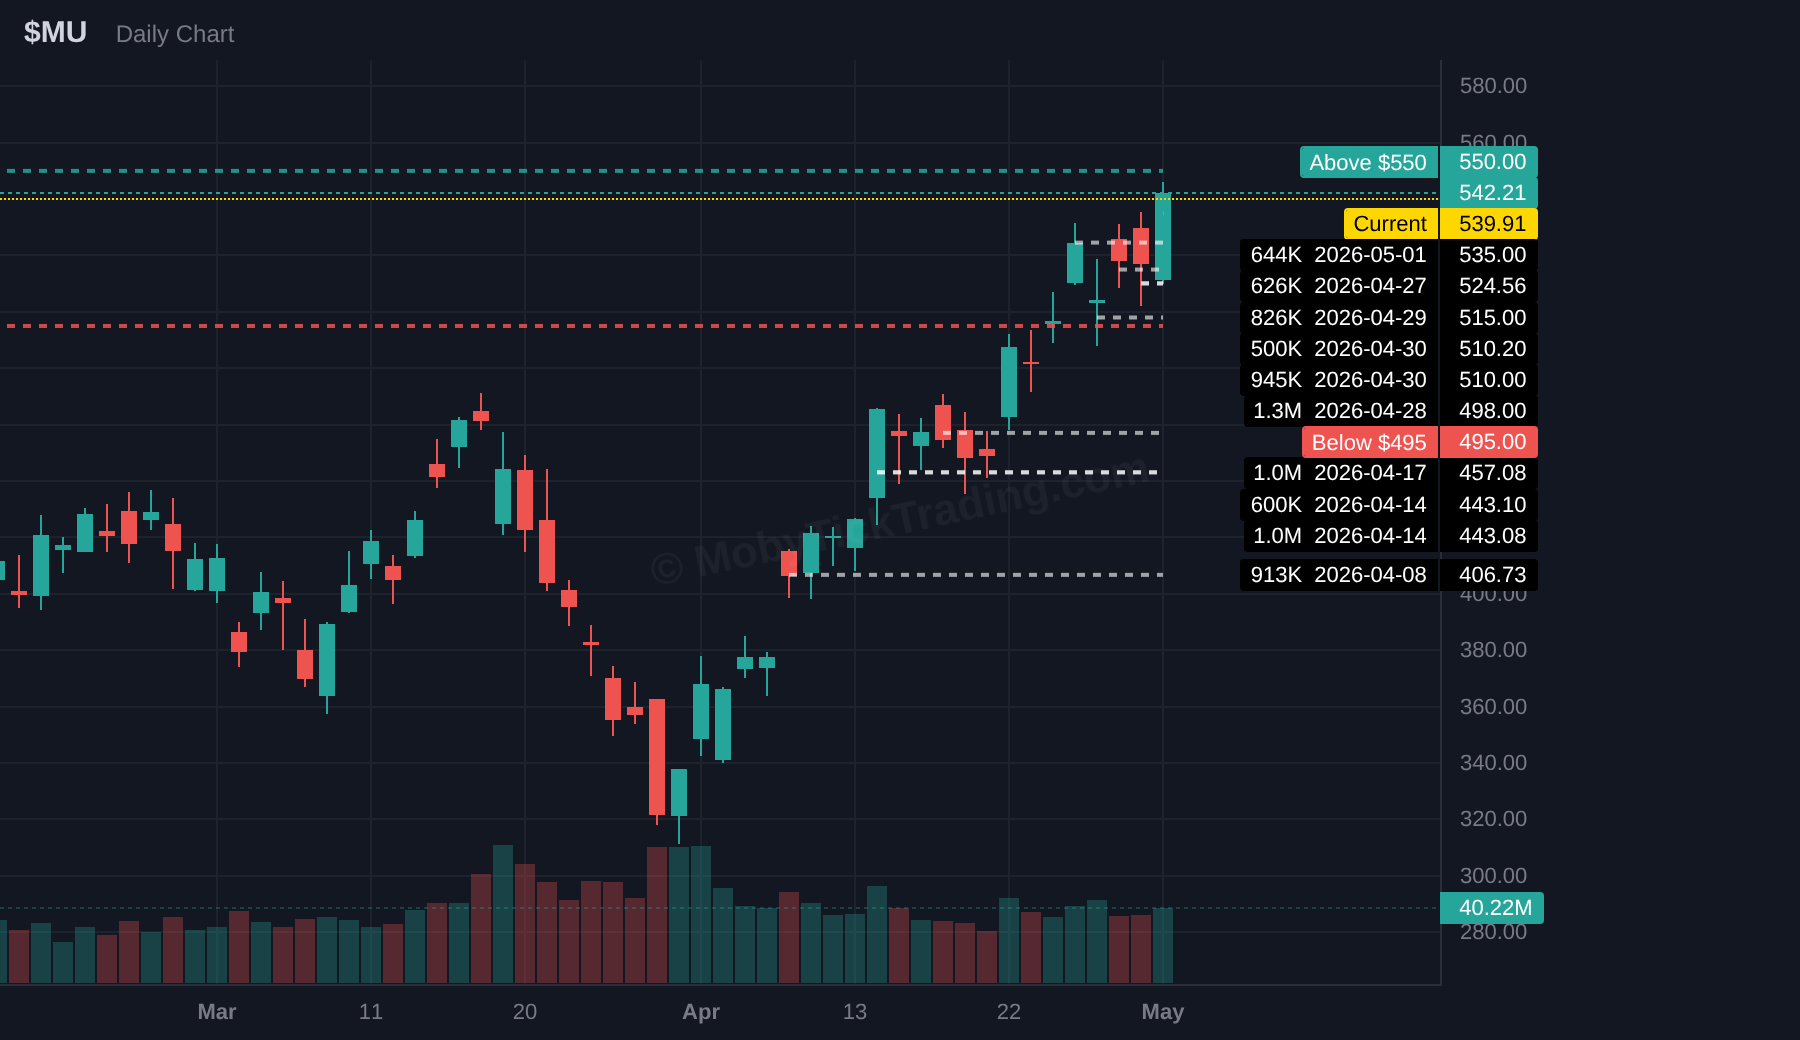
MU printed $2.37B across 6 blocks and finished the week at 542.21 after trading between 488.23 and 545.91. The stock produced one of the stronger semiconductor advances of the week.
The updated callout range of 550 above and 495 below reflects just how much the chart expanded. This is a wider ladder than most names in the issue, which fits the actual volatility that MU showed this week.
Above $550 → Targets: $560, $575, $600, $612.50, $620, $630
Below $495 → Targets: $480, $470, $460, $450, $445, $430
Dark Pool Context: $1,929.0M total flow | 7.34M shares | 7 prints | Avg print $262.98
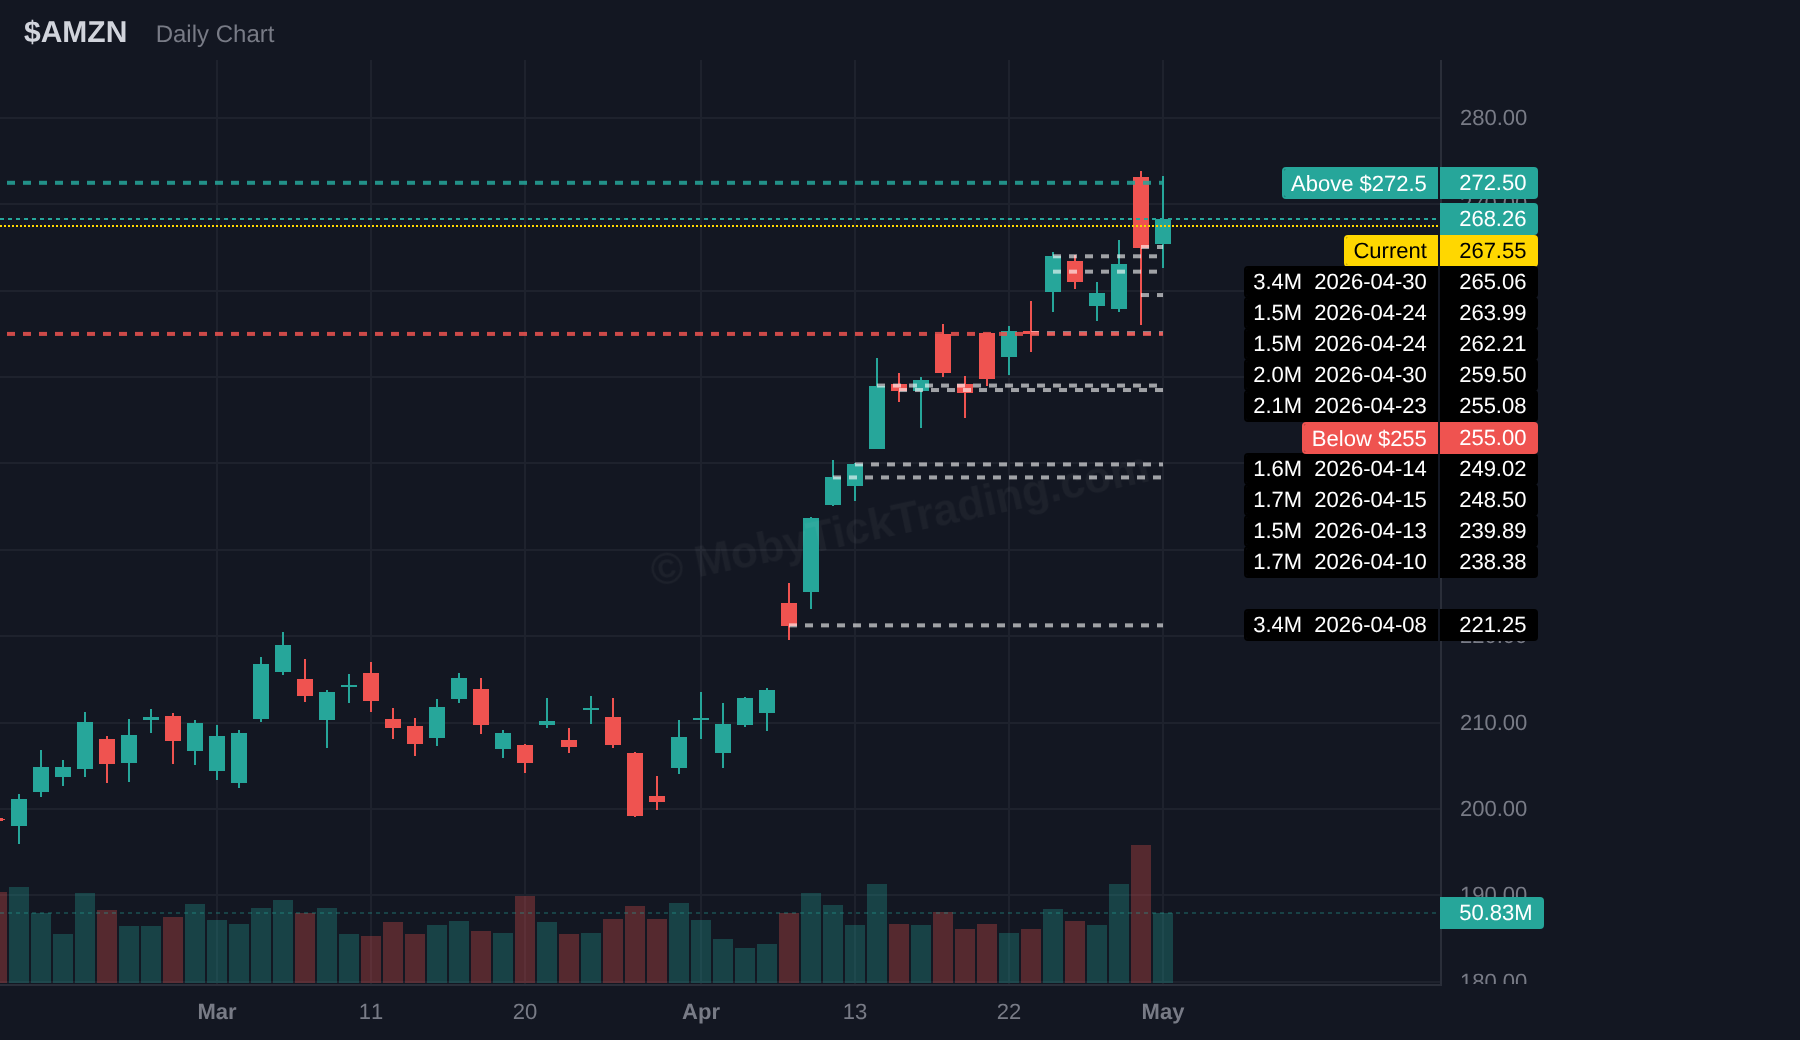
AMZN generated $1.93B in dark pool flow across 7 prints and closed at 268.26 after trading between 256.16 and 273.88. The stock held a relatively tight upper range compared with some of the other mega-cap names.
The new setup starts at 272.5 above and 255 below. Those levels bracket the current range cleanly and give a straightforward reaction map heading into the next earnings cycle.
Above $272.5 → Targets: $275, $277.5, $280, $285, $290
Below $255 → Targets: $252.5, $250, $247.5, $245, $240, $237.5
Dark Pool Context: $1,665.0M total flow | 4.61M shares | 7 prints | Avg print $361.09
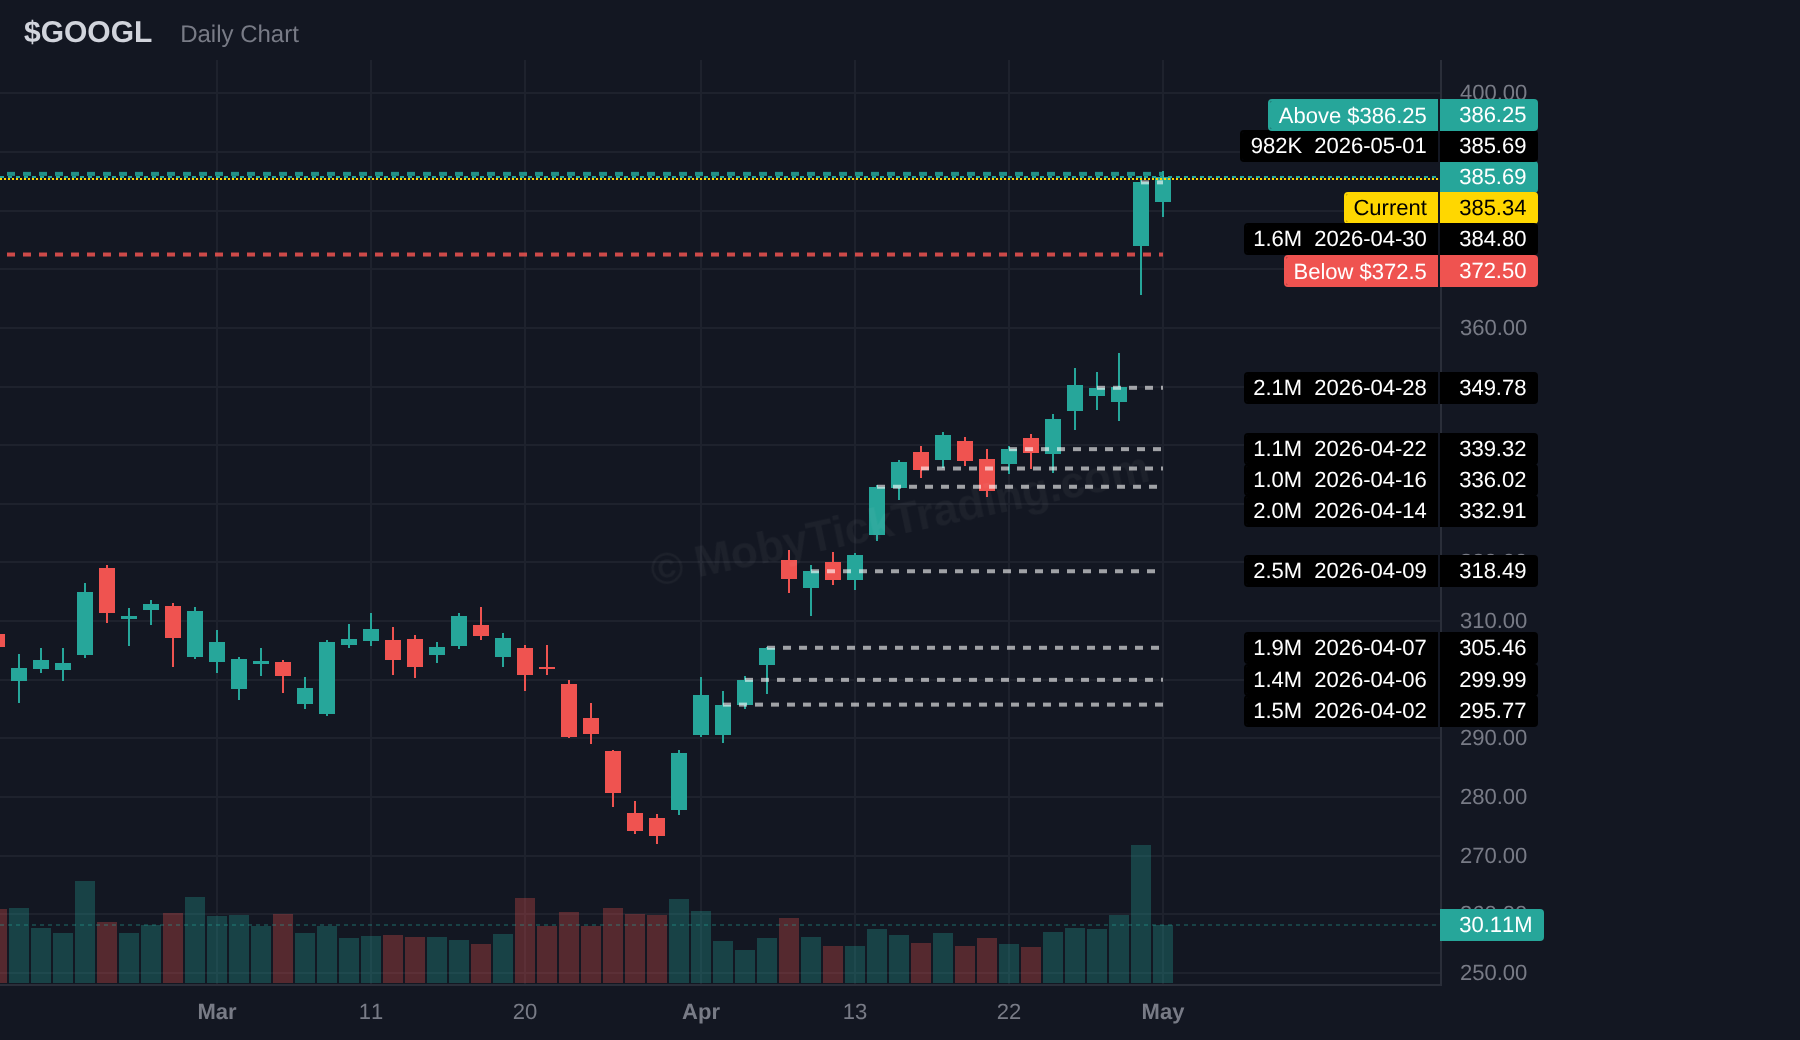
GOOGL printed $1.67B across 7 dark pool prints and closed at 385.69 after trading from 342.73 to 386.76. The stock posted one of the strongest weekly percentage gains in the slate at 11.48%.
The new trigger ladder begins at 386.25 above and 372.5 below. That keeps the setup tightly aligned with the current price after a large expansion week, which is exactly what traders want for a post-move follow-up chart.
Above $386.25 → Targets: $390, $395, $400, $410, $412.50, $420
Below $372.5 → Targets: $370, $365, $360, $355, $352.50
Dark Pool Context: $1,418.5M total flow | 11.03M shares | 5 prints | Avg print $128.61
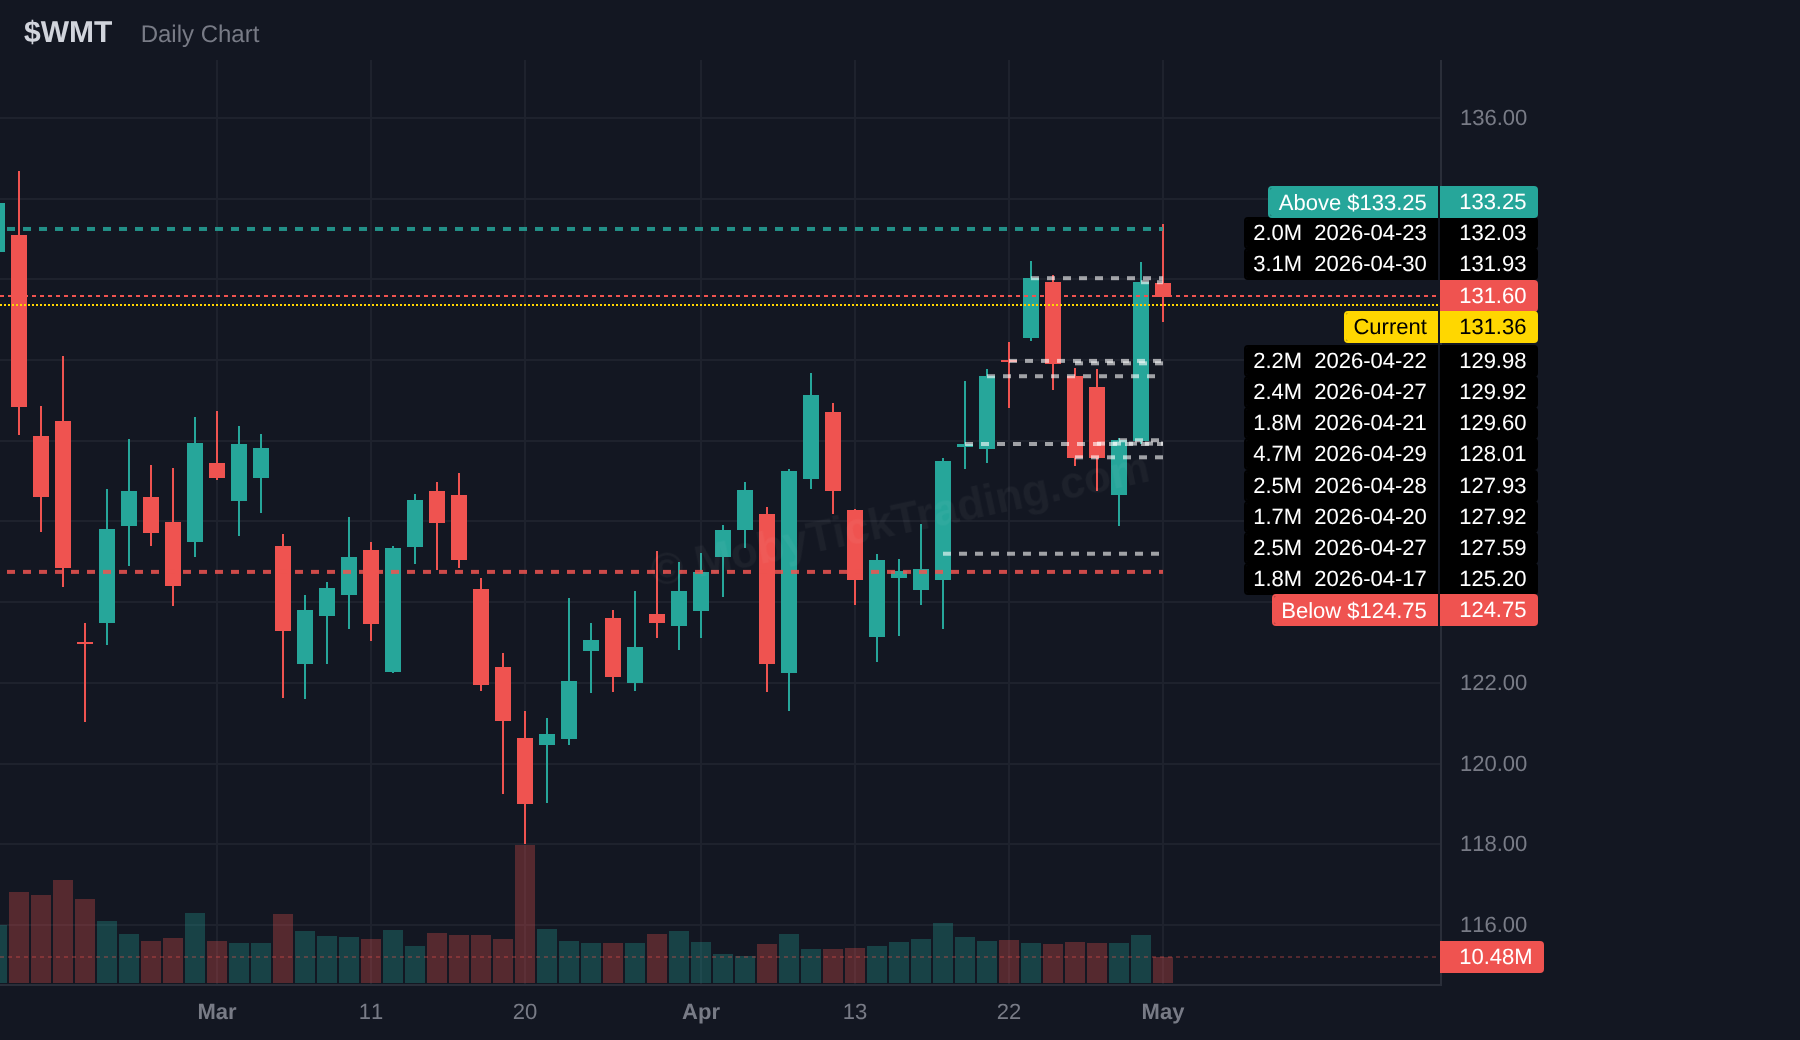
WMT printed $1.42B across 5 dark pool blocks and 11.03M shares, with a 0.60x volume-ratio signal in this week’s screen. The stock traded between 125.91 and 133.37 and closed at 131.60.
The new setup starts at 133.25 above and 124.75 below. For a lower-volatility name, this gives a clean structure around a week where institutional participation was notable relative to its normal pace.
Above $133.25 → Targets: $135, $137.5, $140, $142.5, $145
Below $124.75 → Targets: $122.5, $120, $117.5, $115, $112.5, $112
Dark Pool Context: $997.0M total flow | 3.70M shares | 6 prints | Avg print $269.11
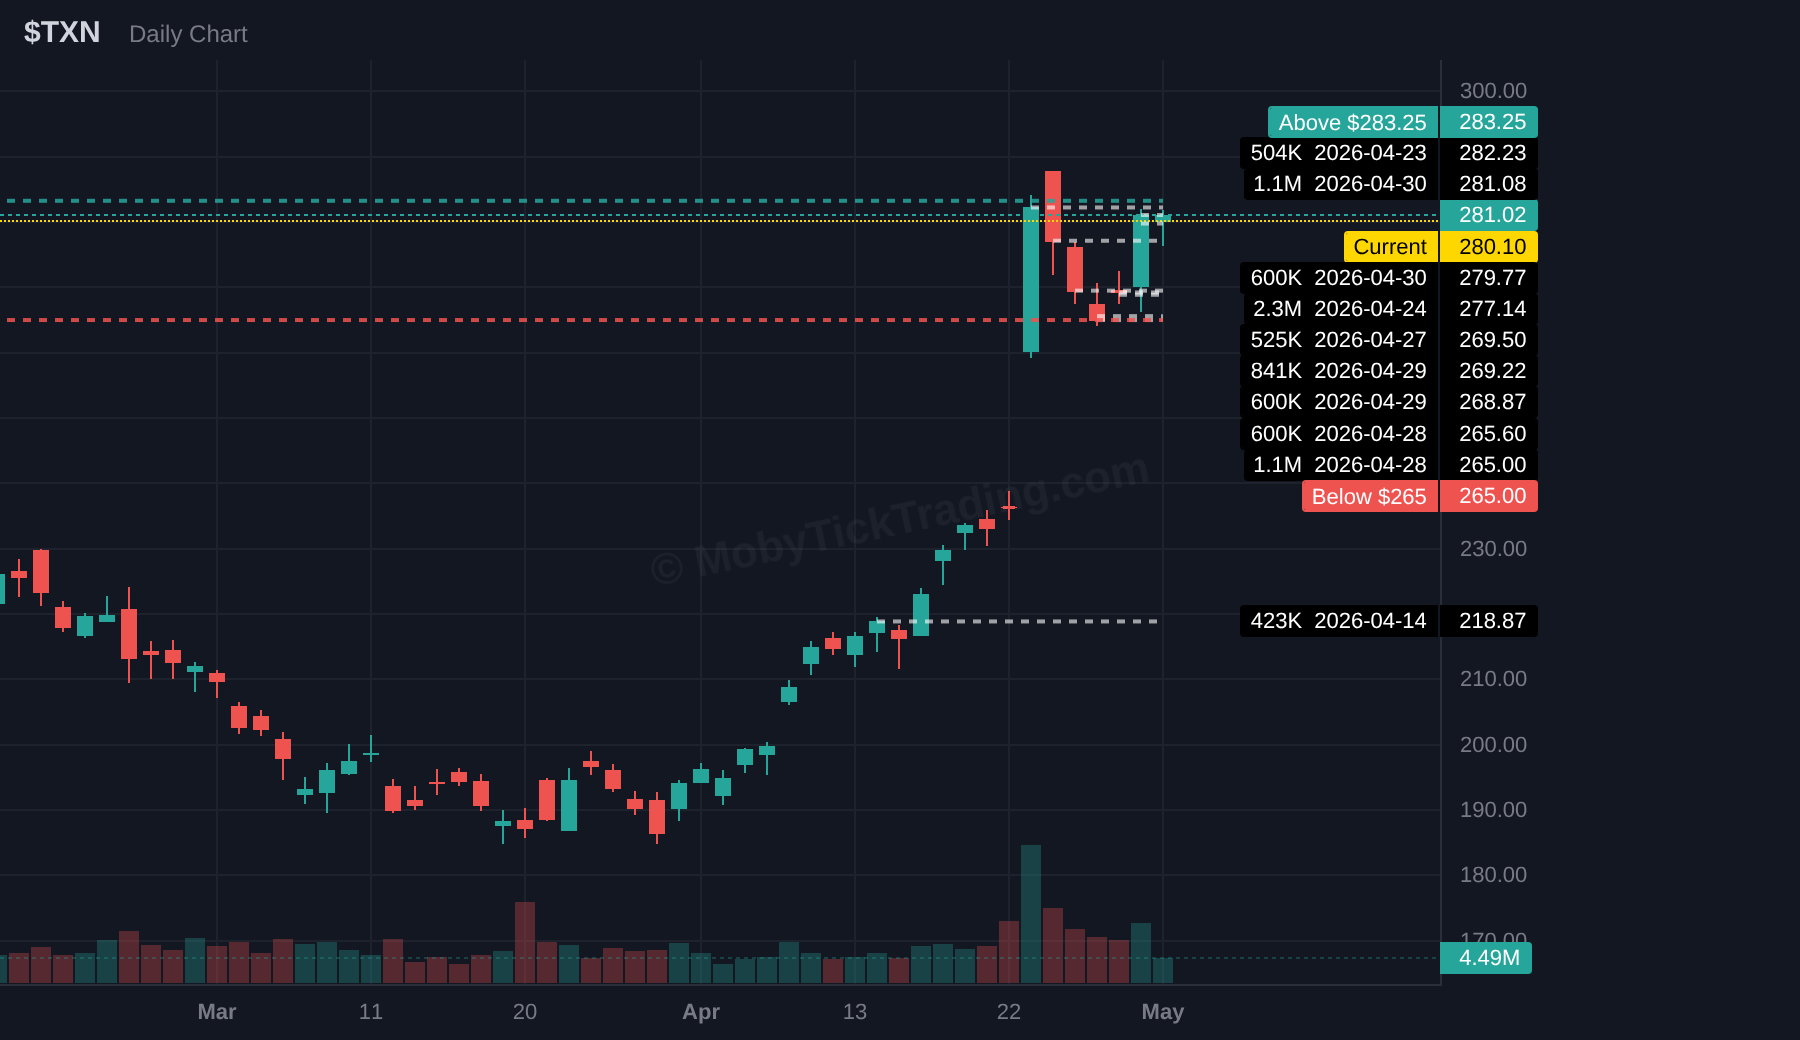
TXN generated $997.0M across 6 prints and finished at 281.02 after trading between 264.24 and 281.92. The stock also carried a relatively elevated 0.49x volume ratio in the weekly candidate screen.
The new ladder begins at 283.25 above and 265 below. That setup keeps the chart close to its actual weekly boundaries and makes TXN a useful semiconductor follow-through name in the report.
Above $283.25 → Targets: $285, $287.5, $290, $295, $300, $305
Below $265 → Targets: $262.5, $260, $255, $250, $240, $230
Dark Pool Context: $226.2M total flow | 1.00M shares | 1 prints | Avg print $226.18
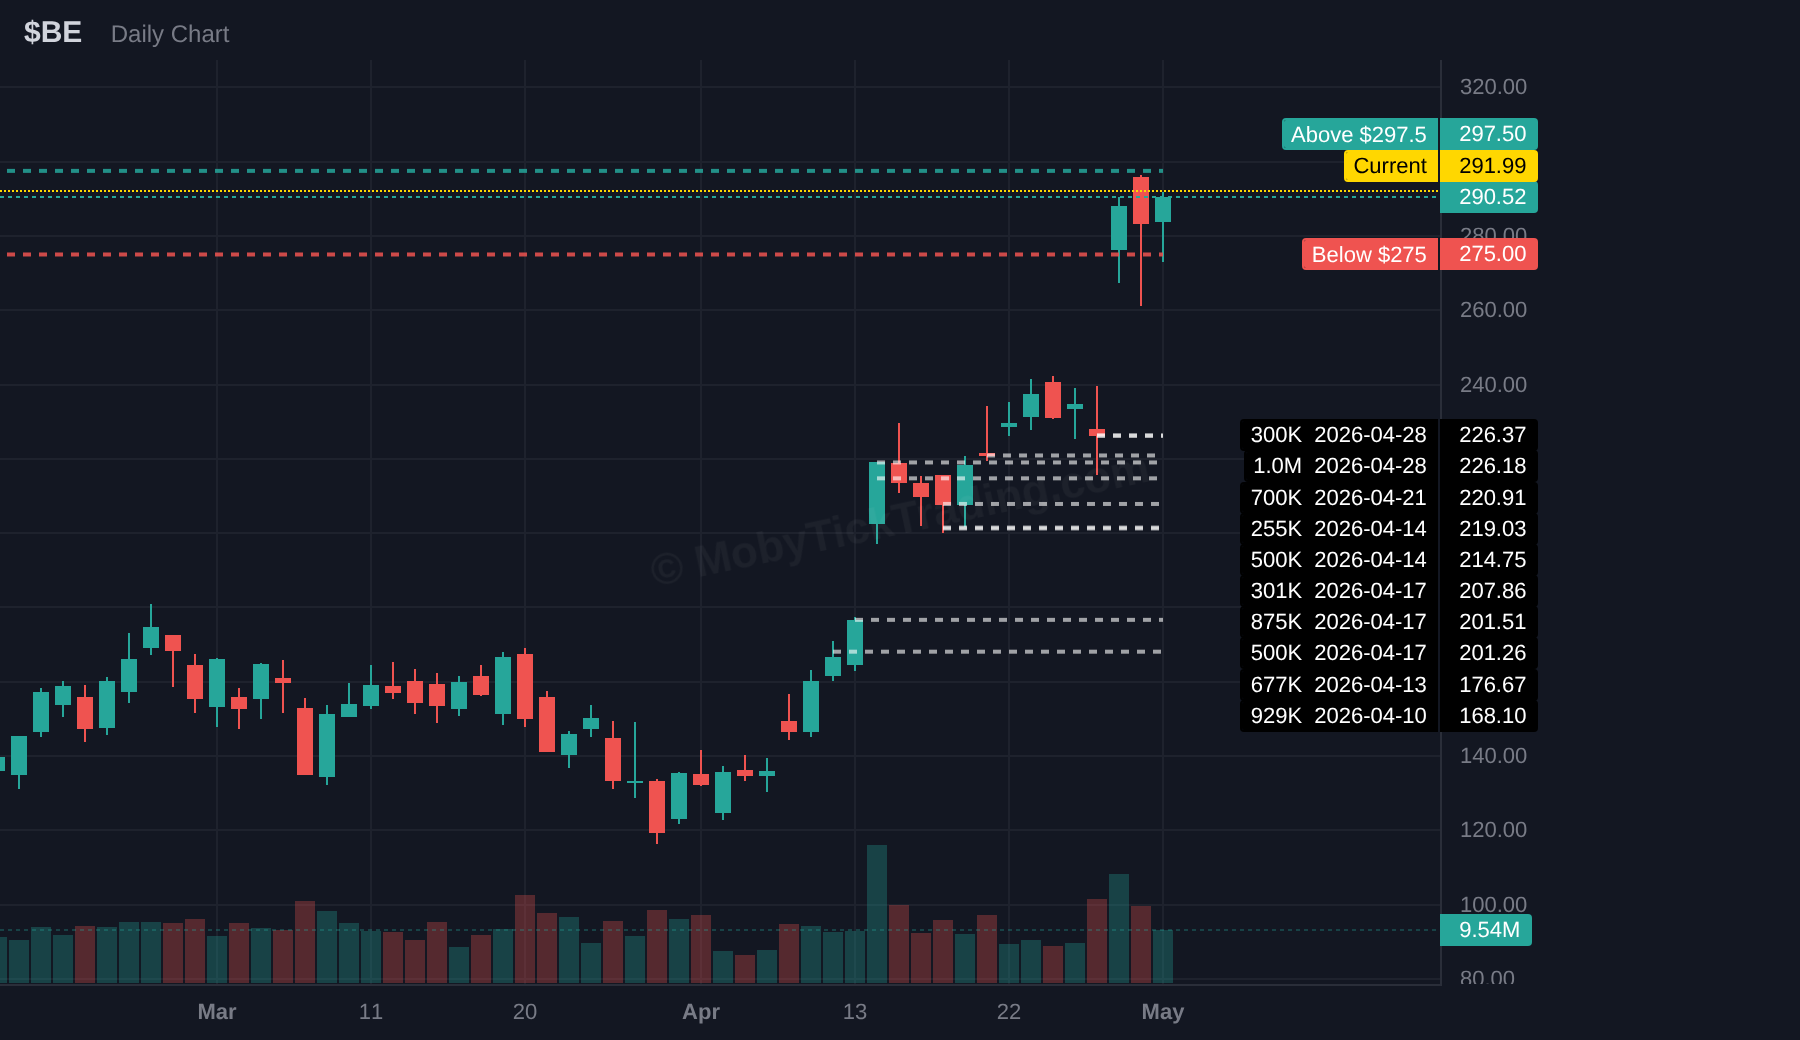
BE is a thinner name than the rest of the slate, but it still posted a real block: 1.00M shares at 226.18 for $226.2M on April 28. Price then expanded sharply, trading between 216.04 and 296.50 before closing at 290.52.
That move makes BE one of the more explosive charts in the issue. The new setup starts at 297.5 above and 275 below, which is appropriate for a name that already showed outsized weekly range expansion.
Above $297.5 → Targets: $300, $312.50, $320, $330, $340, $350
Below $275 → Targets: $270, $260, $250, $240, $235
Earnings week is where dark pool levels become especially useful because they give traders a price map before the event hits. The point is not to predict what a company will say. The point is to know where institutions already transacted size so the reaction can be measured against real reference levels instead of guesswork.
This week’s slate gives several clean examples. AAPL printed $7.01B in dark pool volume and finished the week at 280.14 after trading as high as 287.22. The callout sheet for the new week places the first upside trigger at 285.00 and the first downside trigger at 275.00, which keeps the setup close to both current price and the week’s actual range. NVDA printed $4.43B and closed at 198.45, with the new callout ladder built around 205.00 above and 197.00 below. MSFT printed $2.46B and closed at 414.44, while the fresh setup frames the chart around 415.00 above and 400.00 below.
The same framework applies to outsized movers. INTC was one of the most dramatic names on the board this week, trading from 80.80 to 100.45 and closing at 99.62 after generating $2.53B in dark pool flow. That move is exactly why next week’s callout ladder is wide, with 101.25 on the upside and 91.50 on the downside. The chart already expanded materially; the question for the next report is not whether that move was large, but whether price accepts above the new upper band or rotates back into the lower one.
Next week’s earnings calendar adds more names that fit this approach. PLTR is scheduled for Monday, May 4 after market, AMD for Tuesday, May 5 after market, ARM for Tuesday, May 6 after market, and DIS for Wednesday, May 6 before market. These aren’t all in the callout sheet, but they are useful educational examples because earnings often turn pre-existing institutional levels into clear reaction zones.
That is the practical value of dark pool analysis into earnings: the event can change the speed of the move, but the tape still tends to respect where size already traded. Mark the ladder, compare the reaction to the actual institutional reference zones, and let price show whether it is accepting above or below them.
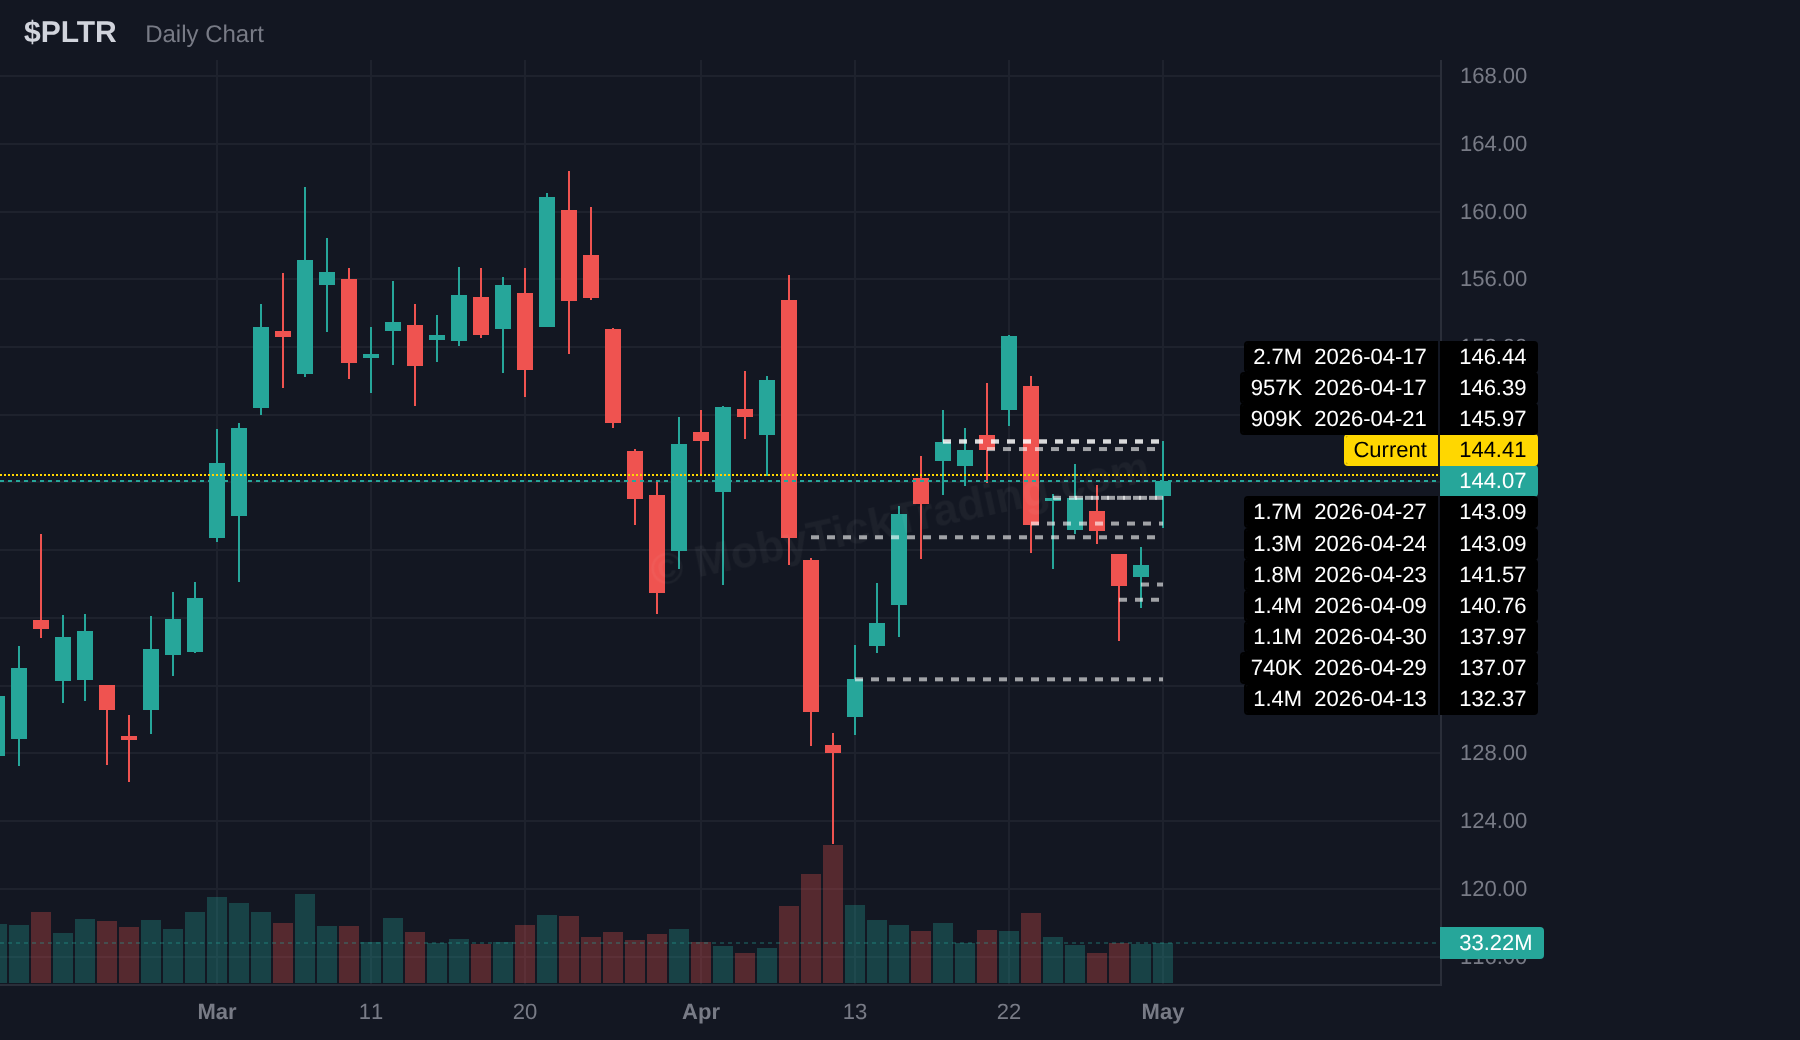
PLTR is set to report after the close on Monday, May 4. The largest dark pool print in the last 30 days was 2.7 million shares at 146.44 on April 17, worth $395.4M. Other notable prints clustered at 141.57 on April 23, 143.09 on April 24 and April 27, and 137.97 on April 30. With current price at 144.41, the 141 to 146 zone is already well defined by recent institutional activity.
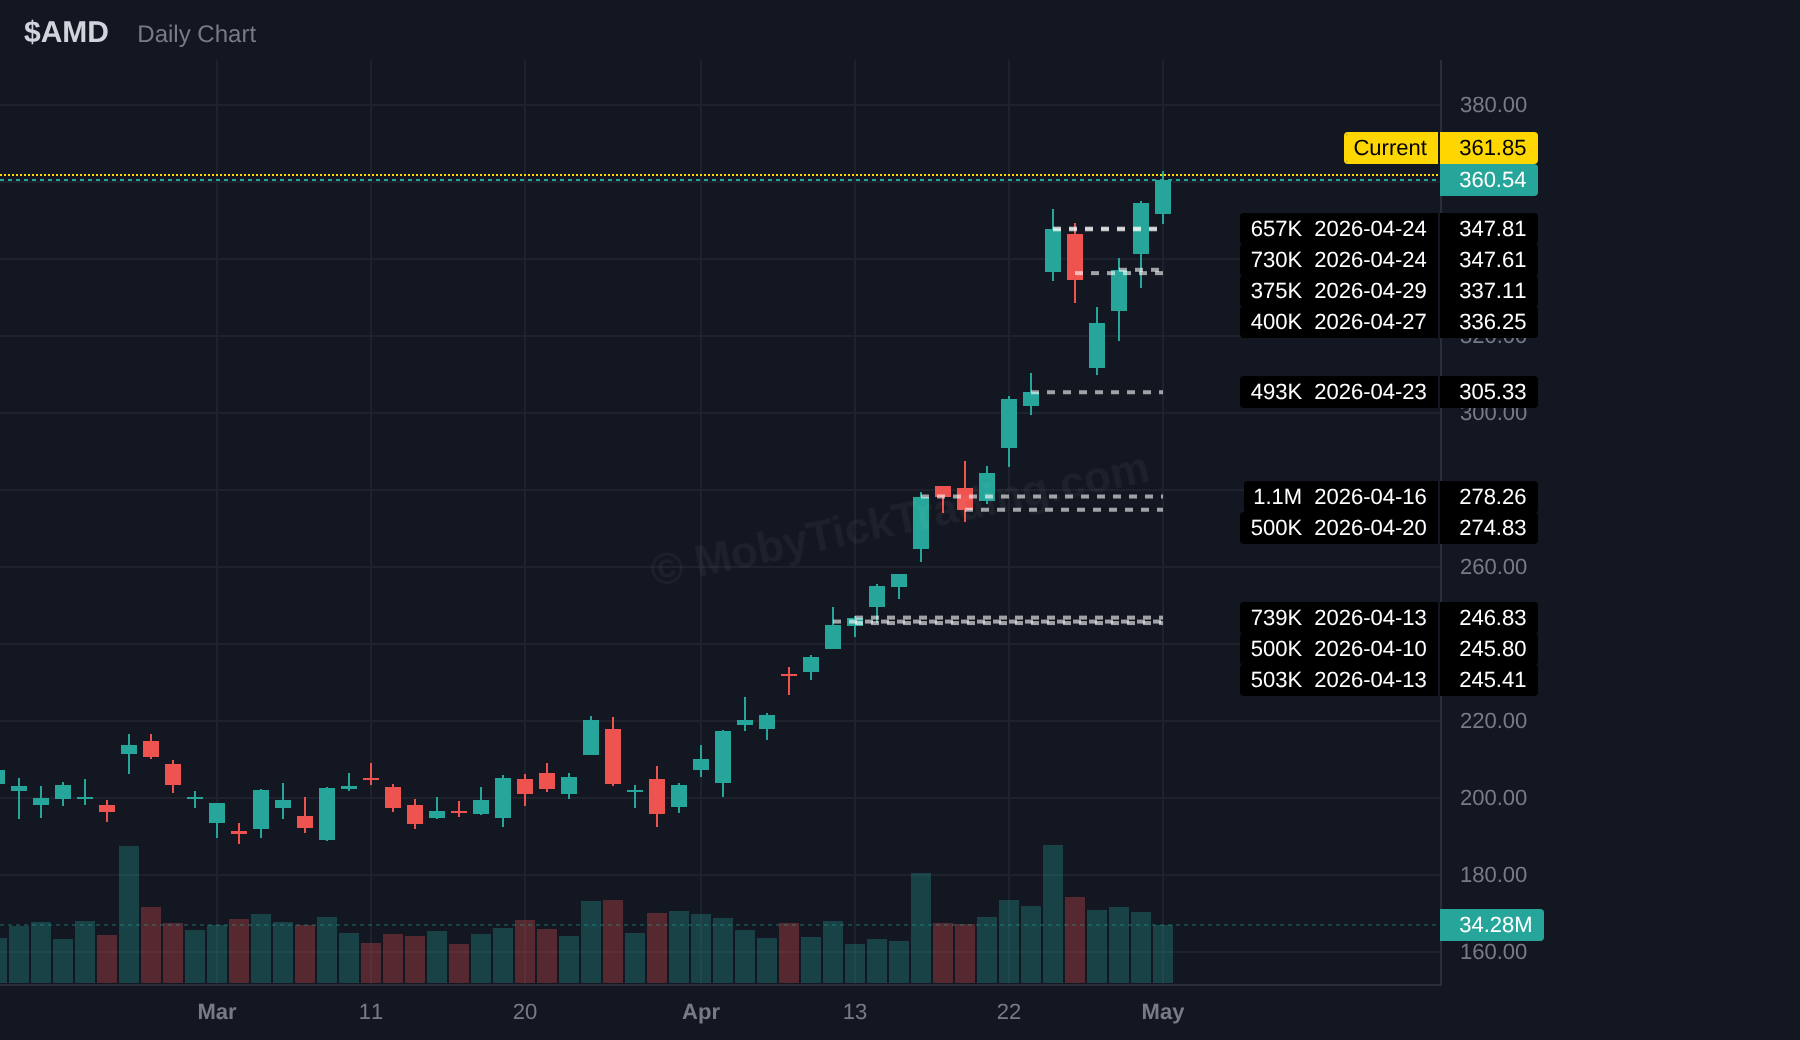
AMD is set to report after the close on Tuesday, May 5. The last 30 days showed a series of large institutional prints, including 1.1 million shares at 278.26 on April 16 for $301.6M, followed by 347.61 and 347.81 on April 24, then 336.25 on April 27 and 337.11 on April 29. With current price at 361.85, the upper 330s to upper 340s zone is one of the clearest recent institutional reference areas on the chart.
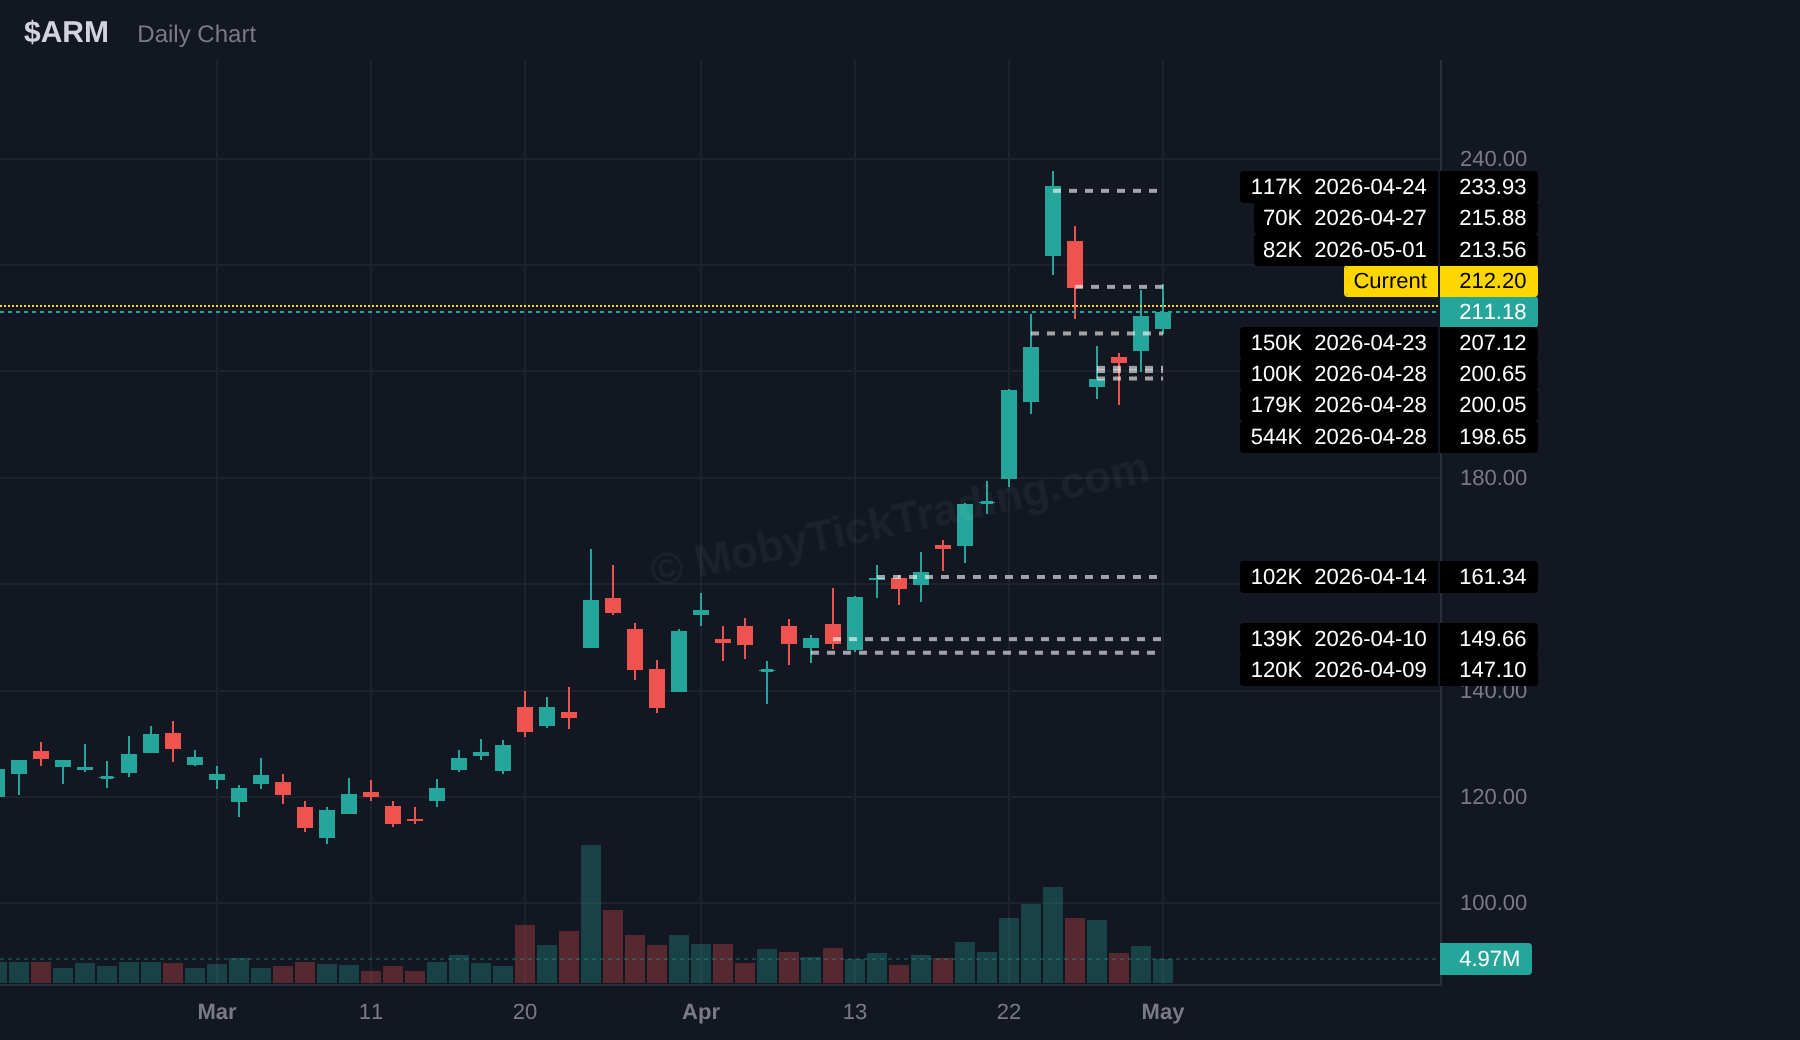
ARM is set to report after the close on Tuesday, May 6. The largest print in the last 30 days was 544K shares at 198.65 on April 28, followed by multiple additional April 28 prints at 200.05 and 200.65. Other notable trades printed at 207.12 on April 23, 233.93 on April 24, and 215.88 on April 27. With current price at 212.20, the chart shows a dense cluster in the 198 to 216 area, making that band a useful institutional reference heading into the release.
Dark pool prints represent off-exchange trade reports filed with FINRA. This report is for informational and educational use only and is not financial advice.