Physical Address
304 North Cardinal St.
Dorchester Center, MA 02124
Physical Address
304 North Cardinal St.
Dorchester Center, MA 02124

Institutional dark pool positioning for April 27–May 1, 2026, including market overview, sector flow, scorecard review, and week-ahead trade setups for SPY, QQQ, IWM, GOOGL, AMZN, XLU, UNH, MSFT, NVDA, CNQ, EPD, AES, and GLXY.
Week of April 27–May 1, 2026
Follow the Money. See What Others Can’t.
MobyTick Trading weekly dark pool report. This draft covers institutional positioning from the prior week and maps the trade setup levels for the week ahead.
| Ticker | Bull Trigger | Result | Bear Trigger | Result |
|---|---|---|---|---|
| SPY | $712.50 | Fired T0 (714.47) | $700.00 | Missed ($702.28) |
| QQQ | $650.00 | Fired T0-T5 (664.51) | $640.00 | Missed ($642.21) |
| IWM | $277.50 | Fired T0 (279.79) | $270.00 | Missed ($271.95) |
| GLXY | $26.50 | Fired T0-T2 (27.13) | $23.50 | Missed ($24.86) |
| MU | $470.00 | Fired T0-T3 (506.99) | $442.50 | Fired T0-T2 (435.90) |
| VTR | $86.00 | Missed ($85.61) | $84.25 | Fired T0-T4 (80.51) |
| CVNA | $390.00 | Fired T0-T4 (416.88) | $355.00 | Missed ($383.11) |
| APG | $47.50 | Fired T0-T2 (49.37) | $44.50 | Missed ($46.62) |
| MRVL | $140.00 | Fired T0-T5 (170.84) | $128.50 | Missed ($143.93) |
| IBIT | $44.00 | No score data | $41.00 | No score data |
| NVDA | $202.50 | Fired T0-T3 (210.95) | $197.50 | Fired T0 (197.22) |
| WULF | $21.00 | Fired T0 (21.60) | $19.00 | Missed ($19.44) |
Data verified after Friday April 24, 2026 market close.
S&P 500 and Nasdaq both set new intraday AND closing records on Friday. The Nasdaq surged 398 points, powered by Intel’s 20%+ spike on blockbuster earnings. Seven of 11 S&P sectors finished lower on Friday despite the records — narrow leadership in Technology (XLK +2.7%).
Oil prices eased Friday on reports of potential Iran peace talks this weekend in Pakistan, but WTI still finished up 14% for the week. Iran seized ships attempting to pass through the Strait of Hormuz.
VIX fell to 18.76 intraday — market participants embracing long stocks / short volatility even with geopolitical risk still live.
Consumer sentiment final at 49.8 was worse than expected and well below March’s 53.3 — near June 2022 trough levels. 5-year inflation expectations ticked up to 3.5%.
• Intel (INTC): +20%+ — new record high after beat-and-raise Q1 earnings. AI CPU demand cited. Phill semiconductor index (SOX) hit record high — 18th straight session of gains, up 38% in April and 47% YTD.
• AMD: +13-14% on semiconductor momentum.
• Nvidia (NVDA): +4.30% to close near $208, briefly retaking $5 trillion market cap.
• Salesforce (CRM): Recovered ~3% after 8-9% drop earlier in week on guidance concerns.
• Amazon (AMZN): +3.47% — one of Friday’s top gainers.
• Merck (MRK): -2.42%, Verizon (VZ): -1.61%, Walmart (WMT): -1.60% — Friday’s biggest decliners.
• Global equity fund inflows surged to $48.72 billion in the week through April 22 — the largest weekly sum since November 13, 2024 (17-month high).
• AI optimism and robust Q1 earnings from major U.S. banks drove flows.
• Technology continued doing the heavy lifting; 7 of 11 sectors closed lower on Friday despite index records.
• Earnings: Over 200 S&P 500 companies reporting (~42% of index), including 5 of 7 Mag 7: AAPL, AMZN, GOOGL, META, MSFT
• Central banks: 9 policy decisions — FOMC, BoJ, ECB, BoC, Norges Bank, Riksbank, BCB, Banxico
• Data: Q1 GDP advance estimate, Core PCE price index (Fed’s preferred gauge), Chicago PMI, ISM Manufacturing PMI
*Sources: CNBC (4/24 close recap), Investrade market review 4/24, Trading Economics, Schwab, Stockanalysis — all verified post-close April 24, 2026*
| ETF | Value | # Prints |
|---|---|---|
| SPY | $6.6B | 12 |
| QQQ | $5.4B | 7 |
| AAPL | $3.2B | 16 |
| NVDA | $3.0B | 18 |
| VOO | $2.9B | 6 |
| Sector | Value | Signal |
|---|---|---|
| XLK (Technology) | $770.7M | Single large block |
| XLE (Energy) | $668.3M | Elevated geopolitical risk premium |
| XLF (Financials) | $662.8M | Broad-based participation |
| XLI (Industrials) | $538.1M | Moderate exposure |
| XLU (Utilities) | $472.9M | Defensive bid active |
| XLV (Healthcare) | $427.4M | Quiet vs energy/tech |
| XBI (Biotech) | $148.3M | Single print |
| XLB (Materials) | $127.6M | Limited activity |
| XLP (Staples) | $33.4M | Minimal participation |
| XLRE (Real Estate) | $31.5M | Lightest sector |
| Ticker | Trigger | T1 | T2 | T3 | T4 | T5 | T6 | T7 |
|---|---|---|---|---|---|---|---|---|
| SPY | $715.00 | $717.50 | $720.00 | $722.50 | $725.00 | $730.00 | ||
| QQQ | $665.00 | $667.50 | $670.00 | $672.50 | $675.00 | $680.00 | ||
| IWM | $278.50 | $280.00 | $282.50 | $285.00 | $287.50 | $290.00 | ||
| GOOGL | $345.00 | $347.50 | $350.00 | $352.50 | $355.00 | $360.00 | ||
| AMZN | $265.00 | $270.00 | $272.50 | $275.00 | $280.00 | |||
| XLU | $46.50 | $47.50 | $50.00 | $51.25 | $52.50 | $55.00 | ||
| UNH | $360.00 | $365.00 | $370.00 | $375.00 | $380.00 | |||
| MSFT | $425 | $427.5 | $430 | $435 | $440 | $450 | ||
| NVDA | $211.25 | $215 | $217.50 | $220 | $225 | $227.5 | $230 | |
| CNQ | $46 | $47 | $48 | $49 | $50 | $51.25 | $52.5 | |
| EPD | $38.25 | $39.00 | $40.00 | $41.25 | $42.50 | $43.25 | $45.00 | |
| AES | $14.60 | $15.00 | $15.20 | $15.50 | $15.80 | $16.00 | ||
| GLXY | $27.25 | $28.00 | $29.00 | $30.00 | $31.25 | $32.50 |
| Ticker | Trigger | T1 | T2 | T3 | T4 | T5 | T6 | T7 |
|---|---|---|---|---|---|---|---|---|
| SPY | $700.00 | $697.50 | $695.00 | $692.50 | $690.00 | $687.50 | $685.00 | |
| QQQ | $645.00 | $642.50 | $640.00 | $637.50 | $635.00 | $630.00 | $625.00 | $620.00 |
| IWM | $272.50 | $270.00 | $268.75 | $265.00 | $262.50 | $260.00 | ||
| GOOGL | $332.00 | $330.00 | $327.50 | $325.00 | $322.50 | $320.00 | ||
| AMZN | $249.00 | $247.50 | $245.00 | $242.50 | $240.00 | $235.00 | $230.00 | |
| XLU | $45.75 | $45.00 | $44.00 | $43.00 | $42.00 | |||
| UNH | $345.00 | $340.00 | $335.00 | $330.00 | $325.00 | $320.00 | $310.00 | |
| MSFT | $415 | $412.5 | $410 | $405 | $400 | $390 | $380 | |
| NVDA | $199 | $197.5 | $195 | $190 | $185 | $180 | $170 | |
| CNQ | $43.50 | $42.50 | $41.25 | $40 | $39 | |||
| EPD | $36.50 | $36.00 | $35.00 | $34.00 | $33.00 | $32.00 | ||
| AES | $14.37 | $14.00 | $13.80 | $13.50 | $13.00 | $12.50 | ||
| GLXY | $25.00 | $24.00 | $23.00 | $22.00 | $21.00 | $20.00 |
Dark Pool Context: $6.6B dark pool flow | 9.35M shares | 12 prints
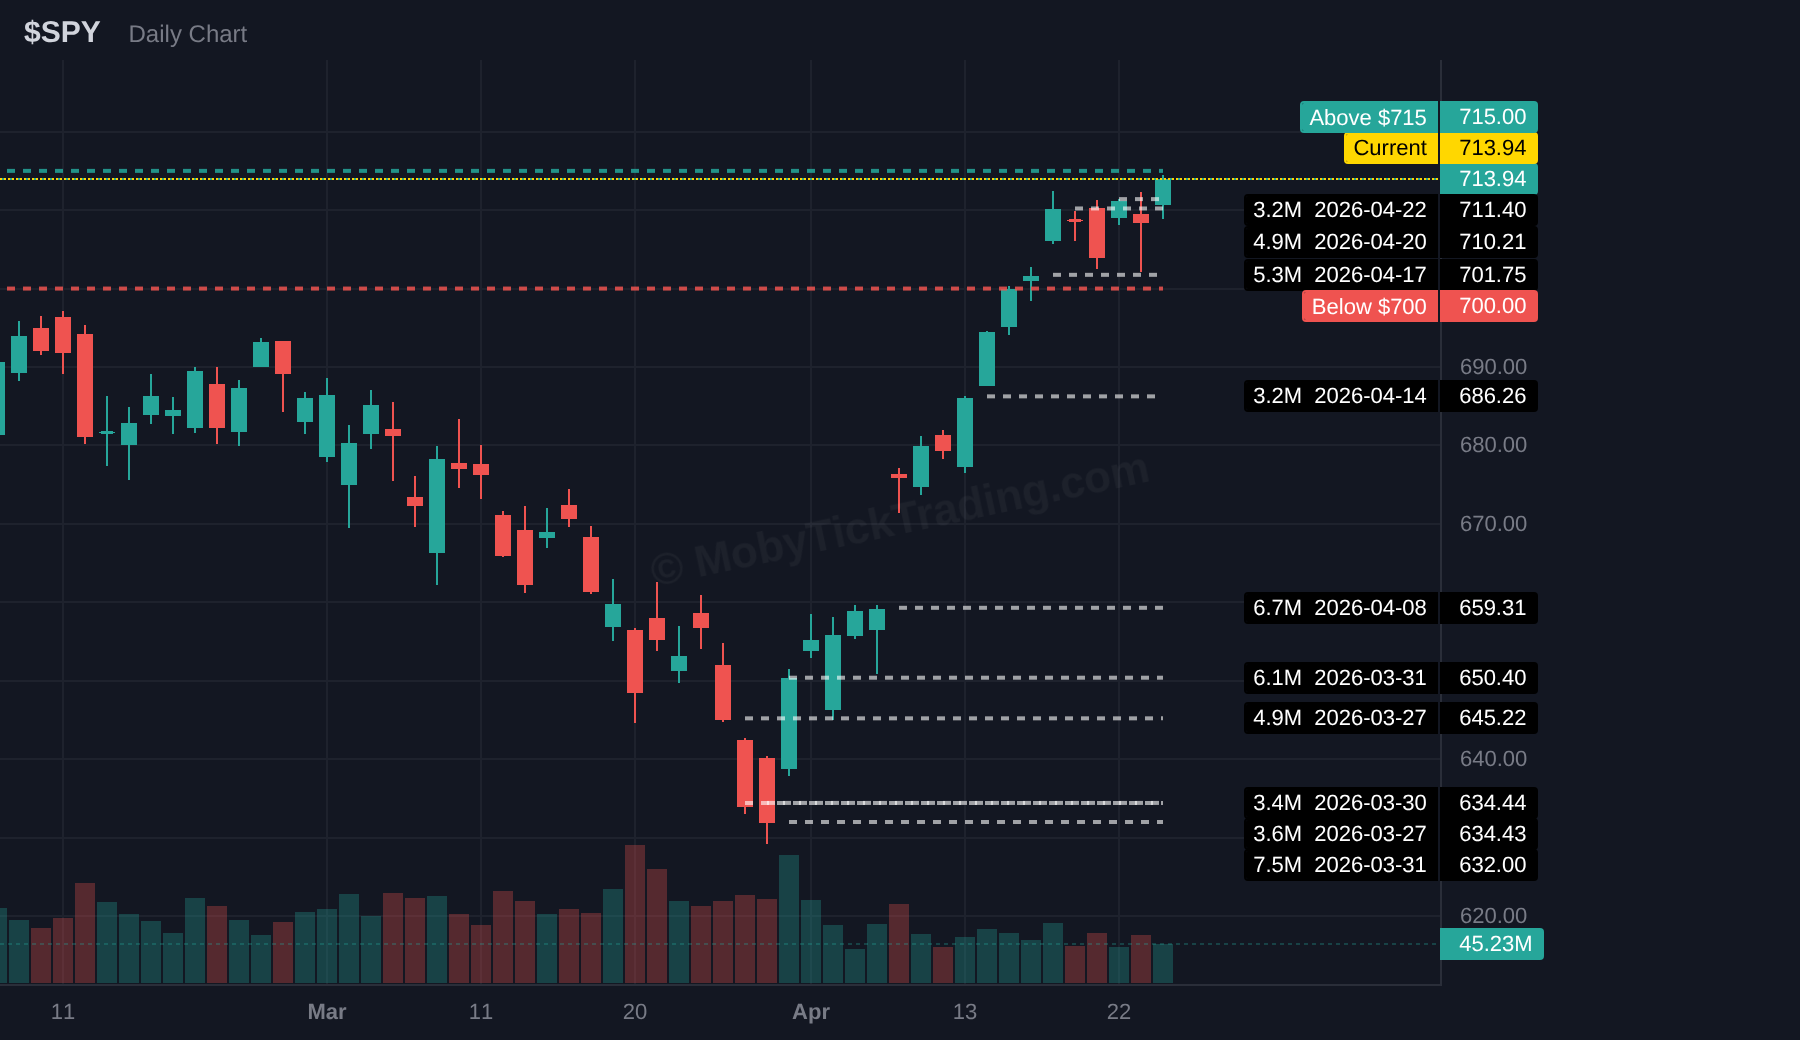
SPY remains the broad-market reference heading into a heavy earnings and macro week. Recent dark pool activity near the 710-711 zone keeps institutions in view close to current price, while larger legacy prints lower on the chart still define deeper support context. Above 715.00 is the upside decision level for the week ahead, while 700.00 is the lower institutional reference if volatility expands.
Above $715.00 → Targets: $717.50, $720.00, $722.50, $725.00, $730.00
Below $700.00 → Targets: $697.50, $695.00, $692.50, $690.00, $687.50, $685.00
Dark Pool Context: $5.4B dark pool flow | 8.38M shares | 7 prints
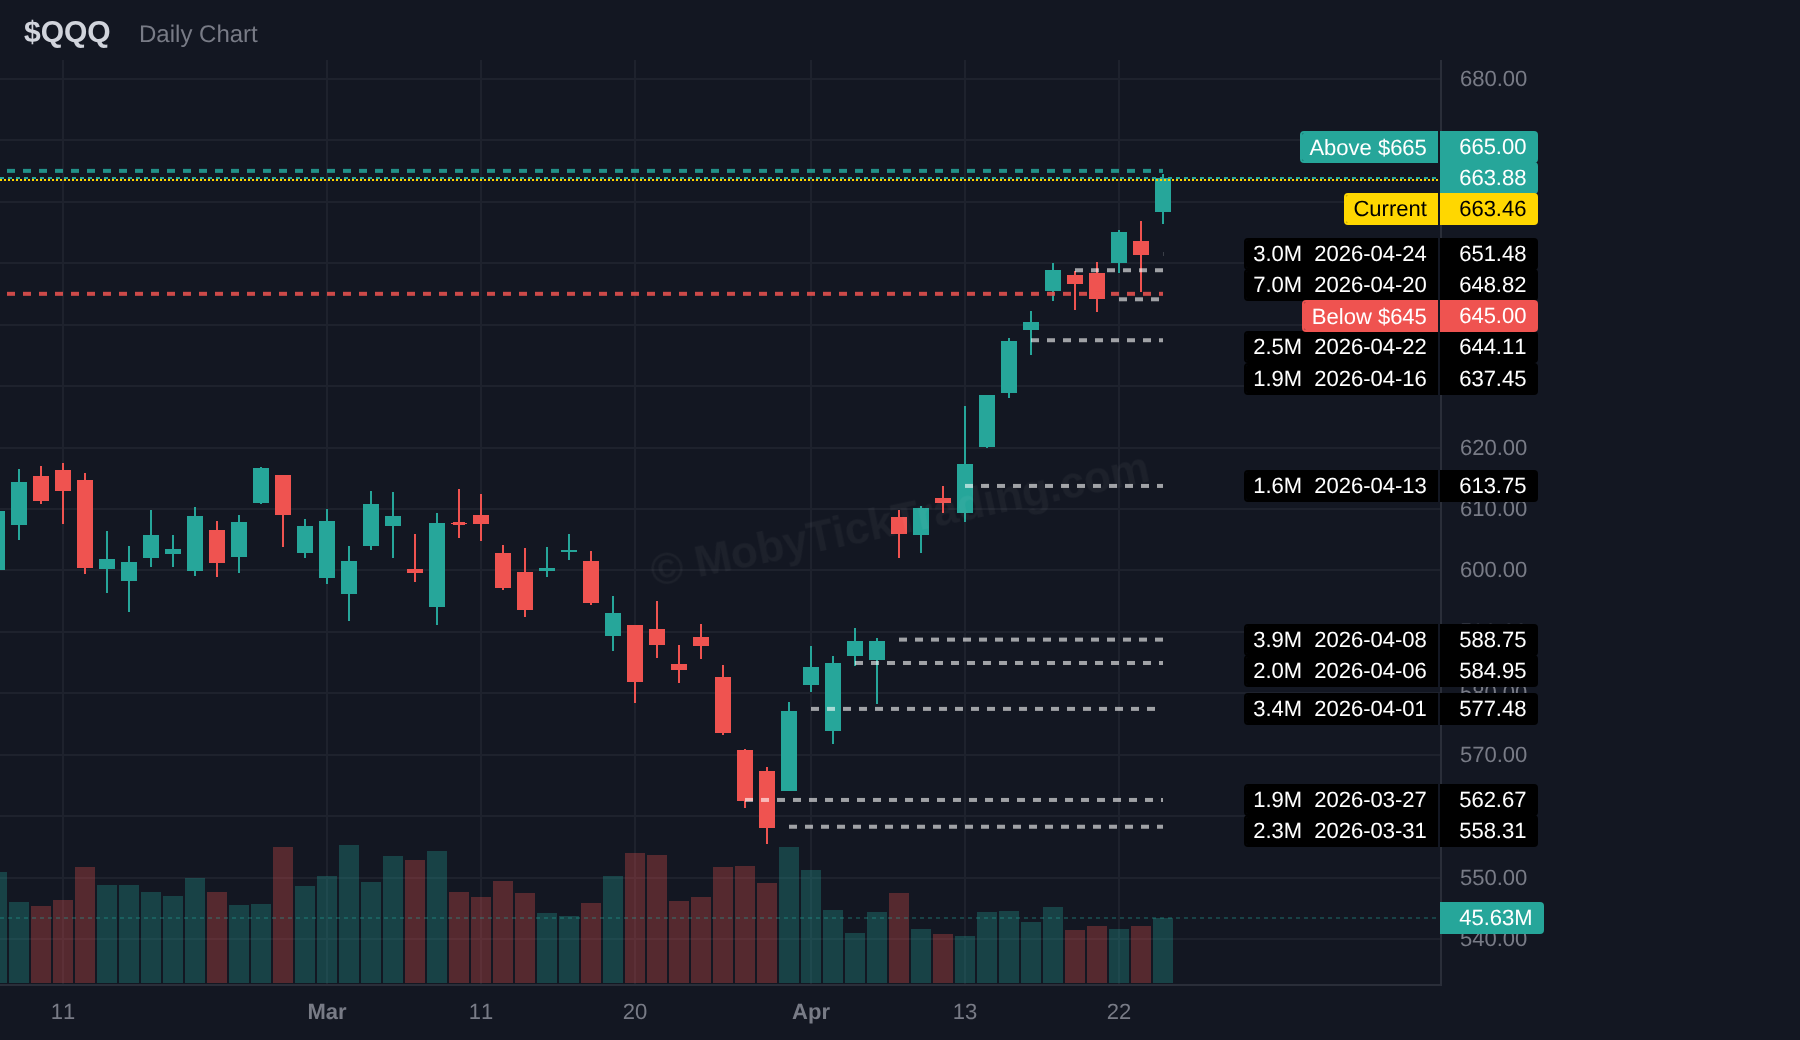
QQQ stays at the center of the tape with large-cap tech earnings approaching. Dark pool participation remains concentrated in the Nasdaq complex, and the chart carries several large institutional reference levels beneath current price. For the week ahead, 665.00 is the key upside decision zone, while 645.00 marks the lower reference if the earnings reaction weakens.
Above $665.00 → Targets: $667.50, $670.00, $672.50, $675.00, $680.00
Below $645.00 → Targets: $642.50, $640.00, $637.50, $635.00, $630.00, $625.00, $620.00
Dark Pool Context: $748.9M dark pool flow | 2.71M shares | 5 prints
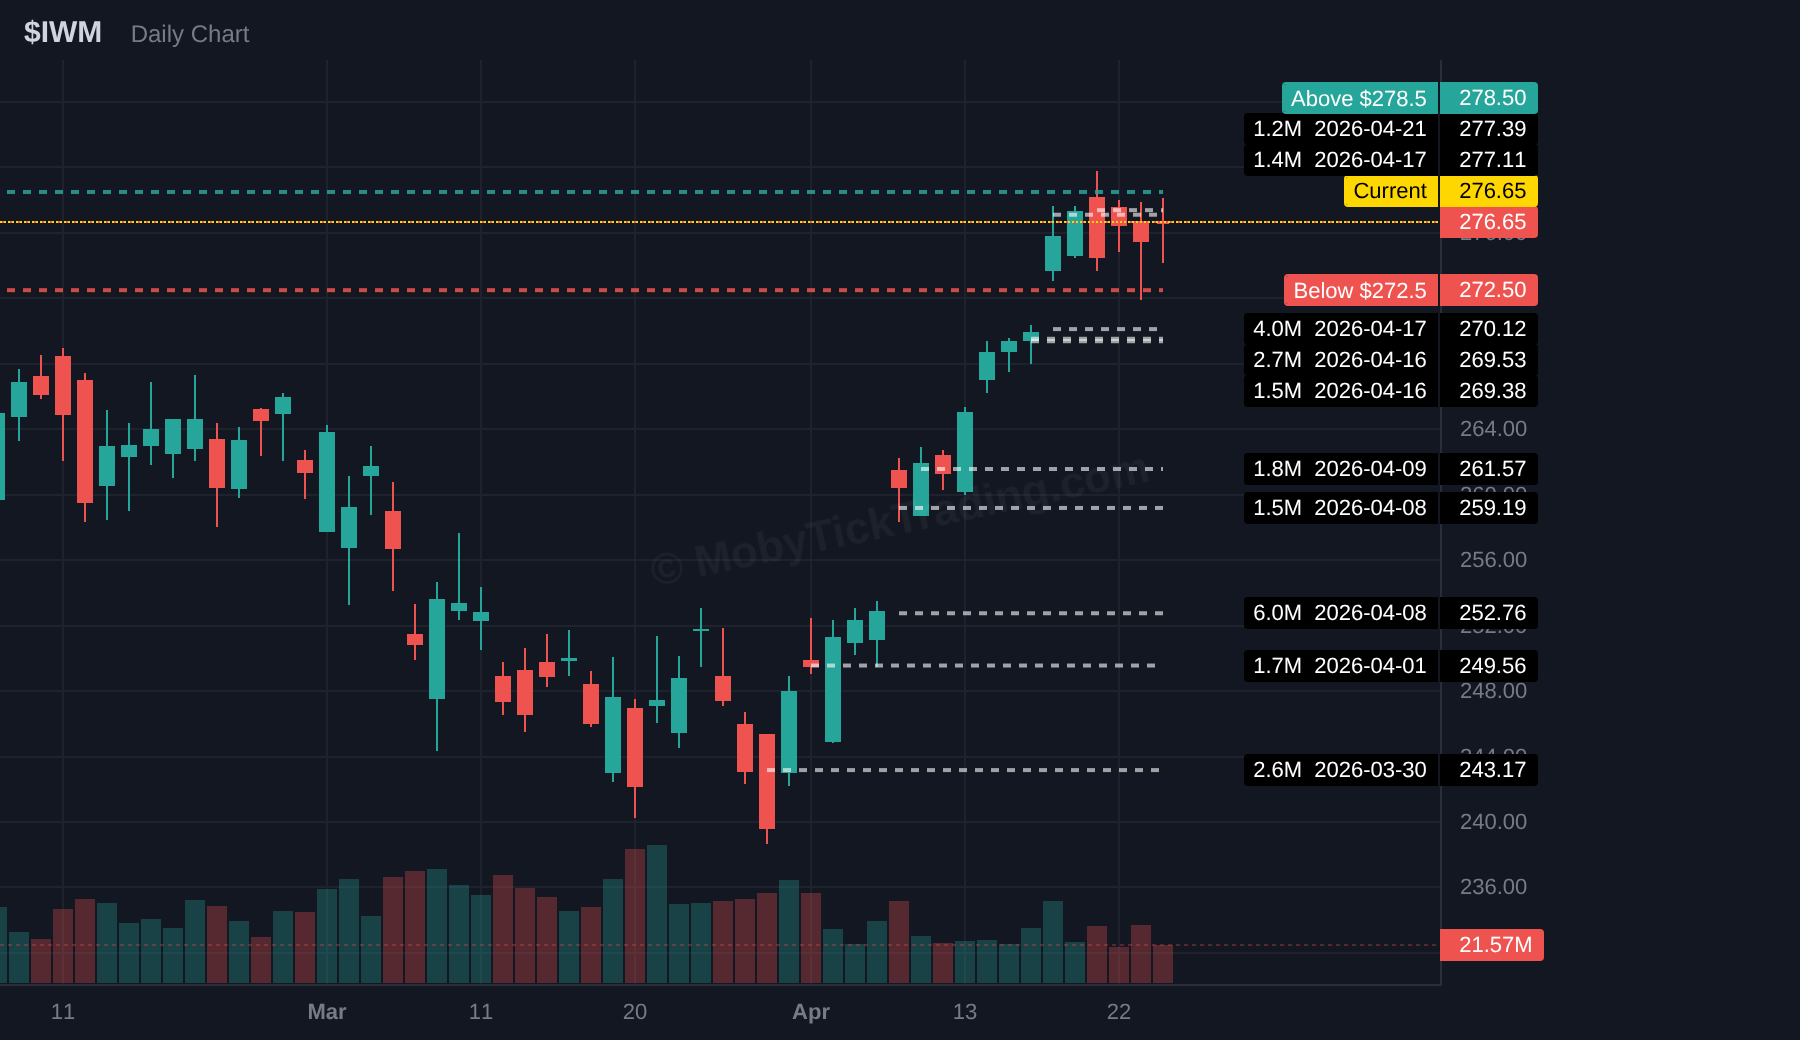
IWM is the read on whether participation broadens beyond mega-cap leadership. Recent dark pool levels are more spread out than in SPY or QQQ, making the current range especially useful for mapping next week. Above 278.50 is the level to watch for broader participation, while 272.50 marks the lower decision zone if small-cap momentum fades.
Above $278.50 → Targets: $280.00, $282.50, $285.00, $287.50, $290.00
Below $272.50 → Targets: $270.00, $268.75, $265.00, $262.50, $260.00
Dark Pool Context: $1.57B dark pool flow | 4.67M shares | 8 prints
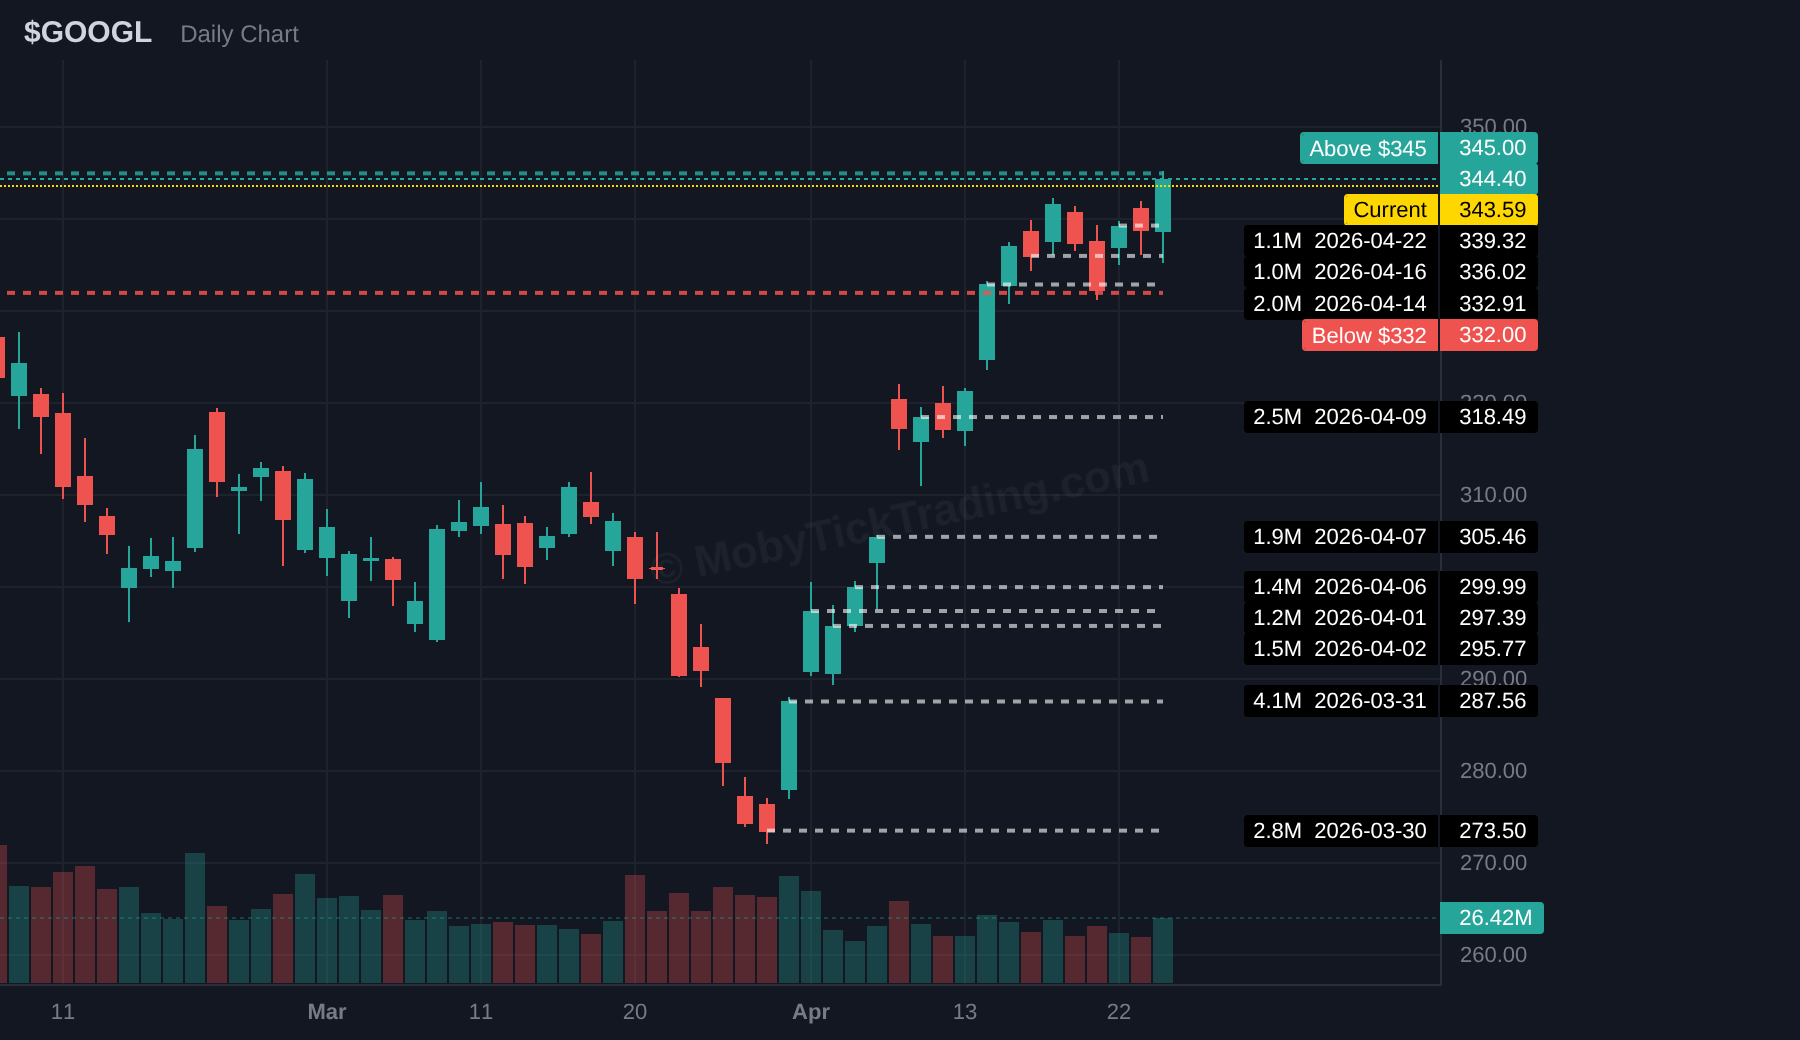
GOOGL heads into earnings with meaningful institutional activity already visible on the chart. The average dark pool execution zone sits below current price, giving the stock a defined support reference while it approaches the upper trigger area. Above 345.00 opens the upside ladder, while 332.00 is the lower institutional line to watch if the reaction is weaker.
Above $345.00 → Targets: $347.50, $350.00, $352.50, $355.00, $360.00
Below $332.00 → Targets: $330.00, $327.50, $325.00, $322.50, $320.00
Dark Pool Context: $1.51B dark pool flow | 5.85M shares | 6 prints
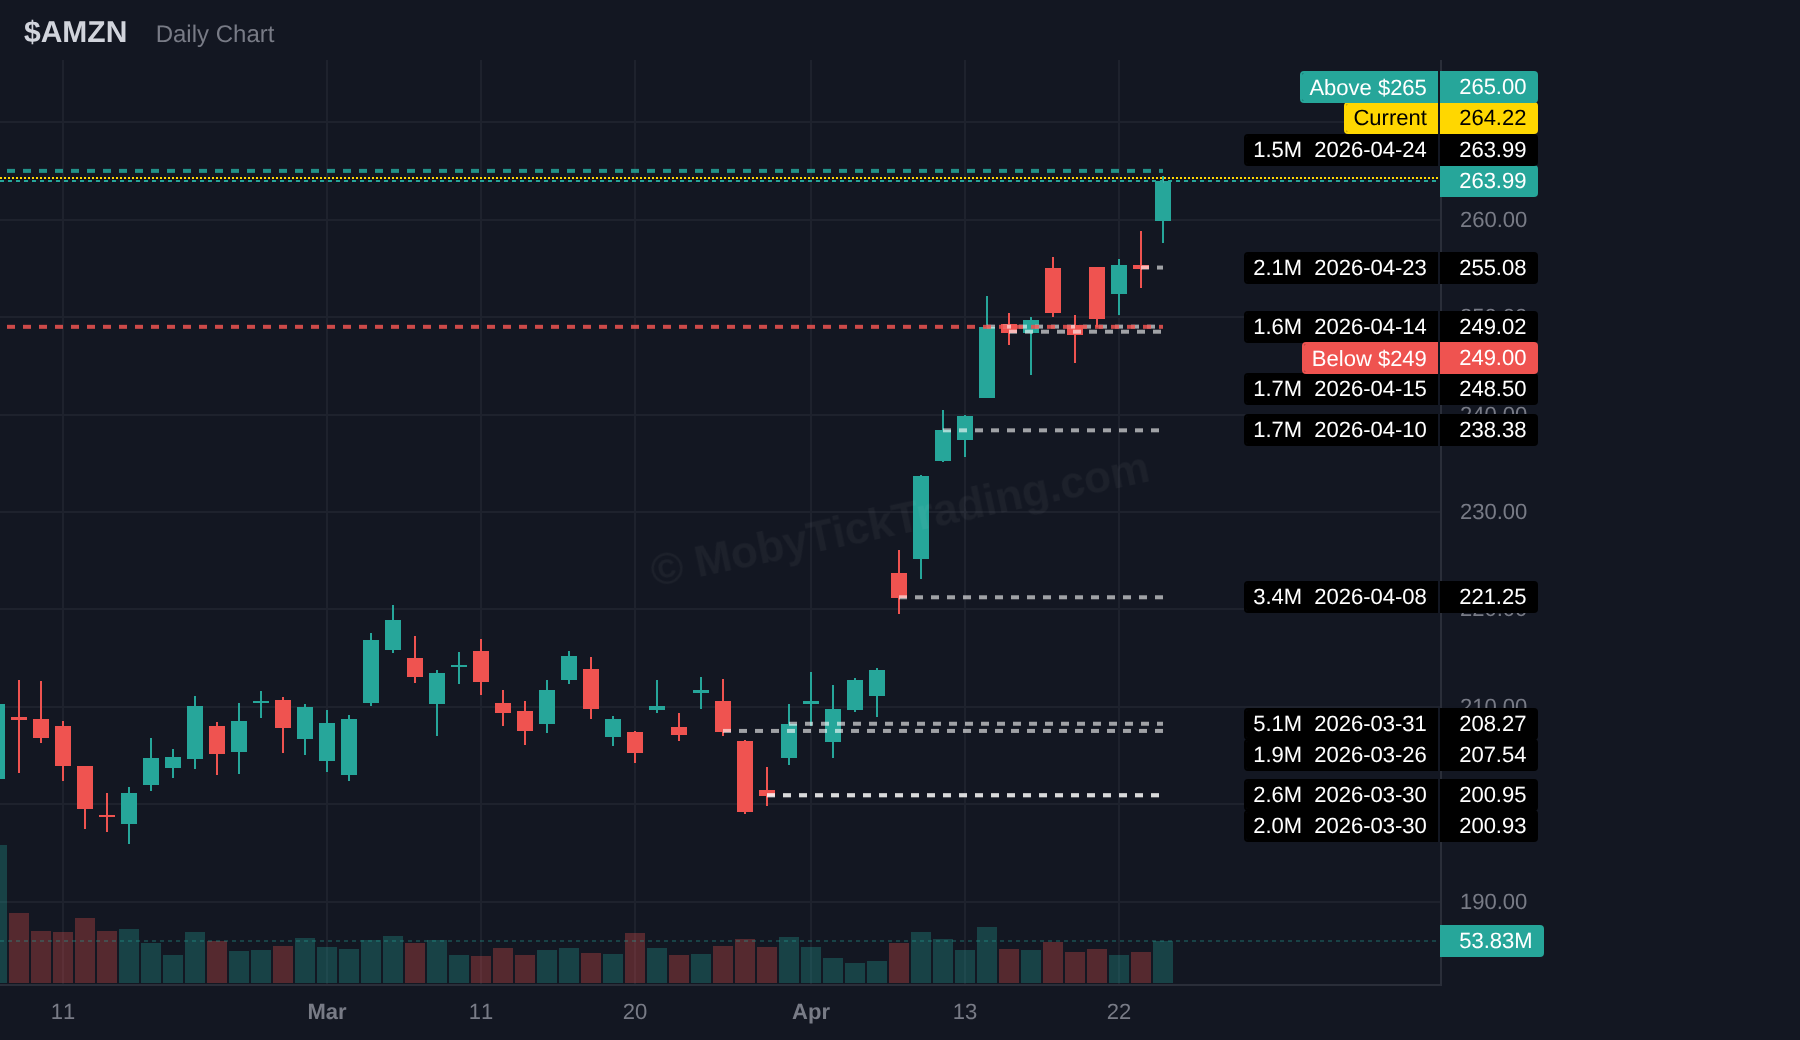
AMZN enters earnings with strong institutional participation and several large recent dark pool levels stacked beneath current price. That gives the chart a clear framework before the event even hits. The upper trigger defines the breakout zone for the new week, while 249.00 is the lower reference if earnings volatility resolves to the downside.
Above $265.00 → Targets: $270.00, $272.50, $275.00, $280.00
Below $249.00 → Targets: $247.50, $245.00, $242.50, $240.00, $235.00, $230.00
Dark Pool Context: $472.9M dark pool flow | 10.34M shares | 6 prints
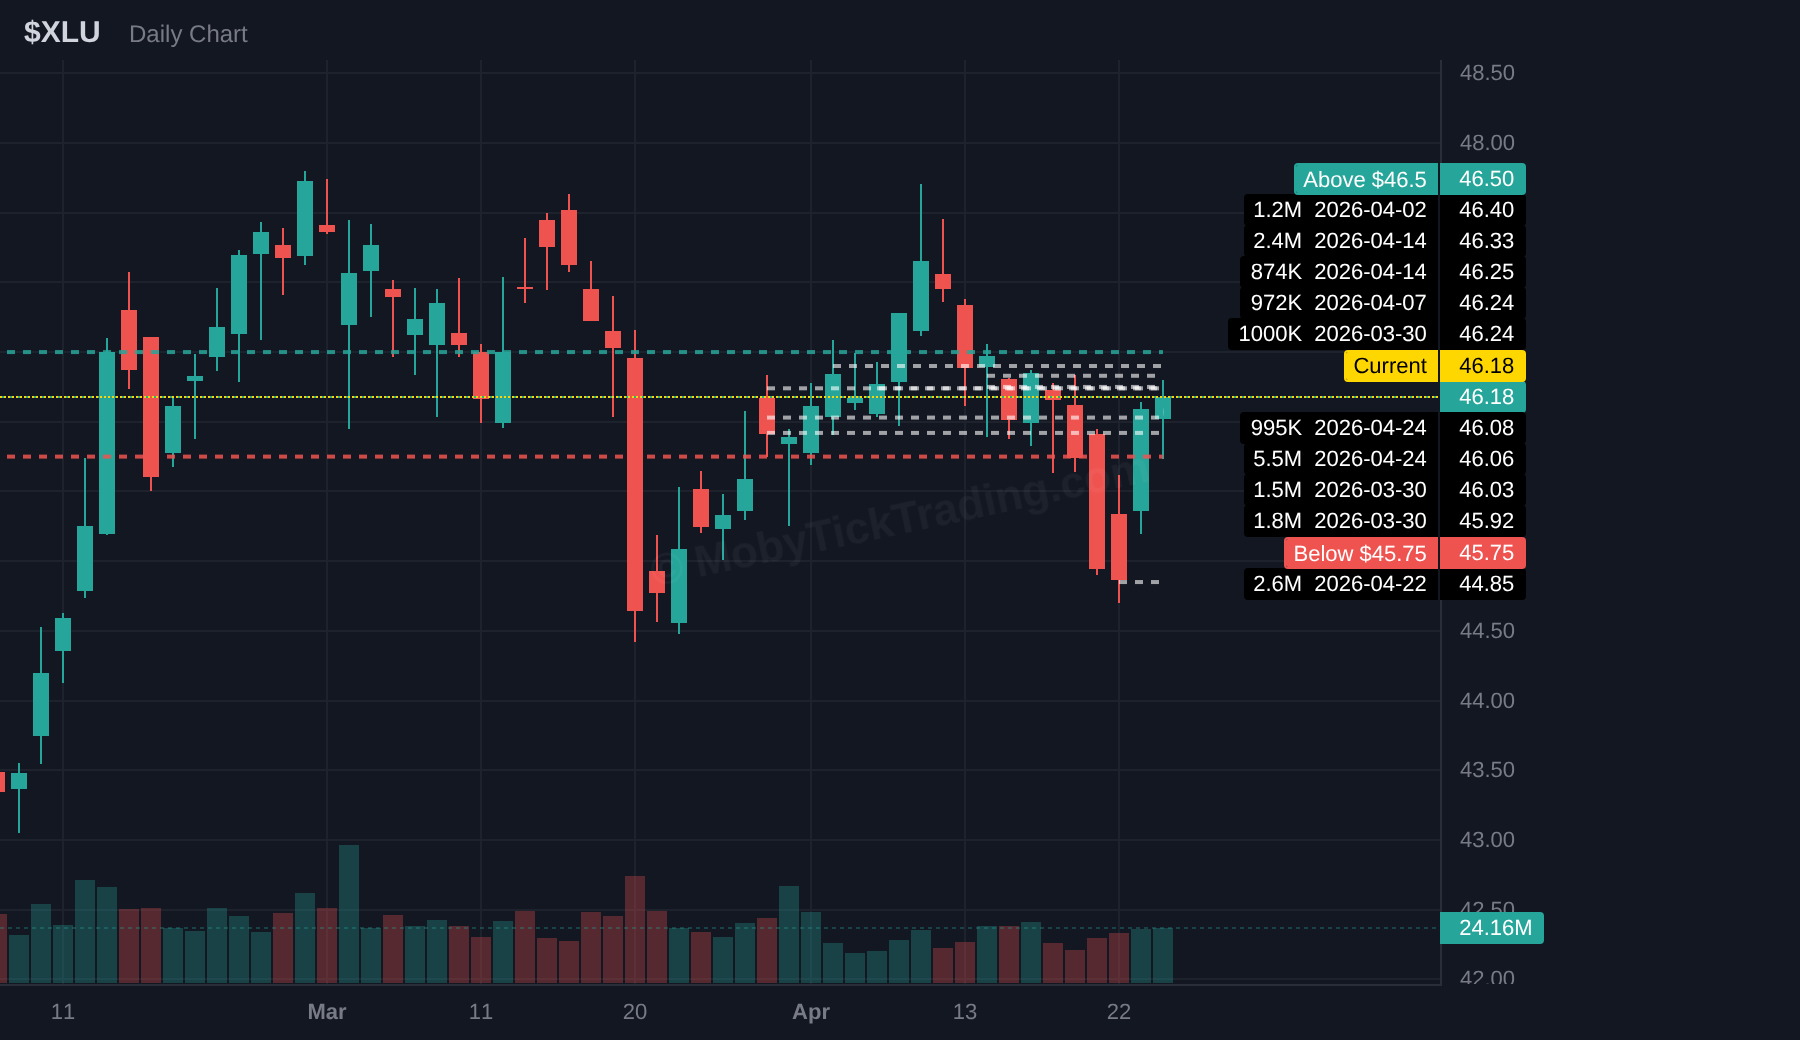
XLU remains the defensive name in the mix, with institutions still using utilities exposure while the broader market digests earnings and macro risk. Repeated off-exchange activity sits close to the current range. Above 46.50 is the expansion level if defensive positioning stays active, while 45.75 is the downside reference if risk appetite improves.
Above $46.50 → Targets: $47.50, $50.00, $51.25, $52.50, $55.00
Below $45.75 → Targets: $45.00, $44.00, $43.00, $42.00
Dark Pool Context: $678.8M dark pool flow | 1.96M shares | 3 prints
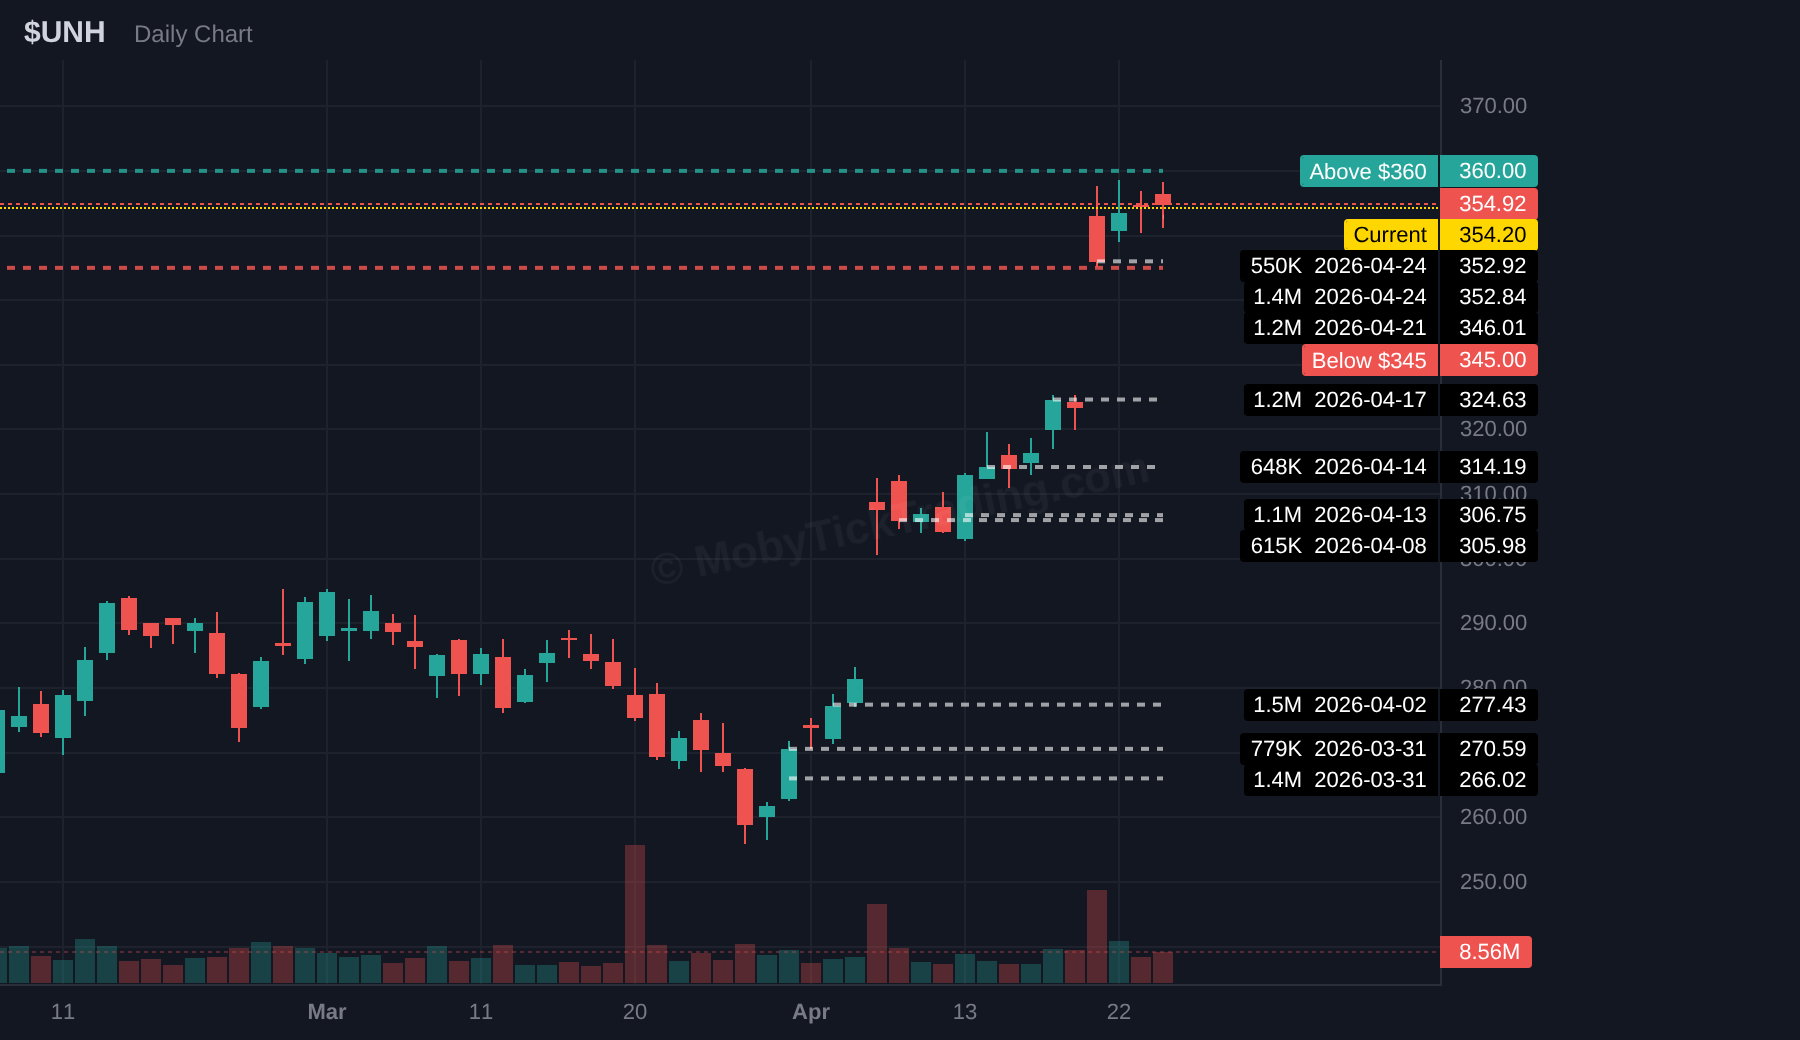
UNH is one of the more event-sensitive charts in the report after the recent dislocation in price. Dark pool activity near the mid-340s gives a visible institutional reference area, but the chart is carrying a much wider range than most names in the issue. Above 360.00 is the first stabilization zone to watch, while 345.00 remains the lower institutional line if volatility continues.
Above $360.00 → Targets: $365.00, $370.00, $375.00, $380.00
Below $345.00 → Targets: $340.00, $335.00, $330.00, $325.00, $320.00, $310.00
Dark Pool Context: $2.07B dark pool flow | 4.91M shares | 8 prints
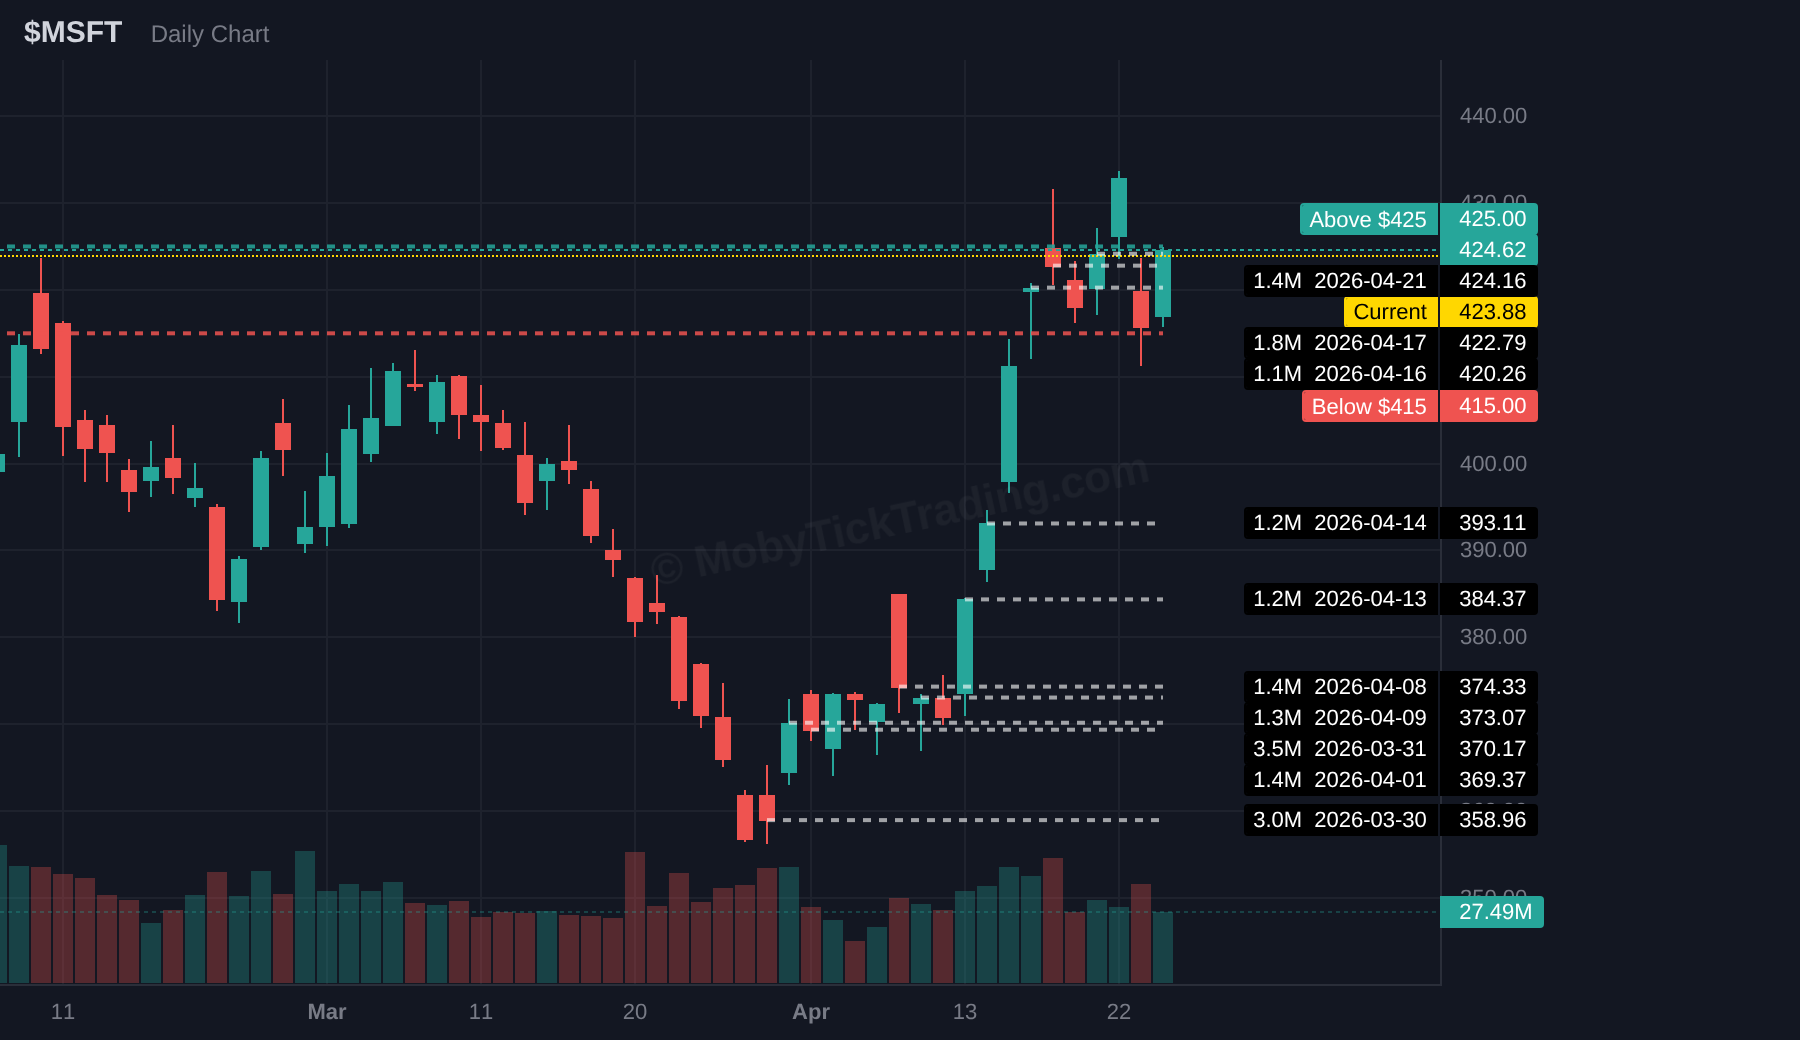
MSFT goes into earnings with one of the strongest institutional footprints in the report. Multiple large dark pool executions near the 420-424 zone leave a clean reference area just under current price. Above 425.00 defines the next upside acceptance area, while 415.00 is the lower support line if earnings volatility pushes the stock back into that institutional zone.
Above $425 → Targets: $427.5, $430, $435, $440, $450
Below $415 → Targets: $412.5, $410, $405, $400, $390, $380
Dark Pool Context: $3.02B dark pool flow | 14.80M shares | 18 prints
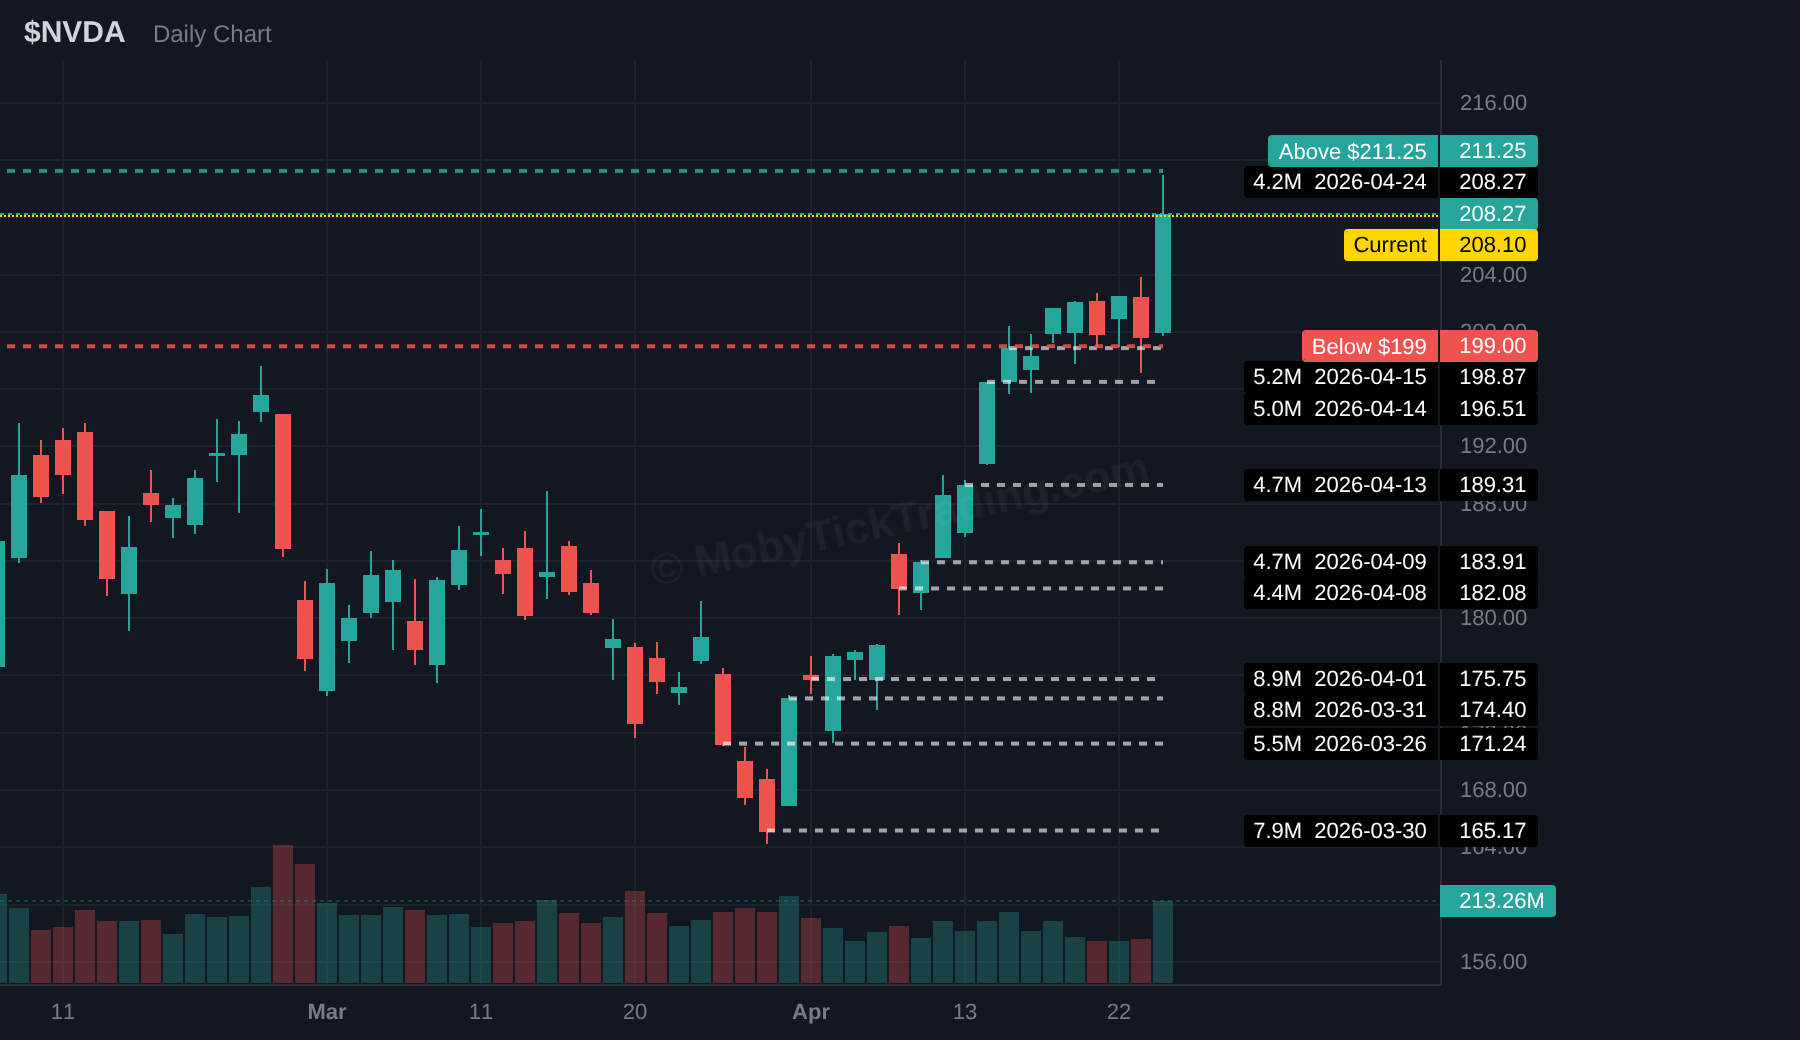
NVDA remains one of the most important charts in the report because institutional activity is enormous and AI-related earnings are a dominant market theme. The average dark pool zone near 203-204 gives a visible reference area beneath current price. Into next week, 211.25 is the first upside decision level to watch, while 199.00 marks the lower institutional line if momentum fades.
Above $211.25 → Targets: $215, $217.50, $220, $225, $227.5, $230
Below $199 → Targets: $197.5, $195, $190, $185, $180, $170
Dark Pool Context: $390.3M dark pool flow | 8.86M shares | 7 prints
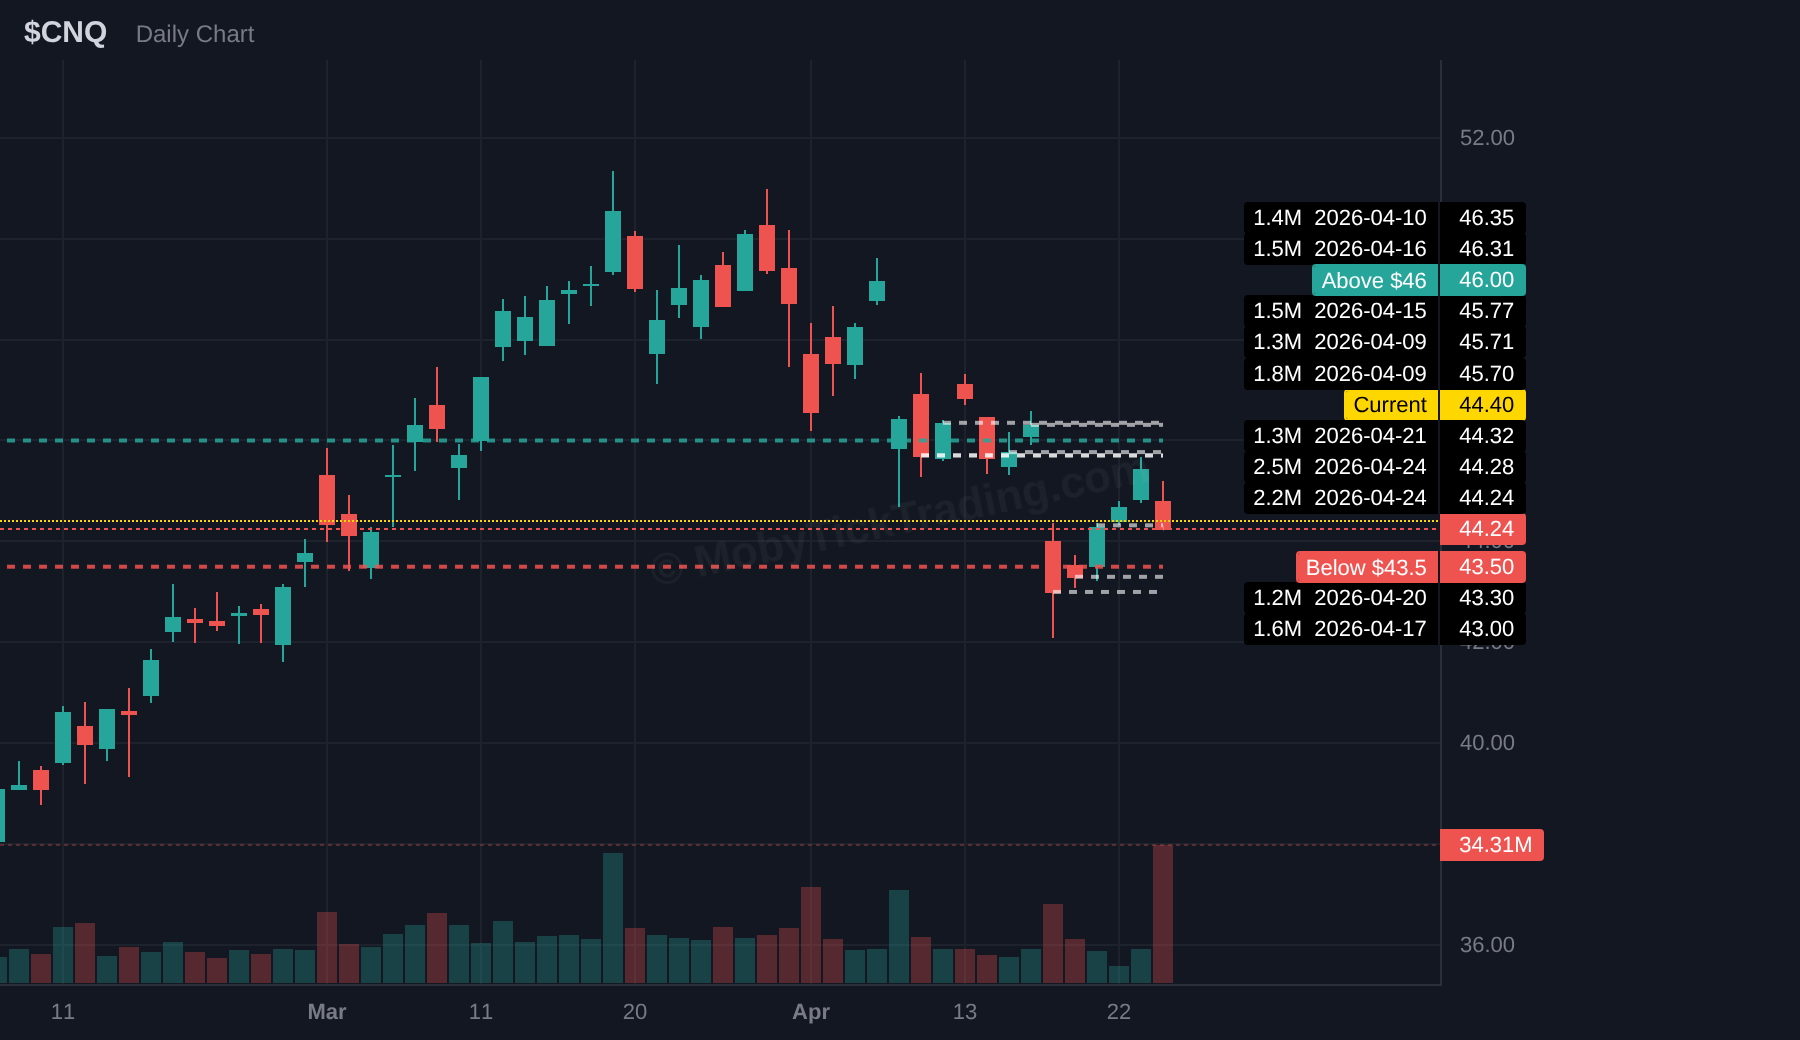
CNQ brings energy exposure into a week where crude and geopolitical headlines are still part of the backdrop. Dark pool activity is clustered around the mid-40s, which gives the chart a fairly tight institutional reference zone. For the new week, the setup is about whether price can push through the upper trigger and separate from that cluster, or rotate back through the lower trigger if energy momentum cools.
Above $46 → Targets: $47, $48, $49, $50, $51.25, $52.5
Below $43.50 → Targets: $42.50, $41.25, $40, $39
Dark Pool Context: $288.1M dark pool flow | 7.75M shares | 5 prints
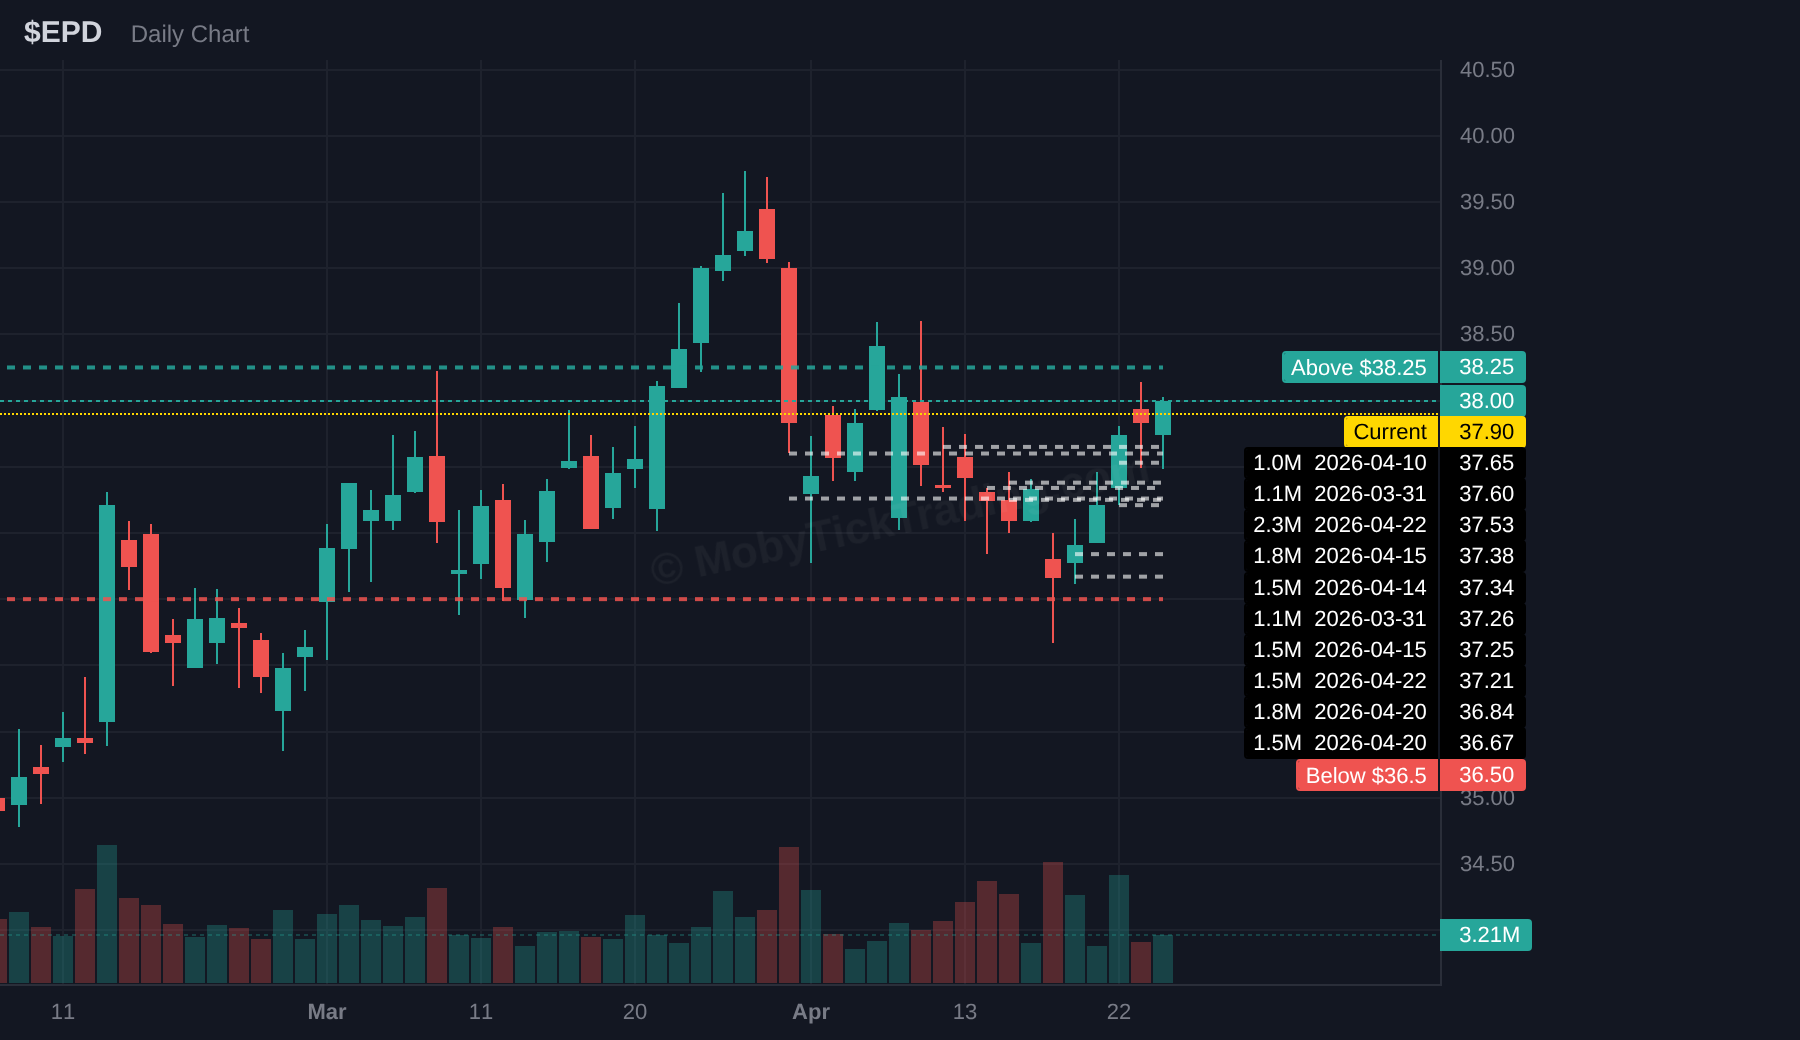
EPD is a cleaner slow-moving energy setup rather than a high-volatility name. The dark pool prints are clustered in a relatively tight band, suggesting institutions have been active without forcing a large expansion move yet. That makes the compression itself the setup: above 38.25 is the separation level, while 36.50 is the lower decision line if energy strength fades.
Above $38.25 → Targets: $39.00, $40.00, $41.25, $42.50, $43.25, $45.00
Below $36.50 → Targets: $36.00, $35.00, $34.00, $33.00, $32.00
Dark Pool Context: $156.0M dark pool flow | 10.78M shares | 4 prints
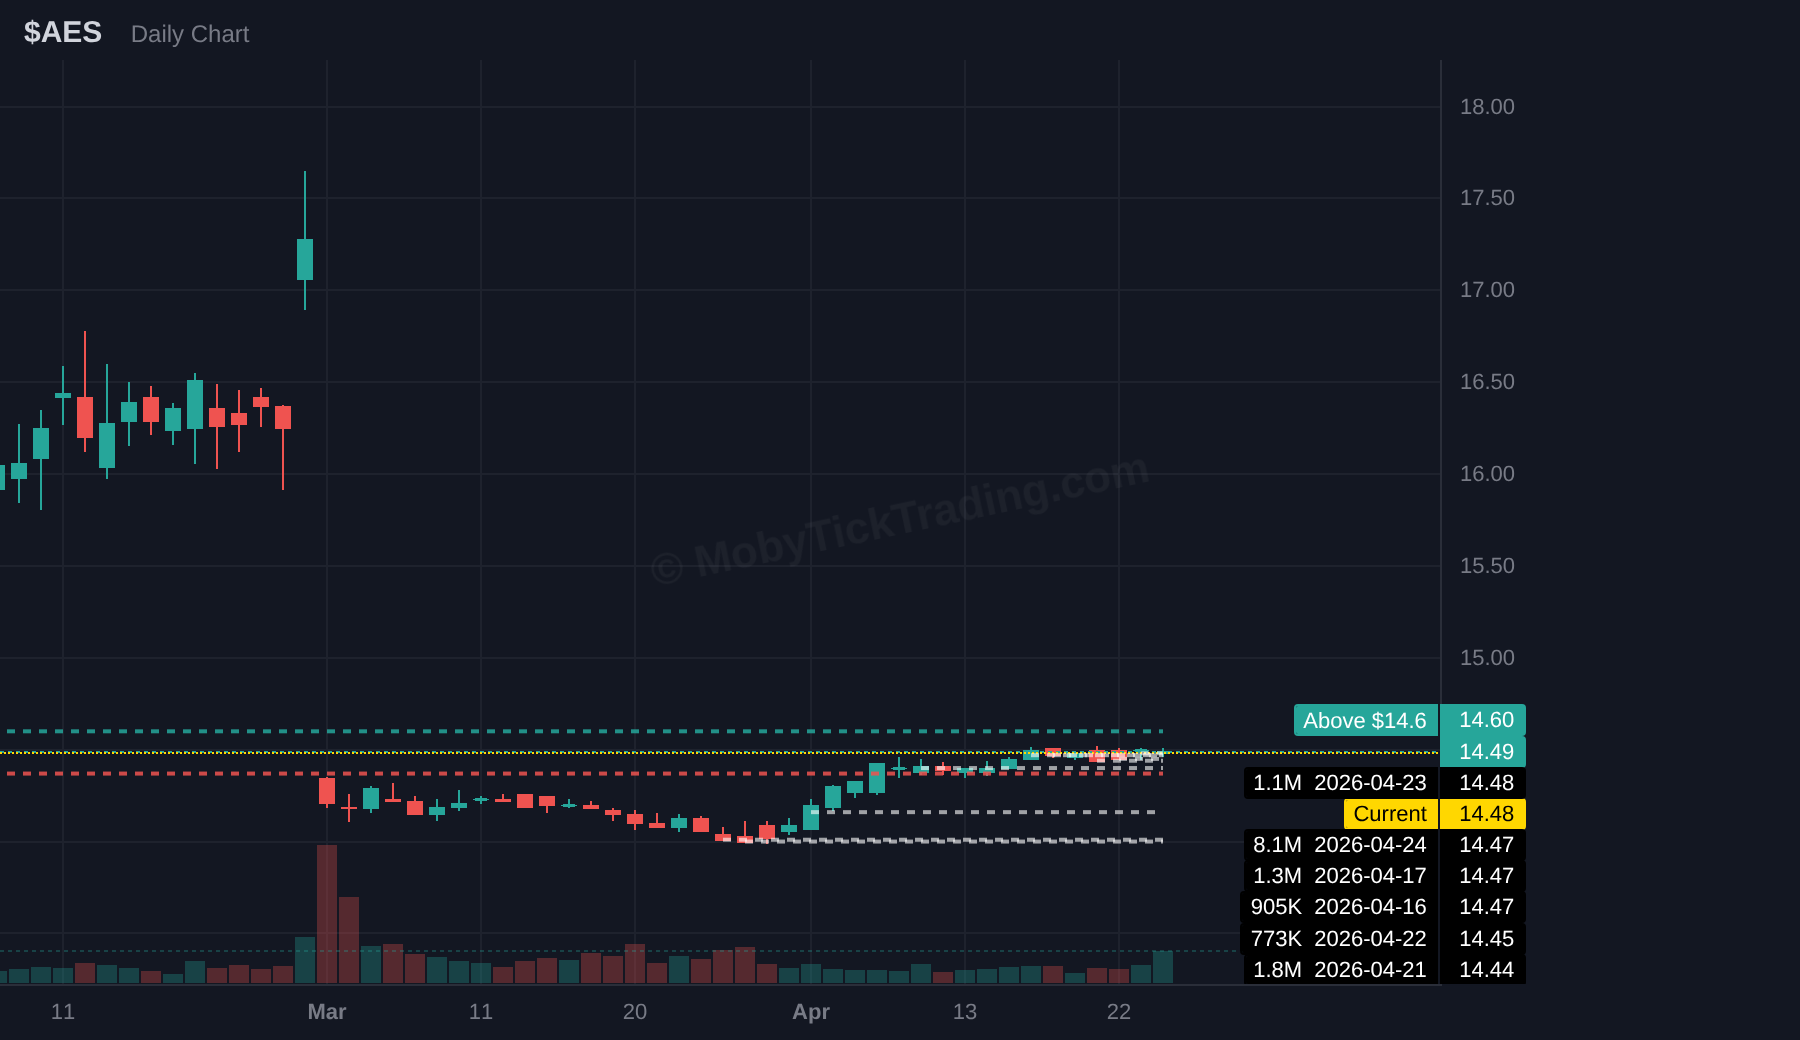
AES is quieter on dollar value, but the share count in dark pool activity is meaningful. Institutions have been active in a tight band, which makes the current structure more interesting than the headline notional value suggests. Above 14.60 would mark range expansion, while 14.37 is the downside decision level if the stock loses that tight institutional band.
Above $14.60 → Targets: $15.00, $15.20, $15.50, $15.80, $16.00
Below $14.37 → Targets: $14.00, $13.80, $13.50, $13.00, $12.50
Dark Pool Context: Prior week 15.81M @ $26.35 = $416.6M anchor print
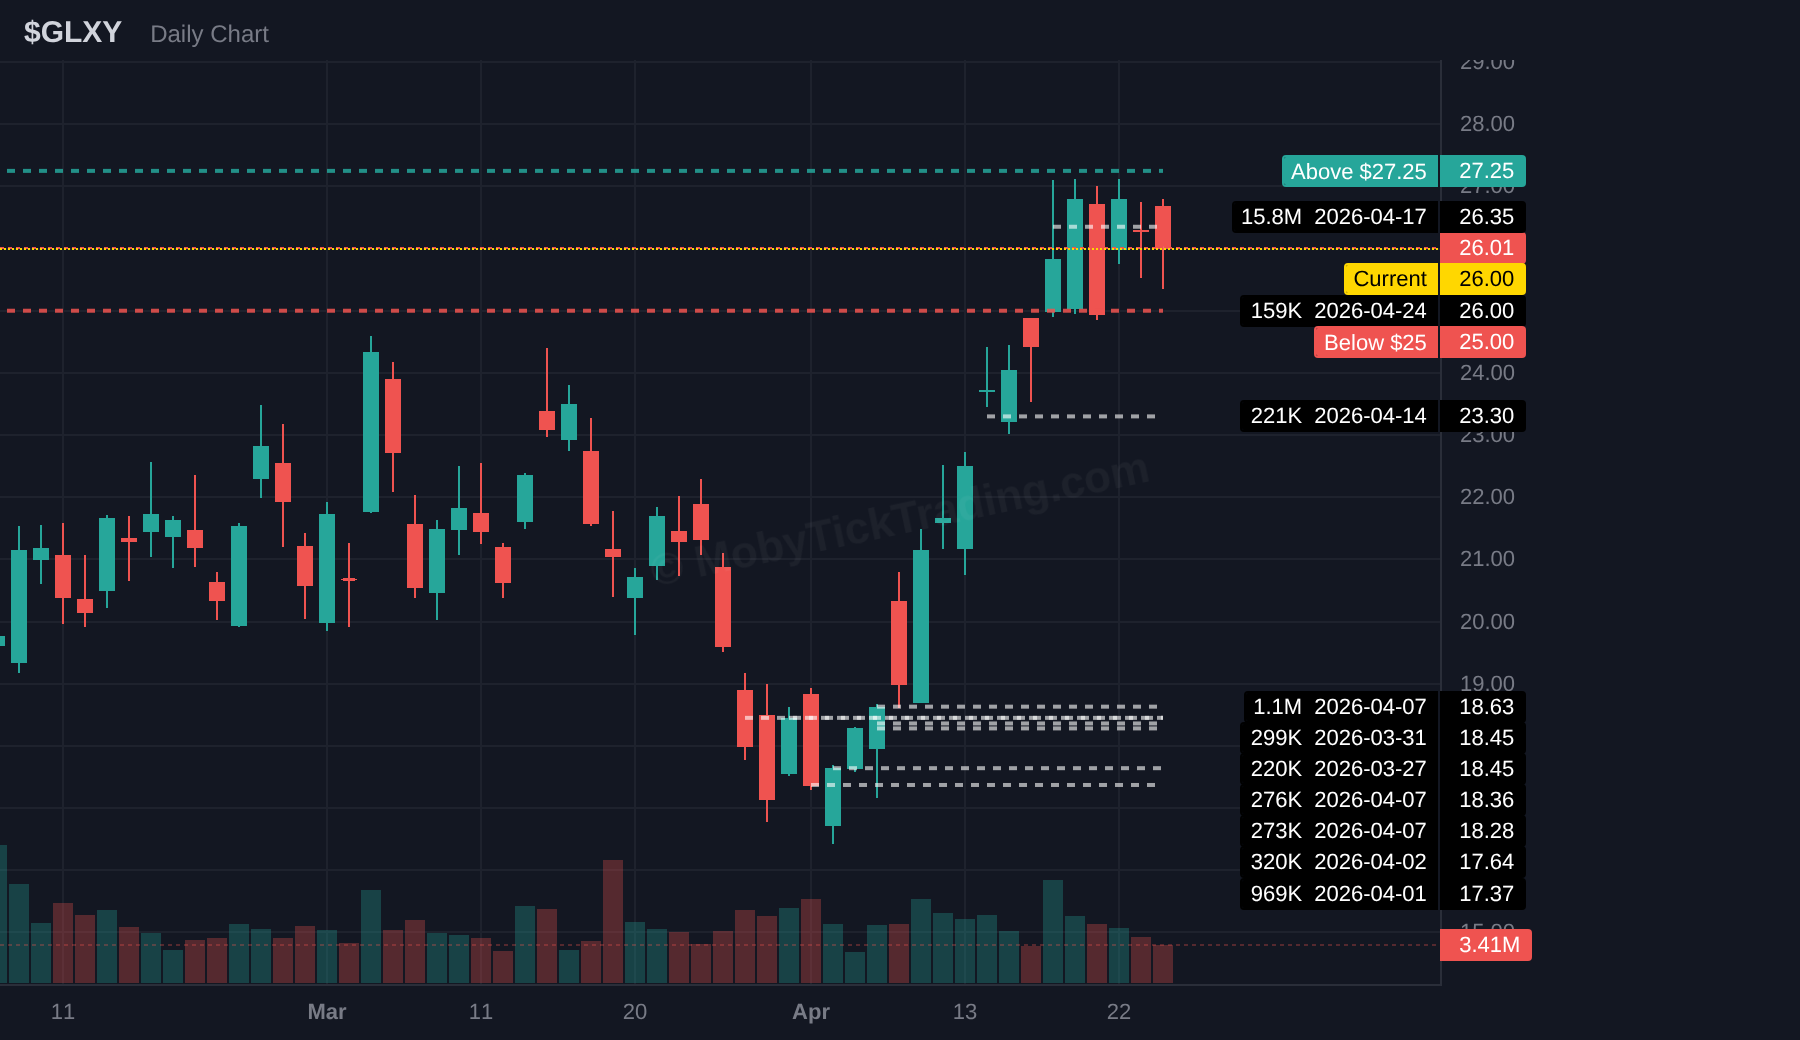
GLXY still has the prior large 26.35 anchor print dominating the chart, making this one of the cleaner institutional reference names in the report. Price is sitting close to that zone going into the new week. The upside trigger defines whether price can build distance from that anchor, while the lower trigger is the line to watch if crypto-related risk appetite cools.
Above $27.25 → Targets: $28.00, $29.00, $30.00, $31.25, $32.50
Below $25.00 → Targets: $24.00, $23.00, $22.00, $21.00, $20.00
Earnings weeks tend to create some of the clearest reactions in the market because institutions often position before the headline hits. By the time the report is out, part of the battle is already visible in dark pool data.
Large off-exchange prints show where size was actually done. They do not predict the news, and they do not guarantee direction. What they do give us is a set of institutional reference prices — areas where meaningful capital changed hands before volatility expands.
During earnings weeks, those zones matter more because price often moves quickly toward places where liquidity was already established. When a stock is sitting near a clear dark pool level going into a report, that level often becomes the first place traders watch for reaction.
• Average execution price — where institutions were most actively filled
• Trigger levels — the Above and Below prices that define the reaction zones
• Print count — whether activity came from one isolated block or repeated positioning
• Distance from current price — whether the stock is extended or still sitting near the institutional zone
NVDA printed 18 dark pool blocks totaling $3.02B across 14.8M shares, the heaviest single-stock activity in this week’s universe. The average execution price was about $203.70, with the stock closing at $208.10.
That leaves a clean map into next week: 211.25 is the first upside decision level, while 199.00 is the lower institutional reference if momentum weakens.
MSFT posted $2.07B in dark pool flow across 8 prints, with an average execution around $420.80. That places a meaningful institutional zone just below current price.
For the week ahead, 425.00 is the upper acceptance level to watch, while 415.00 is the lower support line if earnings volatility pushes price back into the range.
GOOGL generated $1.57B across 8 prints, with an average execution price near $336.04. That gives the stock a clear institutional support reference heading into earnings.
The setup is straightforward: 345.00 defines the upside breakout area, while 332.00 is the lower line to watch if the reaction is weaker.
AMZN recorded $1.51B in dark pool volume across 6 prints, with an average execution price of $257.91. Several large recent prints remain stacked beneath current price.
That creates a usable framework for next week: 265.00 is the upper trigger to watch, while 249.00 is the downside reference if volatility expands lower.
Dark pool levels do not predict earnings. They do something more useful: they show where institutions were willing to commit real capital before the event.
That gives traders a framework:
• Where did institutions already do size?
• Is price above or below that zone now?
• Which trigger is closest?
• Is this a fresh move, or a retest of a level that already matters?
Earnings gaps can skip levels entirely. A dark pool trigger is a reference point, not a guarantee. The advantage is not assuming price must react there — it is knowing ahead of time which institutional zones matter most.
This educational section is provided by MobyTick Trading. For more institutional dark pool intelligence, visit mobyticktrading.com.
Dark pool prints represent off-exchange trade reports filed with FINRA. This report is for informational and educational use only and is not financial advice.