Physical Address
304 North Cardinal St.
Dorchester Center, MA 02124
Physical Address
304 North Cardinal St.
Dorchester Center, MA 02124

Last week's callout sheet hit 12 of 13 Above triggers, MU rallied to a $747 weekly high, and INTC gained 25%+. This week's slate: 13 fresh dark pool setups with above and below trigger ladders for the May 11–15 trading week.
The major U.S. indexes finished the week of May 4 through May 8 broadly higher, with the technology complex leading the move. The S&P 500 closed Friday at 7,398.93, with SPY rising 2.35% on the week from 720.65 to 737.62. The Nasdaq complex was the standout, with QQQ jumping 5.50% from 674.15 to 711.23 — a fresh closing high zone driven by mega-cap and semiconductor strength. The Russell 2000 small-cap index closed near 2,861, with IWM up 1.75% to 284.17. The Dow lagged, with DIA up just 0.22% as commodity-sensitive and defensive components weighed.
The macro calendar was anchored by the April jobs report on Friday, May 8. Nonfarm payrolls came in at 115,000, while the unemployment rate held at 4.3%. The print was modestly above the 70,000 to 120,000 forecast range and reinforced the “low-hire, low-fire” labor market narrative. Earnings season has been the dominant tape support — according to FactSet, S&P 500 companies are reporting earnings 18.2% above estimates, well ahead of the 5-year average of 7.3%. WTI crude traded near $96/bbl, gold pulled back to around $4,725/oz, and the VIX traded near record-low levels into Friday’s close.
The previous callout sheet produced 12 of 13 Above triggers, 3 of 13 Below triggers, and 48 listed targets reached across the slate. MU and INTC were the standouts — MU triggered all 6 listed Above targets to a weekly high of 747.21, and INTC reached all 7 Above targets in a single weekly expansion to 130.57. WMT was the only complete miss, holding inside the 124.75 to 133.25 bracket all week.
| Ticker | Above | Below | Wk High | Wk Low | Above Result | Below Result |
|---|---|---|---|---|---|---|
| SPY | $725 | $710 | 738.08 | 714.99 | ✅ $727.5/730/732.5/735 | ❌ |
| IWM | $280 | $270 | 287.58 | 276.10 | ✅ $282.5/285/287.5 | ❌ |
| QQQ | $676 | $655 | 711.23 | 668.90 | ✅ $680/682.5/685/687.5/690 | ❌ |
| AAPL | $285 | $275 | 294.76 | 274.86 | ✅ $287.5/290 | ✅ trigger |
| NVDA | $205 | $197 | 217.80 | 194.74 | ✅ $207.5/210/212.5/215/217.5 | ✅ $195 |
| INTC | $101.25 | $91.50 | 130.57 | 95.60 | ✅ ALL 7 ($102.5→$120) | ❌ |
| MSFT | $415 | $400 | 427.98 | 405.11 | ✅ $420/425/427.5 | ❌ |
| MU | $550 | $495 | 747.21 | 557.76 | ✅ ALL 6 ($560→$630) | ❌ |
| AMZN | $272.50 | $255 | 278.56 | 268.80 | ✅ $275/277.5 | ❌ |
| GOOGL | $386.25 | $372.50 | 402.00 | 379.79 | ✅ $390/395/400 | ❌ |
| WMT | $133.25 | $124.75 | 131.75 | 128.67 | ❌ | ❌ |
| TXN | $283.25 | $265 | 292.64 | 275.58 | ✅ $285/287.5/290 | ❌ |
| BE | $297.50 | $275 | 302.99 | 249.10 | ✅ $300 | ✅ $270/260/250 |
Combined dark pool activity in SPY, QQQ, IWM, VOO, and IVV reached $18.55 billion for the week. SPY led the board with $7.21 billion across 10 prints, followed by QQQ and IVV at $4.69 billion each. That concentration kept the index ETF complex firmly in control of the weekly tape — broad-market flow ran more than ten times larger than the entire sector SPDR group combined.
Sector rotation beneath the surface told a much narrower story. Total sector SPDR flow came in at just $1.70 billion across all 11 sectors. XLF led with $707.8 million followed by XLE at $498.4 million — meaningful given energy was a relative laggard at the index level. From there, sector activity dropped sharply, with XLI, XLRE, and XLY all recording zero qualifying off-exchange flow. The complete absence of those three reinforces the read that this was an index-led tape rather than a sector-rotation week.
| ETF | Value | Prints |
|---|---|---|
| SPY | $7,209.4M | 10 |
| QQQ | $4,689.2M | 4 |
| IVV | $4,686.0M | 4 |
| IWM | $1,262.3M | 7 |
| VOO | $707.1M | 2 |
| Sector | Value | Prints |
|---|---|---|
| XLF | $707.8M | 6 |
| XLE | $498.4M | 11 |
| XLK | $154.8M | 2 |
| XLV | $133.3M | 1 |
| XLB | $63.9M | 2 |
| XLC | $52.8M | 1 |
| XLP | $50.3M | 1 |
| XLU | $37.1M | 1 |
| XLI | $0.0M | 0 |
| XLRE | $0.0M | 0 |
| XLY | $0.0M | 0 |
Trigger and target ladders for each name in the slate. Each ticker carries a defined Above trigger plus 5–7 upside targets. Use the chart and writeup below for the institutional dark pool context behind each level.
| Ticker | Trigger | T1 | T2 | T3 | T4 | T5 | T6 | T7 |
|---|---|---|---|---|---|---|---|---|
| SPY | $740 | $745 | $747.50 | $750 | $755 | $760 | — | — |
| QQQ | $715 | $720 | $725 | $730 | $735 | $740 | — | — |
| IWM | $287.50 | $290 | $291.25 | $292.50 | $295 | $297.50 | — | — |
| MSFT | $425 | $430 | $435 | $440 | $445 | $450 | — | — |
| MU | $762.50 | $787.50 | $800 | $850 | $900 | $1,000 | — | — |
| NVDA | $218 | $220 | $225 | $230 | $235 | $240 | — | — |
| ET | $20.50 | $20.62 | $20.75 | $21 | $21.50 | $22 | — | — |
| AAPL | $295 | $297.50 | $300 | $302.50 | $305 | $307.50 | $310 | — |
| ANET | $150 | $152.50 | $155 | $157.50 | $160 | $162.50 | $165 | — |
| XOM | $148.50 | $150 | $151.25 | $152.50 | $155 | $157.50 | $160 | — |
| NKE | $45 | $46 | $47 | $48 | $49 | $50 | — | — |
| TSLA | $430 | $440 | $450 | $460 | $475 | $500 | — | — |
| BSX | $58.25 | $60 | $61.25 | $62.50 | $65 | $67.50 | $70 | — |
Below-trigger ladders for the same slate. These are the institutional levels to watch if price rejects the upside structure and rolls back into the lower band.
| Ticker | Trigger | T1 | T2 | T3 | T4 | T5 | T6 | T7 |
|---|---|---|---|---|---|---|---|---|
| SPY | $730 | $727.50 | $725 | $722.50 | $720 | $715 | $710 | — |
| QQQ | $700 | $697.50 | $695 | $690 | $685 | $680 | $675 | — |
| IWM | $277.50 | $275 | $272.50 | $270 | $267.50 | $265 | — | — |
| MSFT | $410 | $407.50 | $405 | $400 | $390 | $380 | $370 | — |
| MU | $720 | $700 | $675 | $650 | $600 | — | — | — |
| NVDA | $207.50 | $205 | $202.50 | $200 | $197.50 | $195 | $190 | — |
| ET | $18.60 | $18.50 | $18.40 | $18 | $17.50 | $17 | — | — |
| AAPL | $284 | $282.50 | $280 | $277.50 | $275 | $272.50 | $270 | — |
| ANET | $138.50 | $136.25 | $135 | $132.50 | $130 | $127.50 | $125 | $120 |
| XOM | $143 | $142 | $140 | $138 | $136 | $132.50 | $130 | — |
| NKE | $42.50 | $41 | $40 | $37.50 | $35 | $32.50 | $30 | — |
| TSLA | $370 | $360 | $350 | $340 | $330 | $320 | $300 | — |
| BSX | $54 | $53 | $52 | $50 | $47.50 | $45 | $43 | — |
The slate this week covers SPY, QQQ, IWM as broad-market references plus 10 single-stock setups featuring the highest dollar-flow names of the week (AAPL, MSFT, NVDA, MU) and a set of volume-ratio outliers (ET, ANET, NKE, BSX) where dark pool size was unusually large versus 30-day average daily volume. TSLA and XOM round out the slate with continuation setups.
Dark Pool Context: $7,209.4M total flow | 9.90M shares | 10 prints | Avg print $728.49
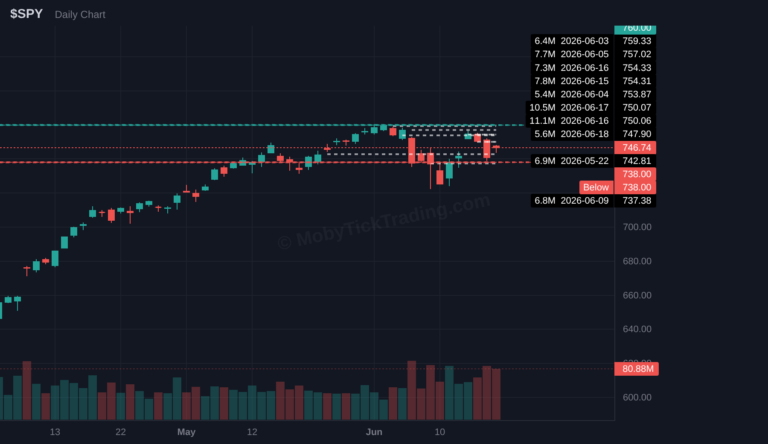
SPY remained the broad-market reference this week with $7.21 billion in dark pool flow across 10 prints. The ETF closed at 737.62, up 2.35% on the week, with average dark pool execution near $728.49.
The new callout ladder is set at $740 above and $730 below.
🟢 Above $740 | T1 $745 | T2 $747.50 | T3 $750 | T4 $755 | T5 $760
🔴 Below $730 | T1 $727.50 | T2 $725 | T3 $722.50 | T4 $720 | T5 $715 | T6 $710
Dark Pool Context: $4,689.2M total flow | 6.95M shares | 4 prints | Avg print $675.11
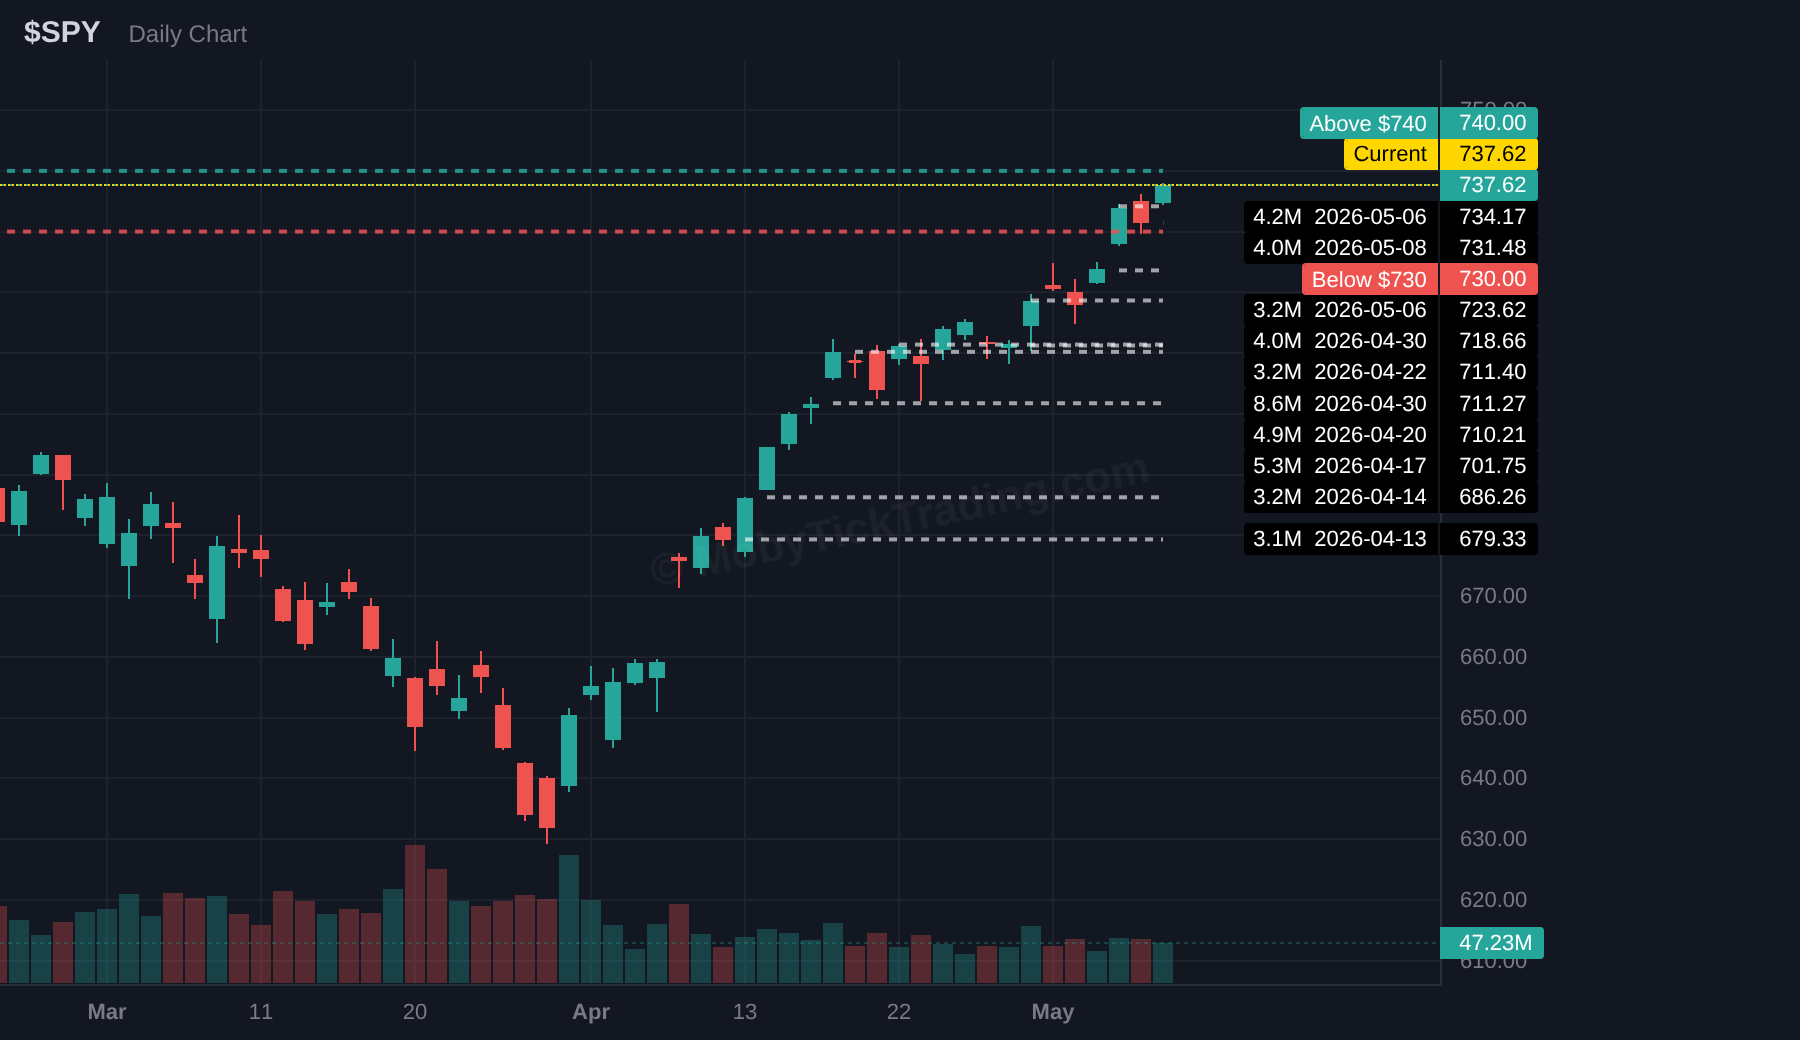
QQQ generated $4.69 billion in dark pool flow across 4 prints and closed at 711.23 — up 5.50% on the week, the strongest performer among the broad-market ETFs.
The fresh setup begins at $715 above and $700 below.
🟢 Above $715 | T1 $720 | T2 $725 | T3 $730 | T4 $735 | T5 $740
🔴 Below $700 | T1 $697.50 | T2 $695 | T3 $690 | T4 $685 | T5 $680 | T6 $675
Dark Pool Context: $1,262.3M total flow | 4.48M shares | 7 prints | Avg print $281.81
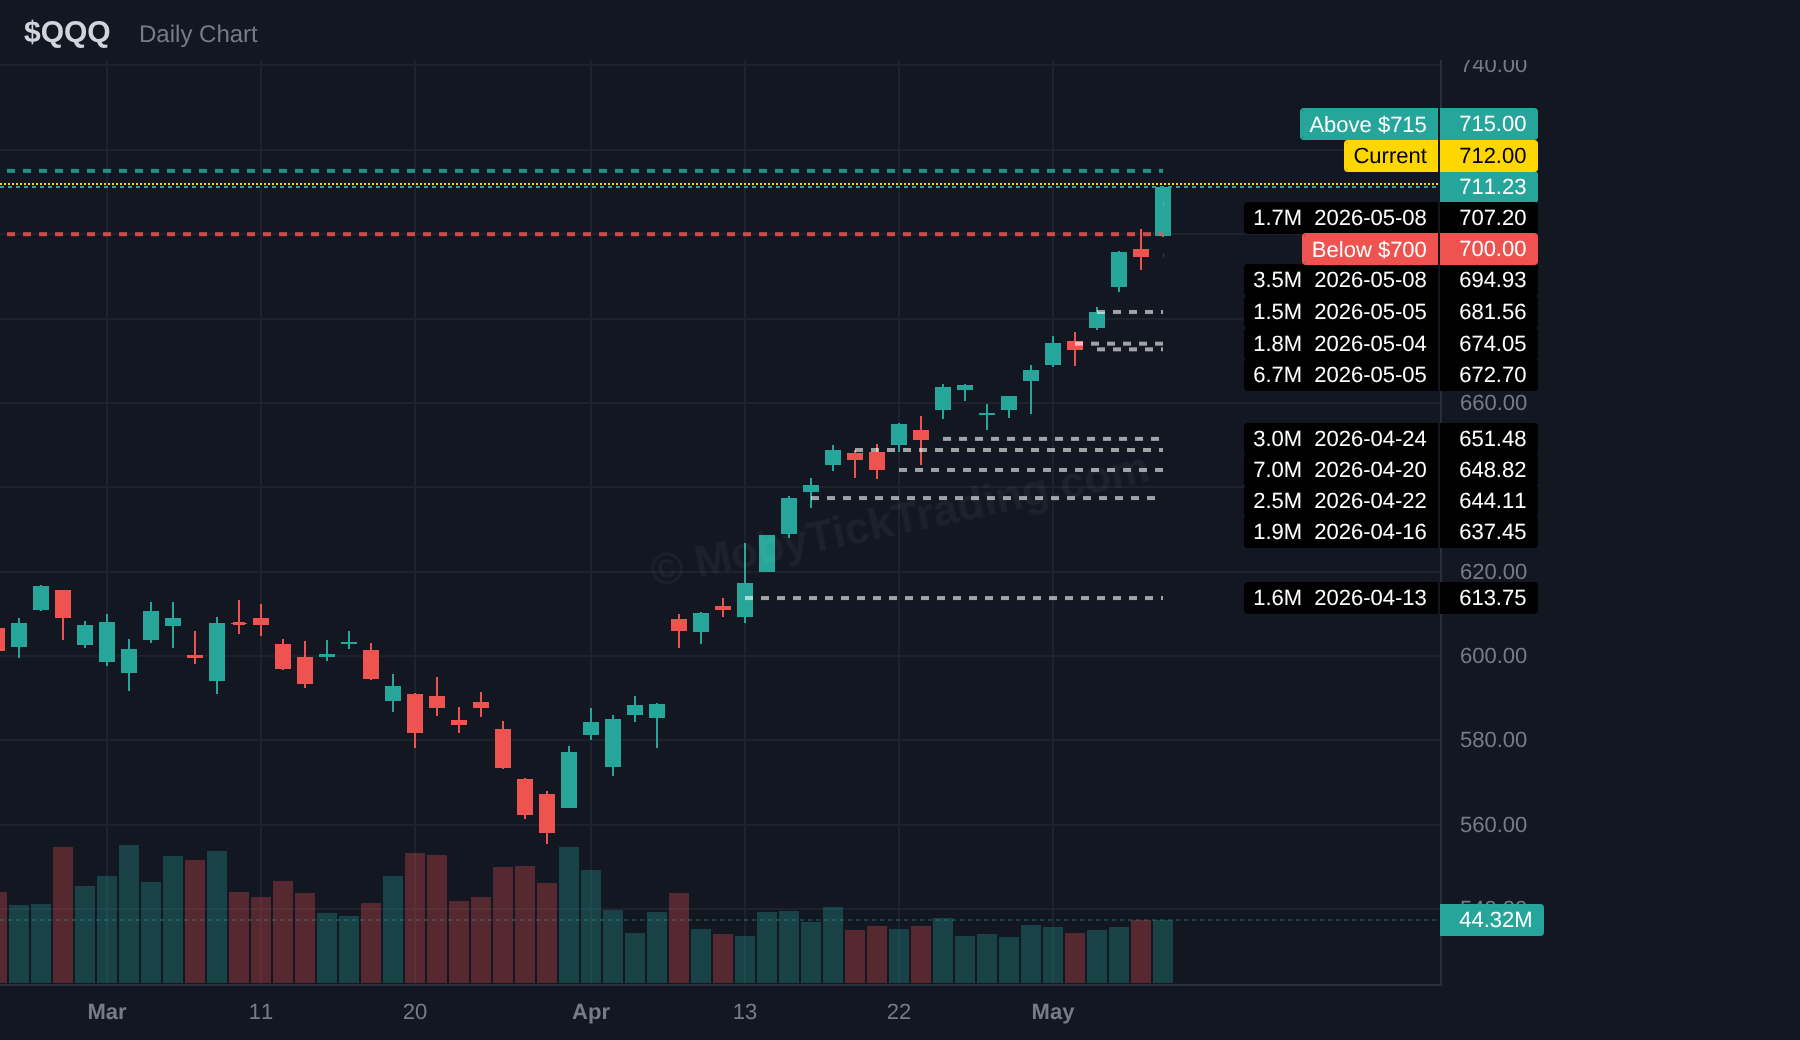
IWM printed $1.26 billion across 7 dark pool prints and closed at 284.17, up 1.75%. Small caps participated in the rally but lagged the large-cap and Nasdaq complexes by a wide margin.
The new ladder is centered on $287.50 above and $277.50 below.
🟢 Above $287.50 | T1 $290 | T2 $291.25 | T3 $292.50 | T4 $295 | T5 $297.50
🔴 Below $277.50 | T1 $275 | T2 $272.50 | T3 $270 | T4 $267.50 | T5 $265
Dark Pool Context: $3,707.0M total flow | 8.88M shares | 10 prints | Avg print $417.24
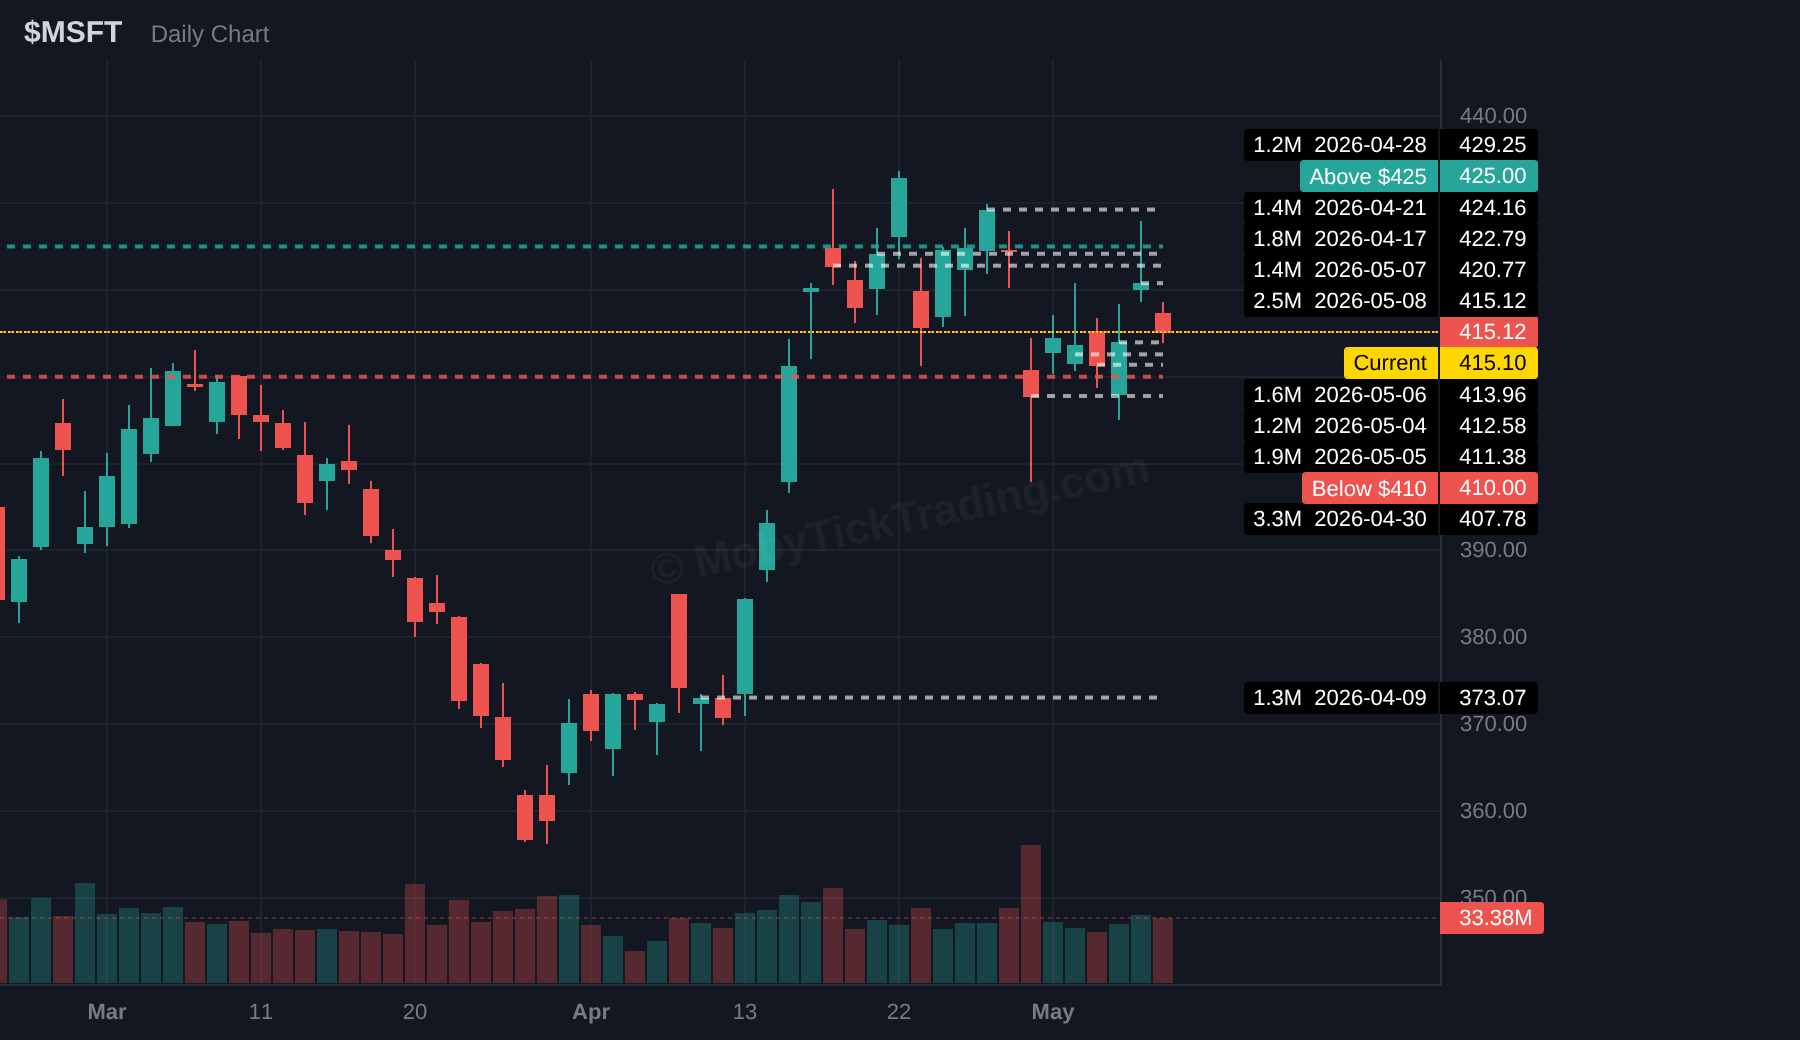
MSFT generated $3.71 billion in dark pool flow across 10 prints and 8.88M shares — the second-largest single-stock footprint on the board. Average dark pool execution was $417.24.
The trigger ladder begins at $425 above and $410 below.
🟢 Above $425 | T1 $430 | T2 $435 | T3 $440 | T4 $445 | T5 $450
🔴 Below $410 | T1 $407.50 | T2 $405 | T3 $400 | T4 $390 | T5 $380 | T6 $370
Dark Pool Context: $2,295.0M total flow | 3.64M shares | 6 prints | Avg print $630.31
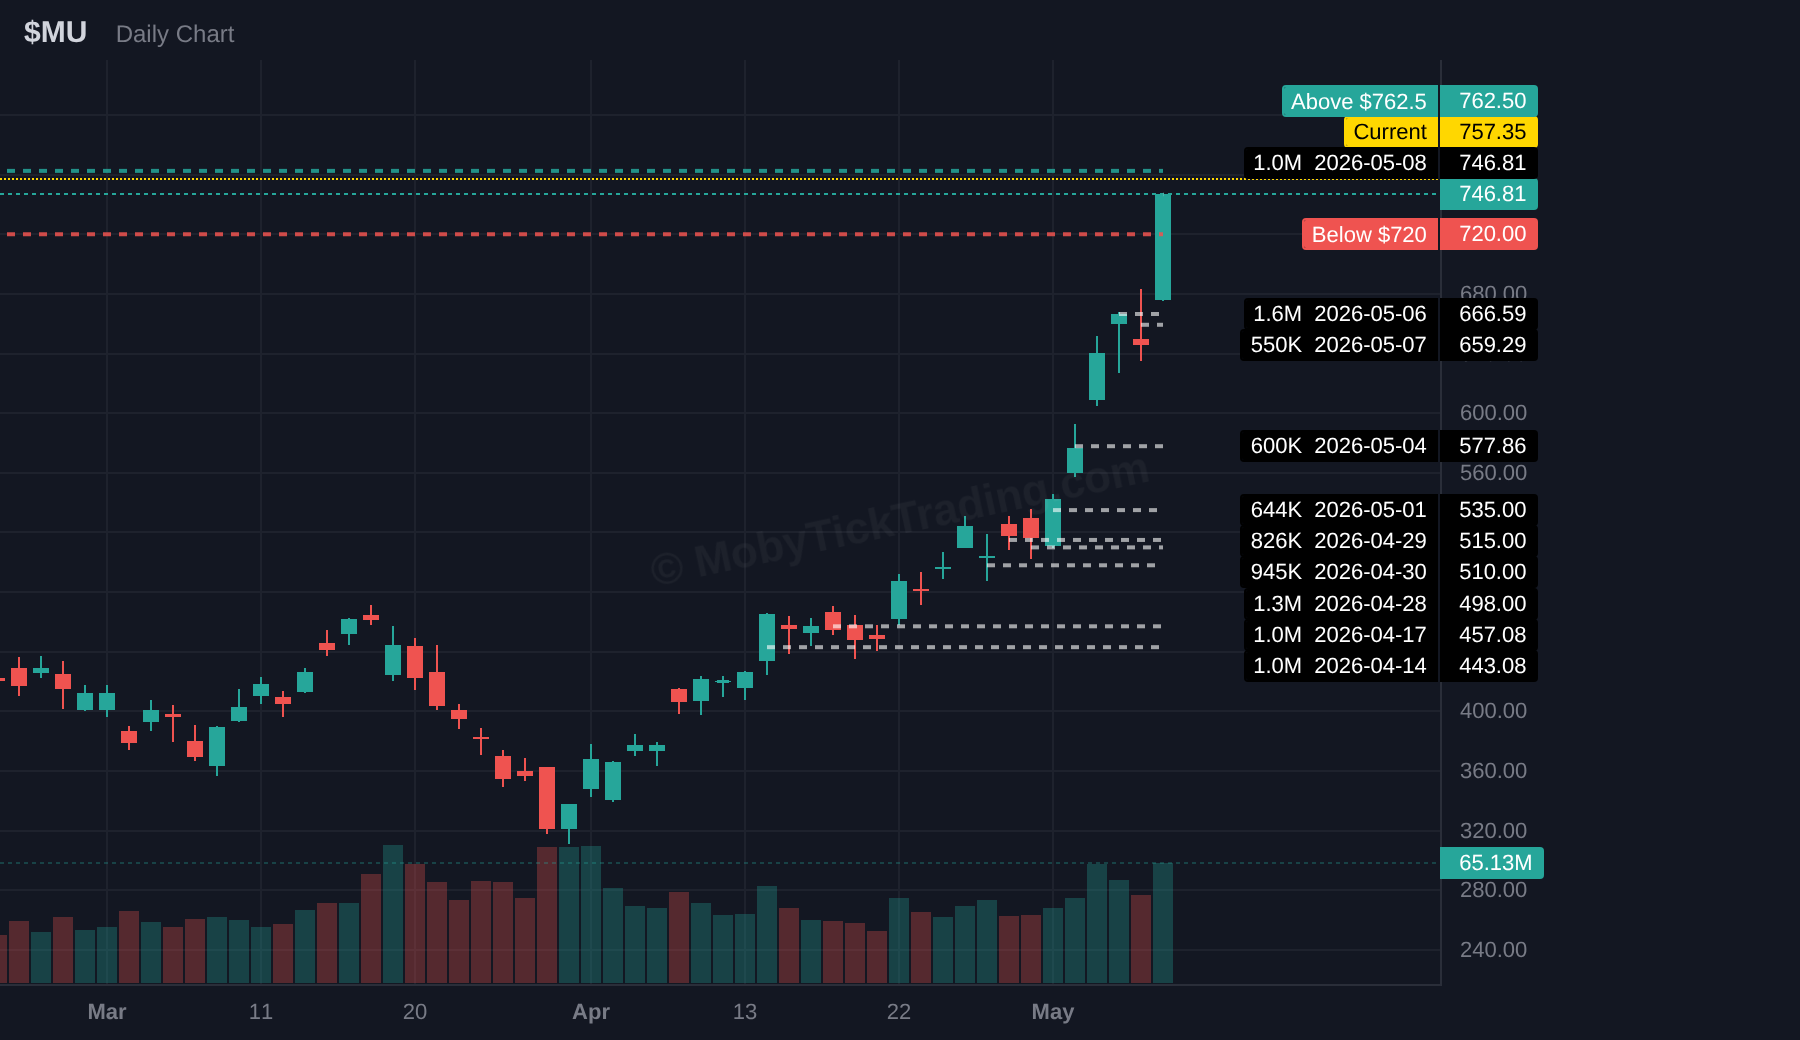
MU was the standout name of the entire week — $2.30 billion across 6 dark pool blocks with the stock rallying to a weekly high of 747.21.
The fresh setup begins at $762.50 above and $720 below — one of the wider trigger ladders in the issue, appropriate given the realized volatility.
🟢 Above $762.50 | T1 $787.50 | T2 $800 | T3 $850 | T4 $900 | T5 $1,000
🔴 Below $720 | T1 $700 | T2 $675 | T3 $650 | T4 $600
Dark Pool Context: $3,375.0M total flow | 16.46M shares | 12 prints | Avg print $205.03
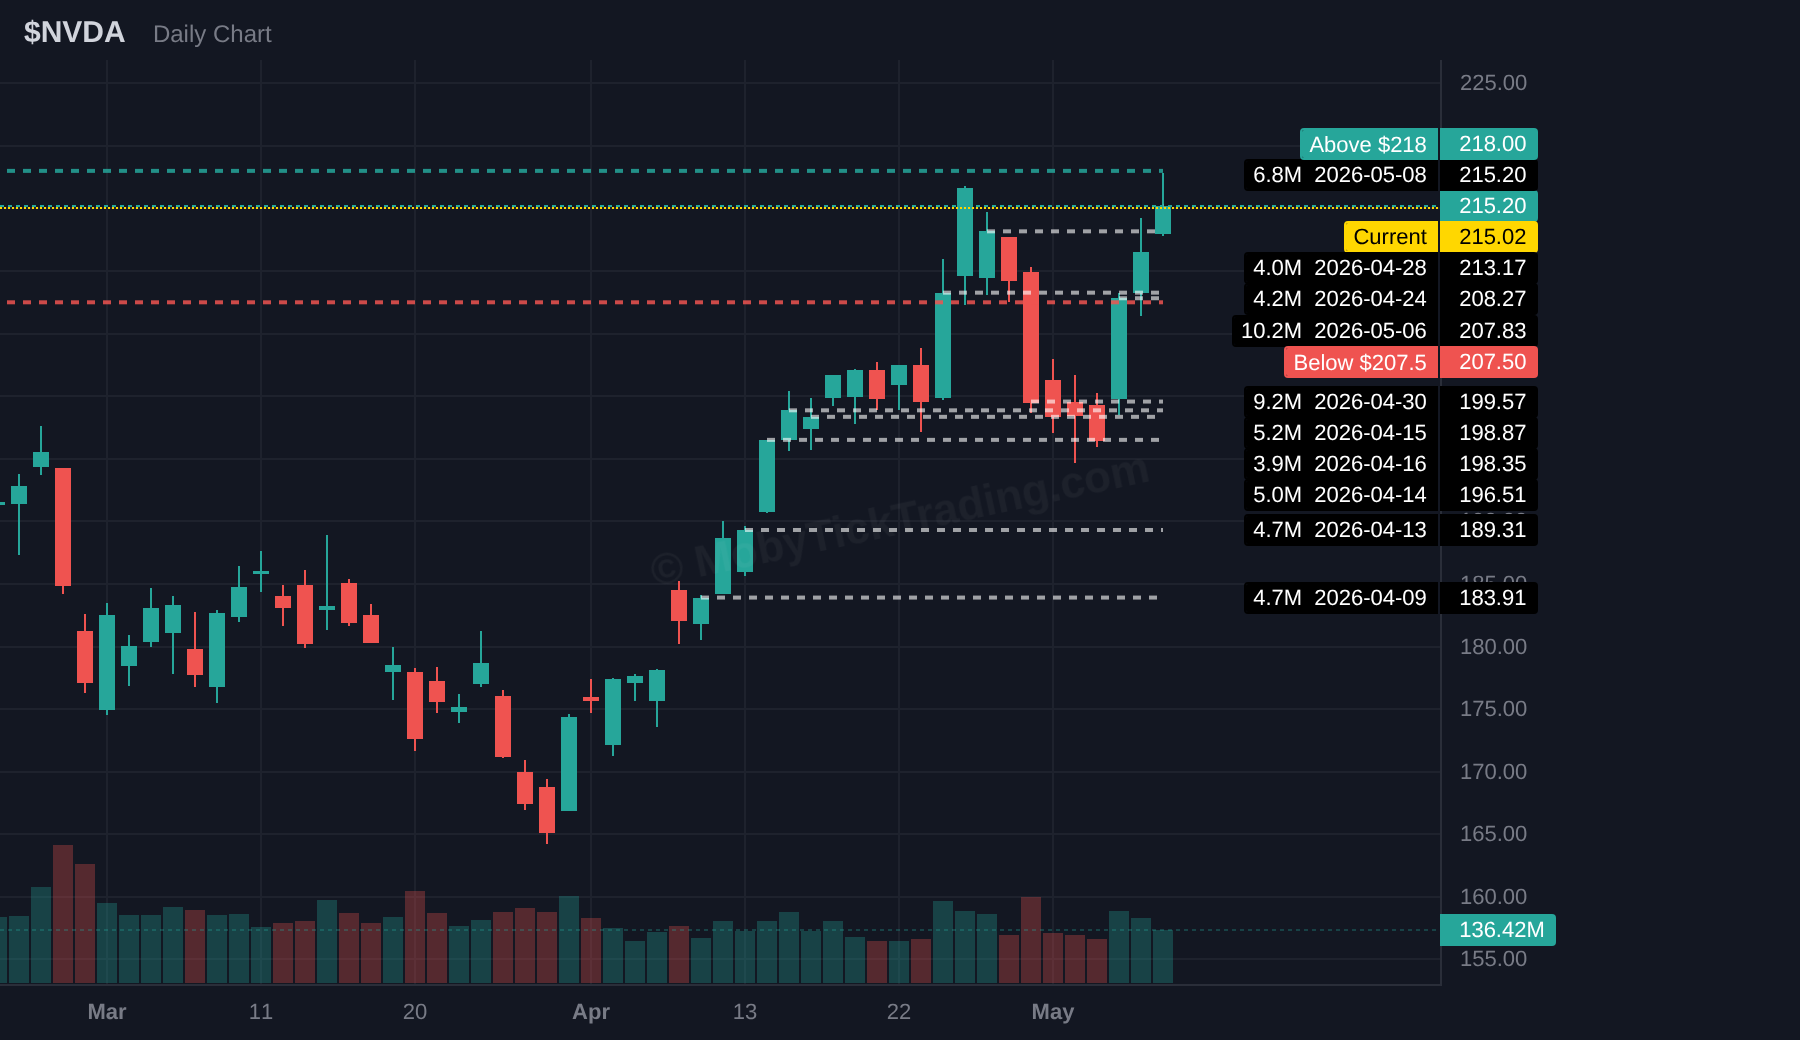
NVDA printed $3.38 billion across 12 dark pool prints — the highest print count on the entire board. The stock closed at 215.20 with average dark pool execution at $205.03.
The new ladder begins at $218 above and $207.50 below.
🟢 Above $218 | T1 $220 | T2 $225 | T3 $230 | T4 $235 | T5 $240
🔴 Below $207.50 | T1 $205 | T2 $202.50 | T3 $200 | T4 $197.50 | T5 $195 | T6 $190
Dark Pool Context: $765.3M total flow | 38.00M shares | 6 prints | Avg print $20.14
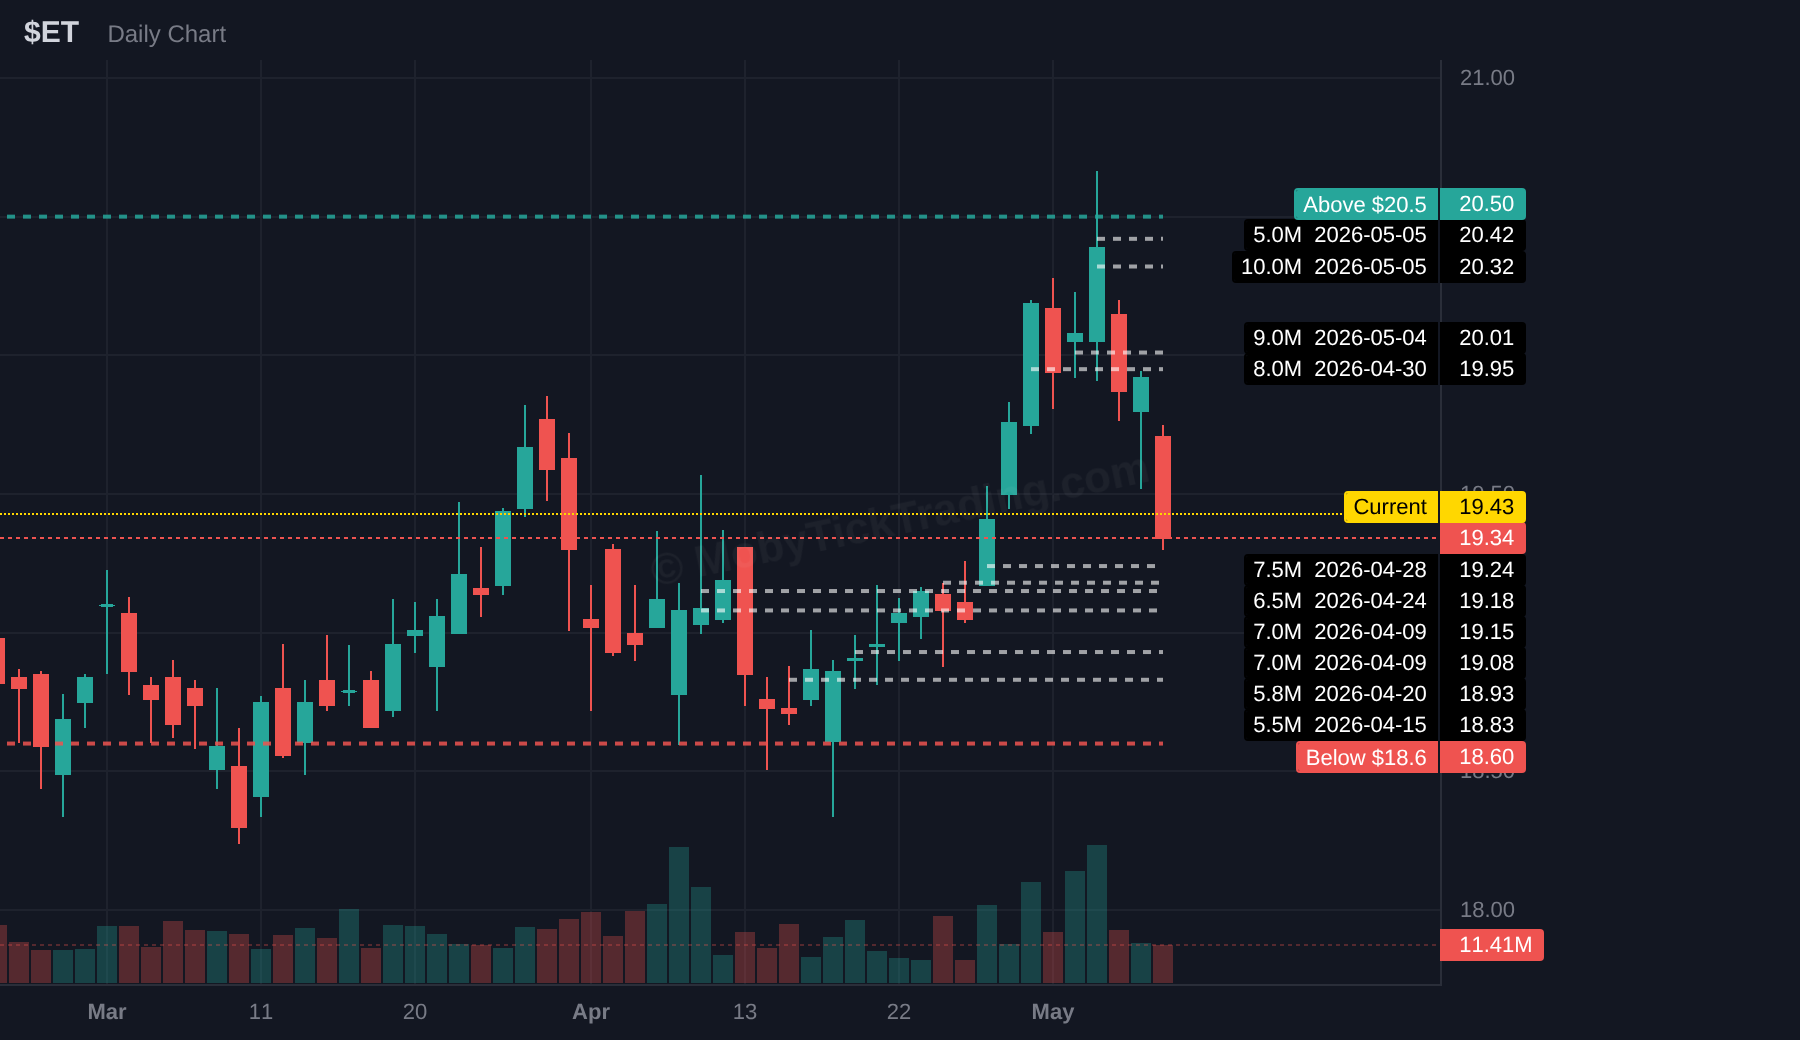
ET was the standout volume-ratio outlier of the week. The MLP printed $765.3 million across 6 dark pool blocks on 38M shares — well above its 30-day average daily volume.
The setup begins at $20.50 above and $18.60 below — narrower spacing for a tighter-priced name.
🟢 Above $20.50 | T1 $20.62 | T2 $20.75 | T3 $21 | T4 $21.50 | T5 $22
🔴 Below $18.60 | T1 $18.50 | T2 $18.40 | T3 $18 | T4 $17.50 | T5 $17
Dark Pool Context: $6,225.2M total flow | 21.95M shares | 8 prints | Avg print $283.64
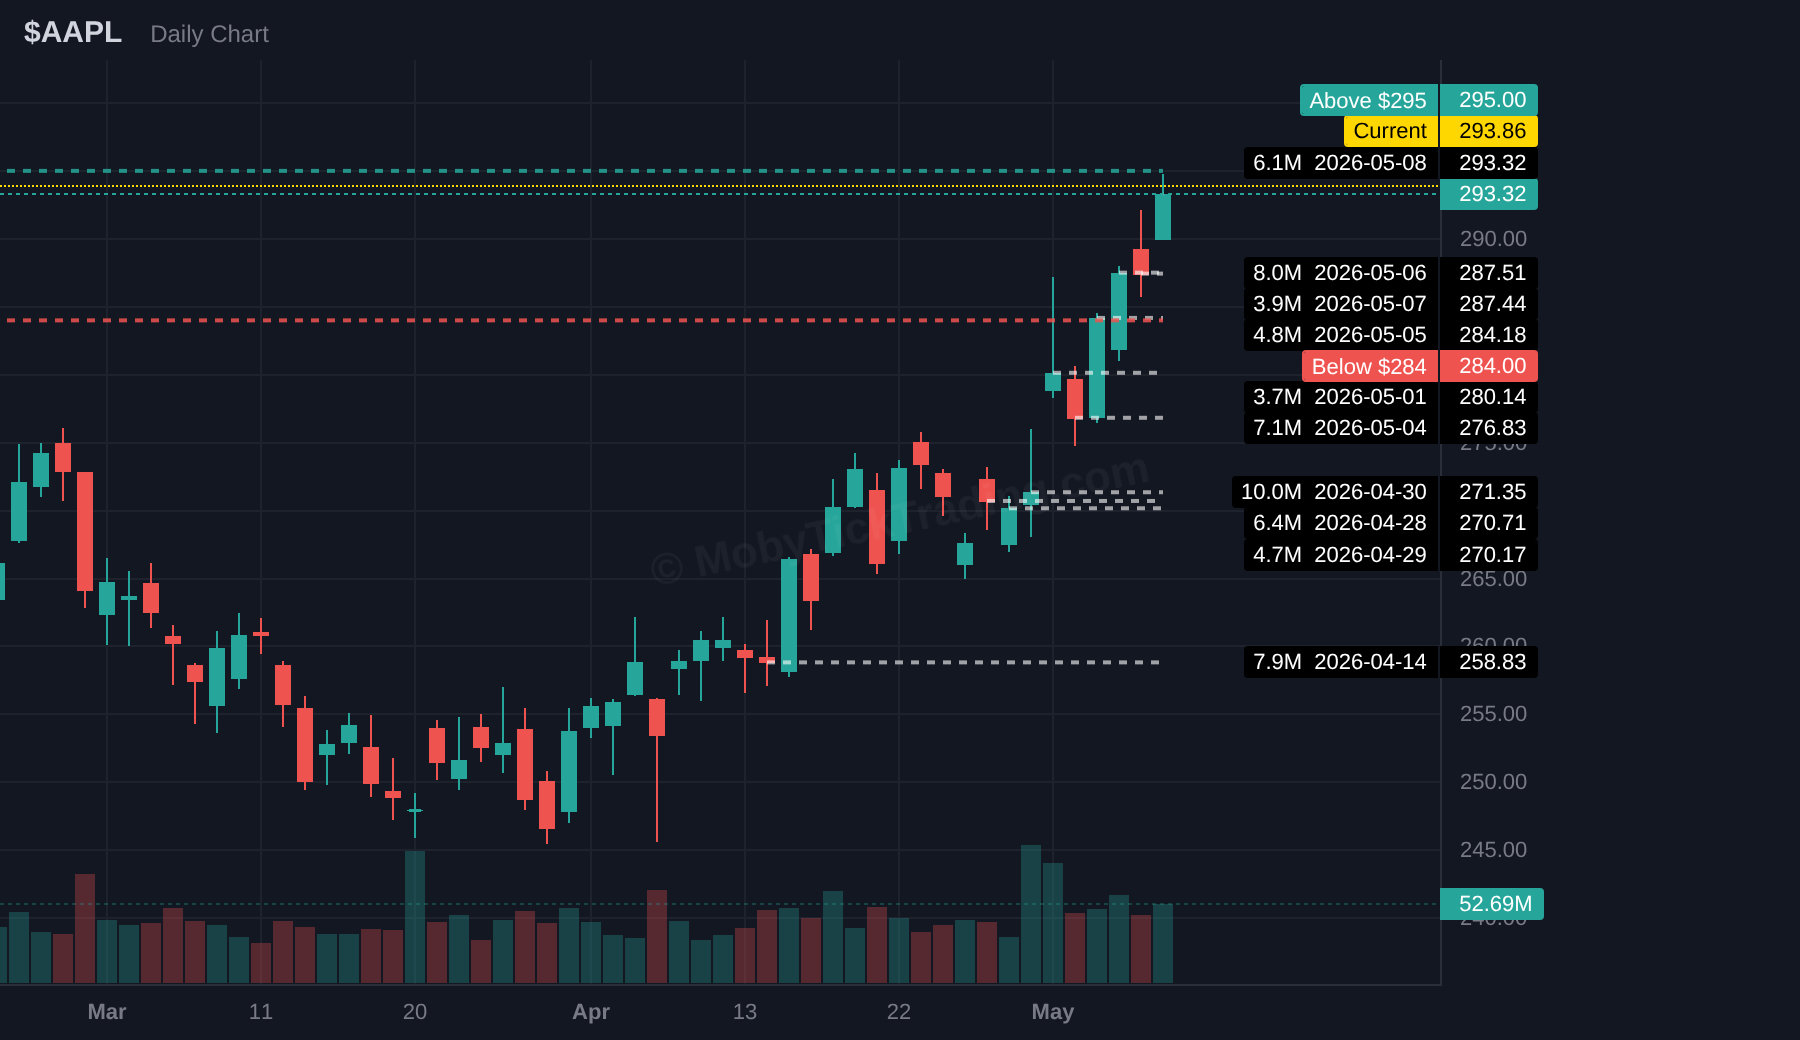
AAPL led all single stocks for total dark pool dollar value with $6.23 billion across 8 prints and 21.95M shares — the largest single-stock footprint on the board.
The callout map begins at $295 above and $284 below.
🟢 Above $295 | T1 $297.50 | T2 $300 | T3 $302.50 | T4 $305 | T5 $307.50 | T6 $310
🔴 Below $284 | T1 $282.50 | T2 $280 | T3 $277.50 | T4 $275 | T5 $272.50 | T6 $270
Dark Pool Context: $505.2M total flow | 2.93M shares | 1 prints | Avg print $172.62
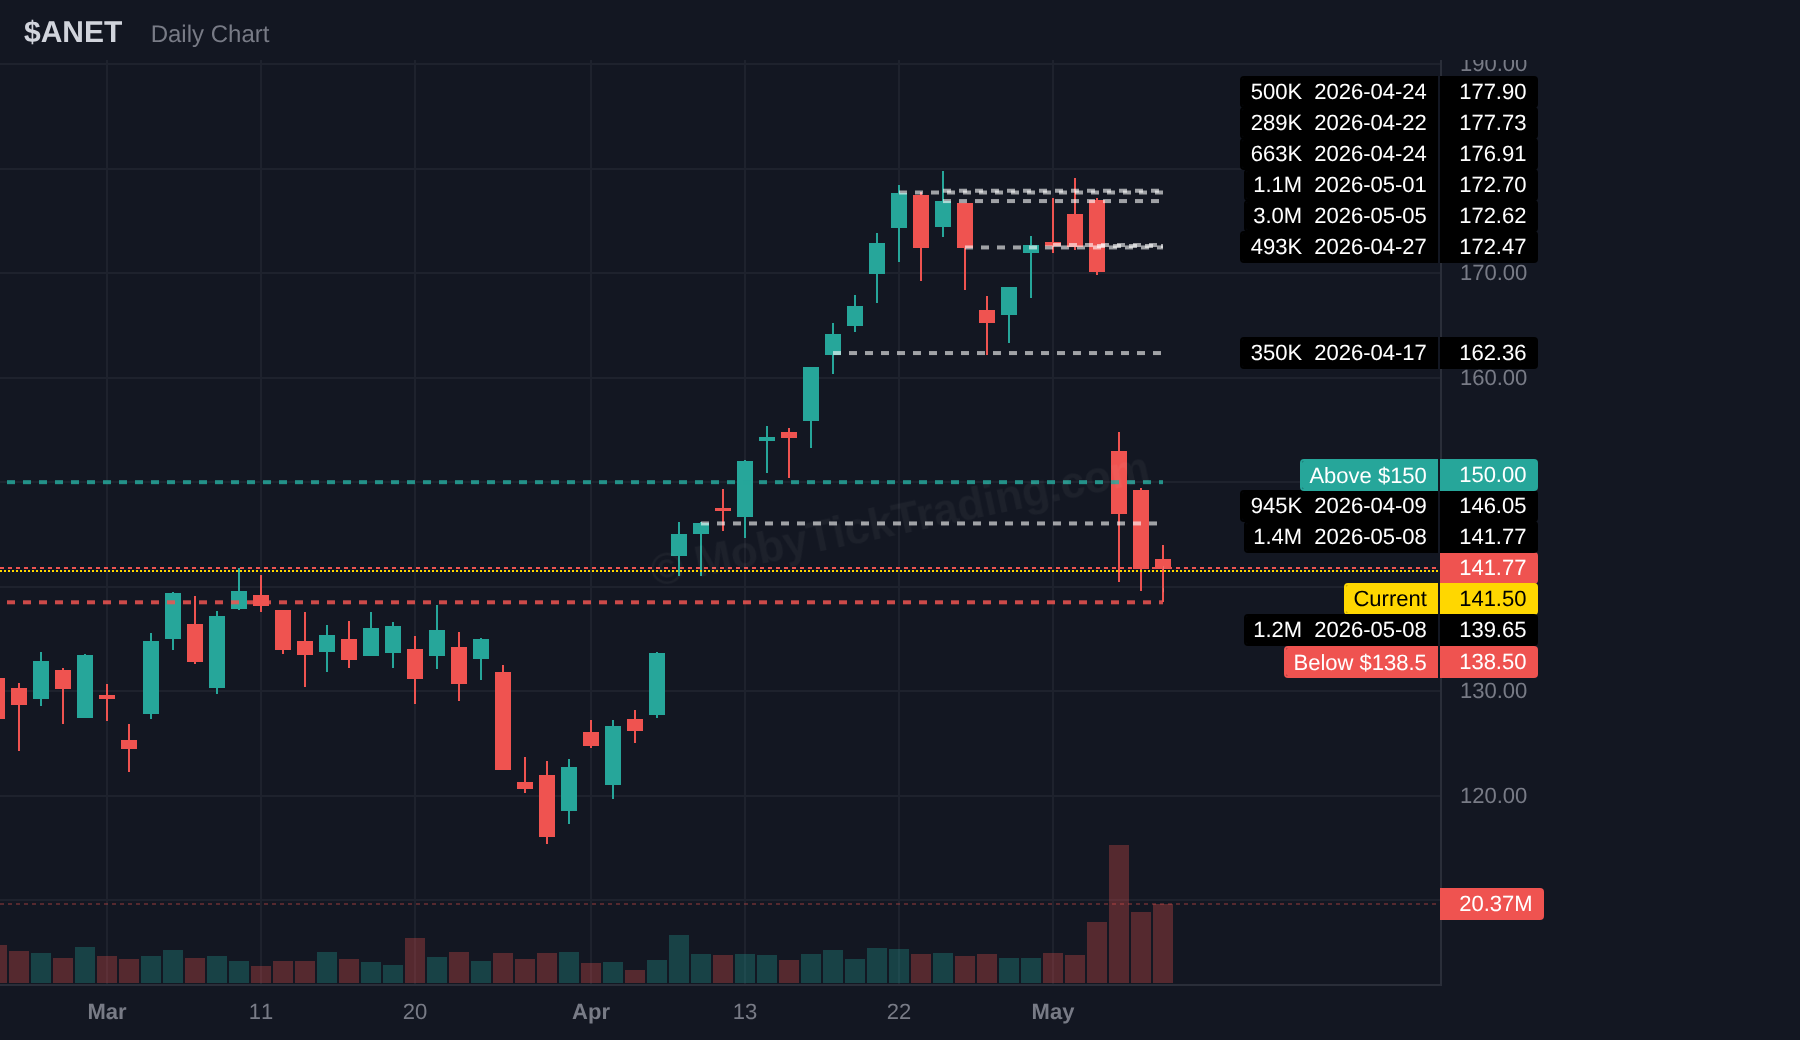
ANET printed three dark pool blocks all clustered at $172.62 — a textbook example of an institutional reference level being defended in size at a single price.
The setup begins at $150 above and $138.50 below.
🟢 Above $150 | T1 $152.50 | T2 $155 | T3 $157.50 | T4 $160 | T5 $162.50 | T6 $165
🔴 Below $138.50 | T1 $136.25 | T2 $135 | T3 $132.50 | T4 $130 | T5 $127.50 | T6 $125 | T7 $120
Dark Pool Context: $1,136.2M total flow | 7.64M shares | 9 prints | Avg print $148.74
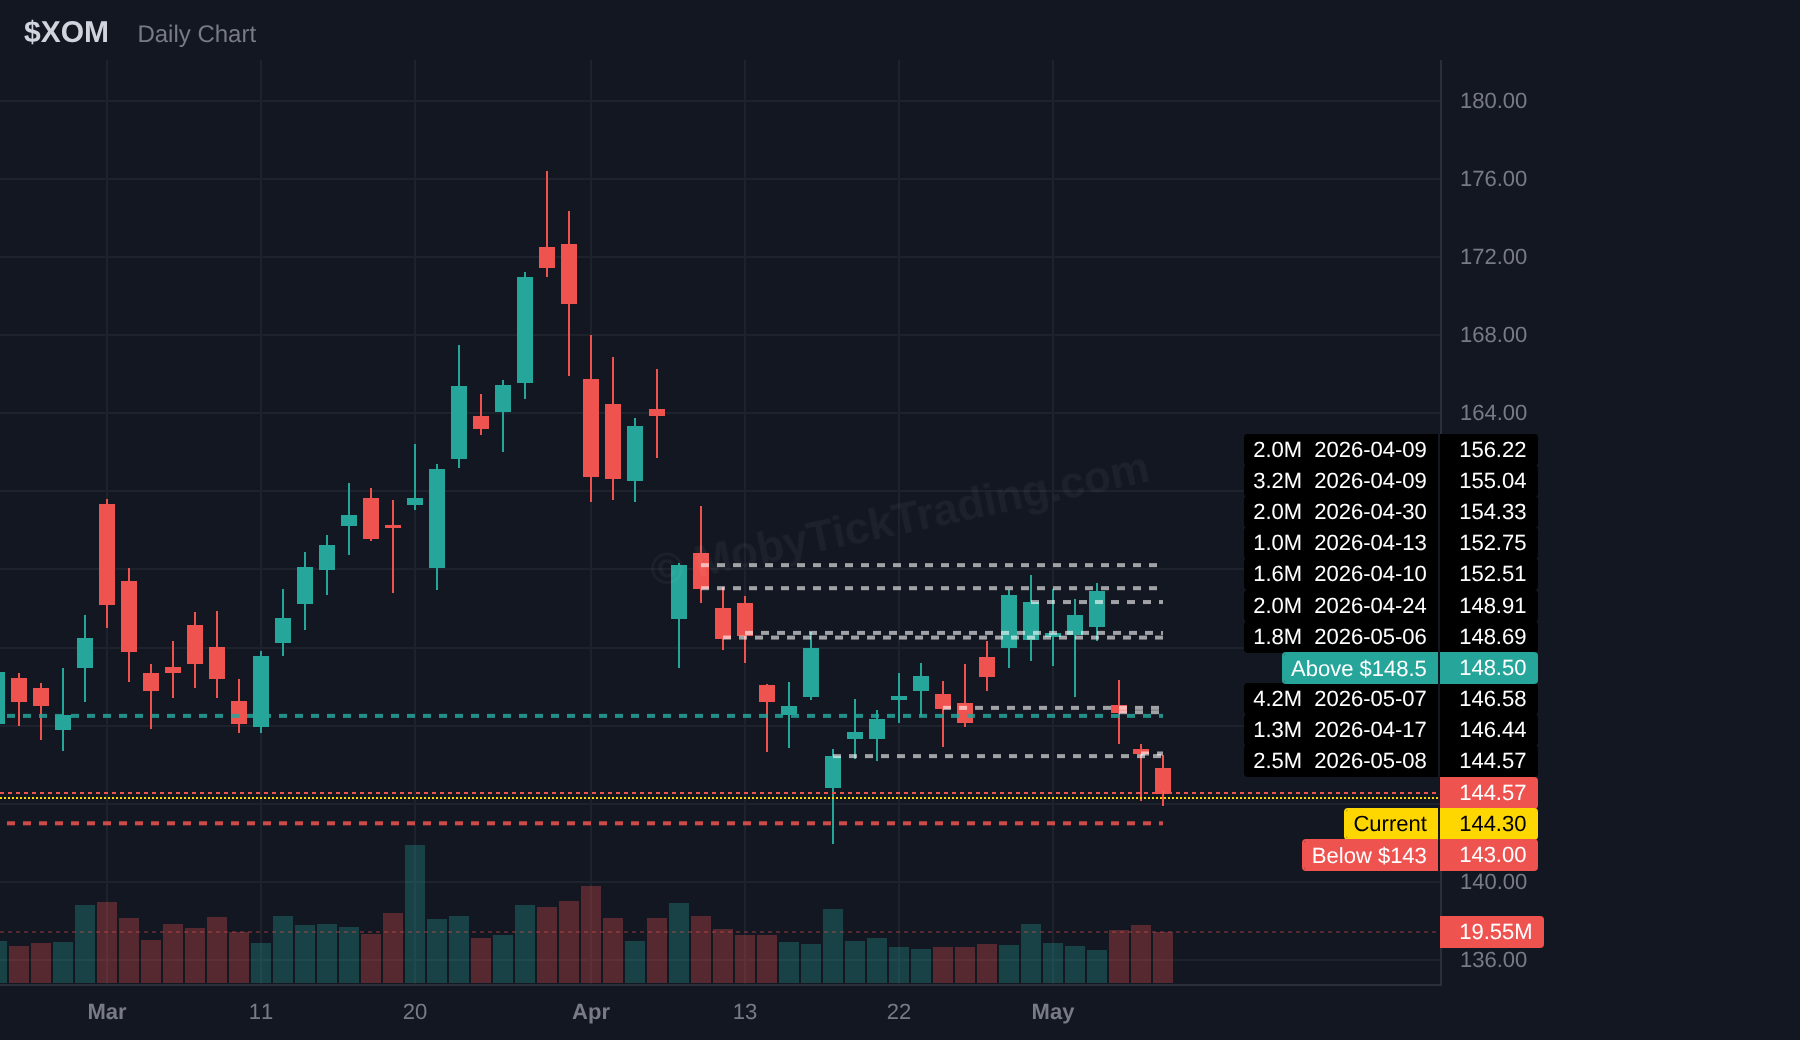
XOM generated $1.14 billion in dark pool flow across 9 prints — one of the most active energy single stocks on the board.
The new callout ladder is set at $148.50 above and $143 below.
🟢 Above $148.50 | T1 $150 | T2 $151.25 | T3 $152.50 | T4 $155 | T5 $157.50 | T6 $160
🔴 Below $143 | T1 $142 | T2 $140 | T3 $138 | T4 $136 | T5 $132.50 | T6 $130
Dark Pool Context: $558.3M total flow | 12.86M shares | 5 prints | Avg print $43.41
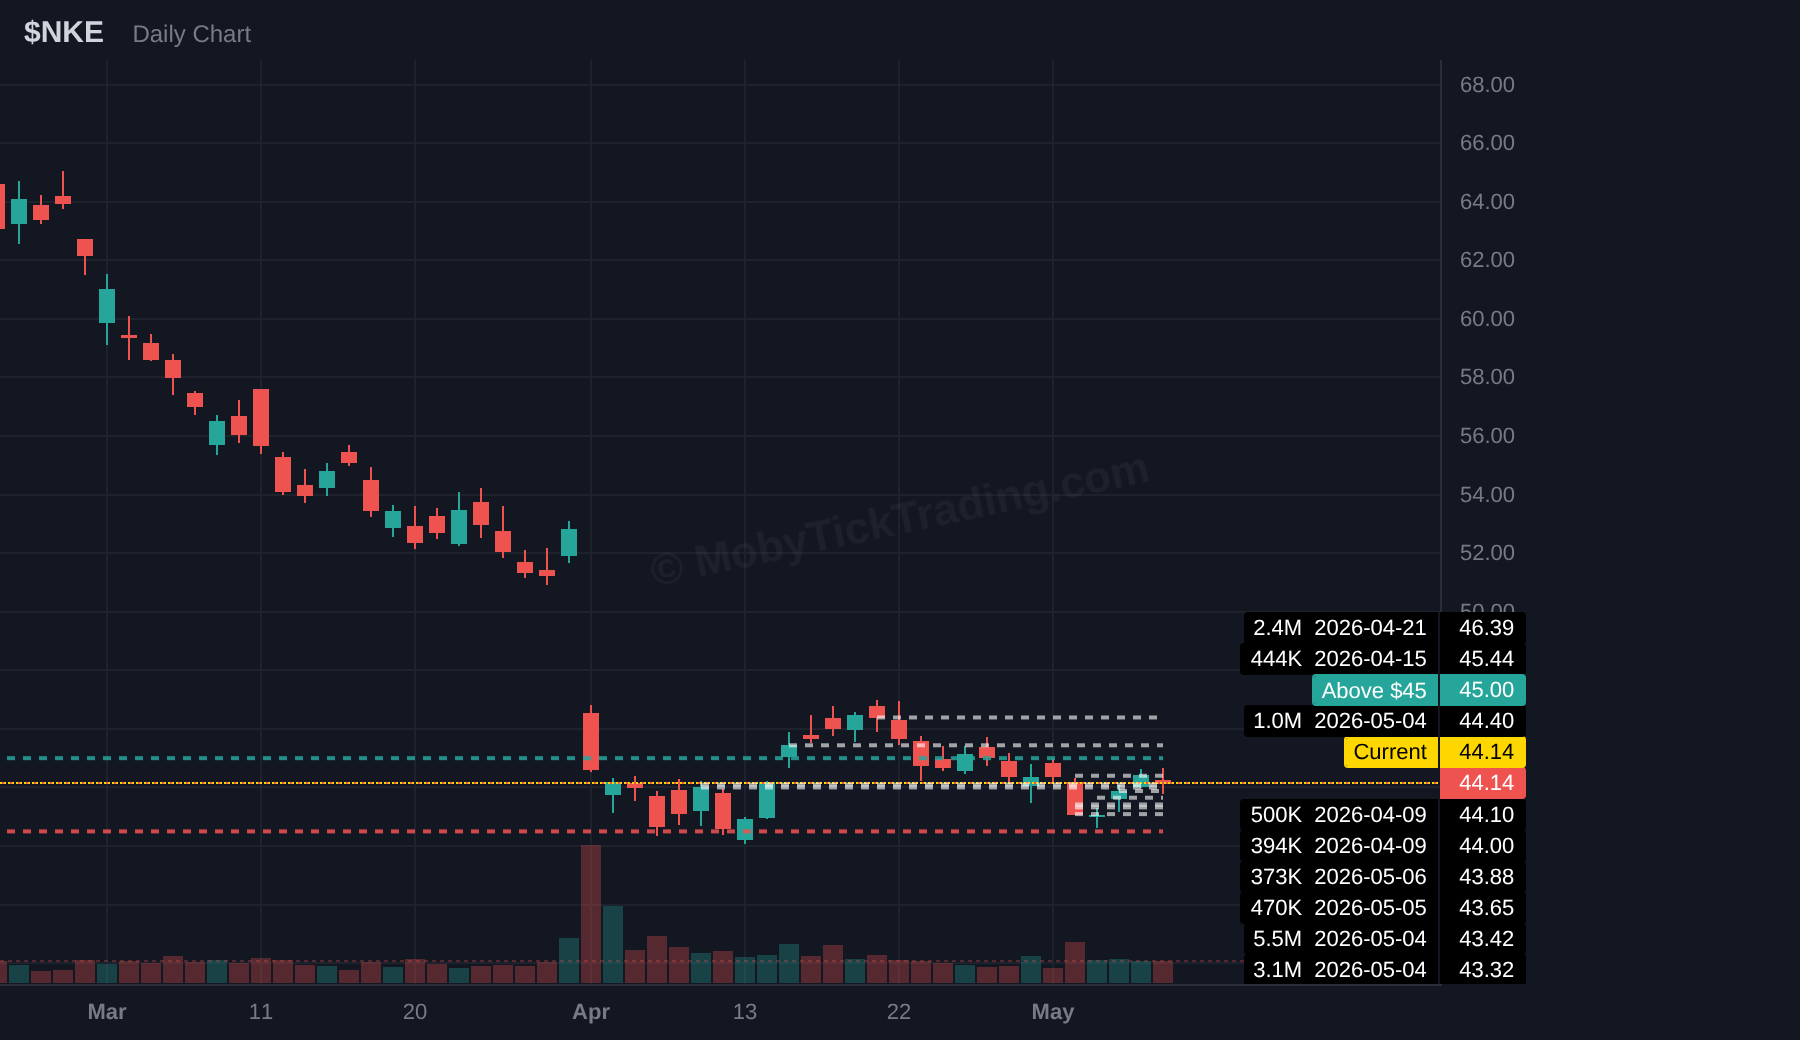
NKE printed $558.3 million across 5 dark pool blocks on 12.86M shares with the 0.09x volume-ratio signal flagging the activity as elevated for the name.
The fresh setup is anchored at $45 above and $42.50 below.
🟢 Above $45 | T1 $46 | T2 $47 | T3 $48 | T4 $49 | T5 $50
🔴 Below $42.50 | T1 $41 | T2 $40 | T3 $37.50 | T4 $35 | T5 $32.50 | T6 $30
Dark Pool Context: $554.0M total flow | 1.38M shares | 3 prints | Avg print $400.16
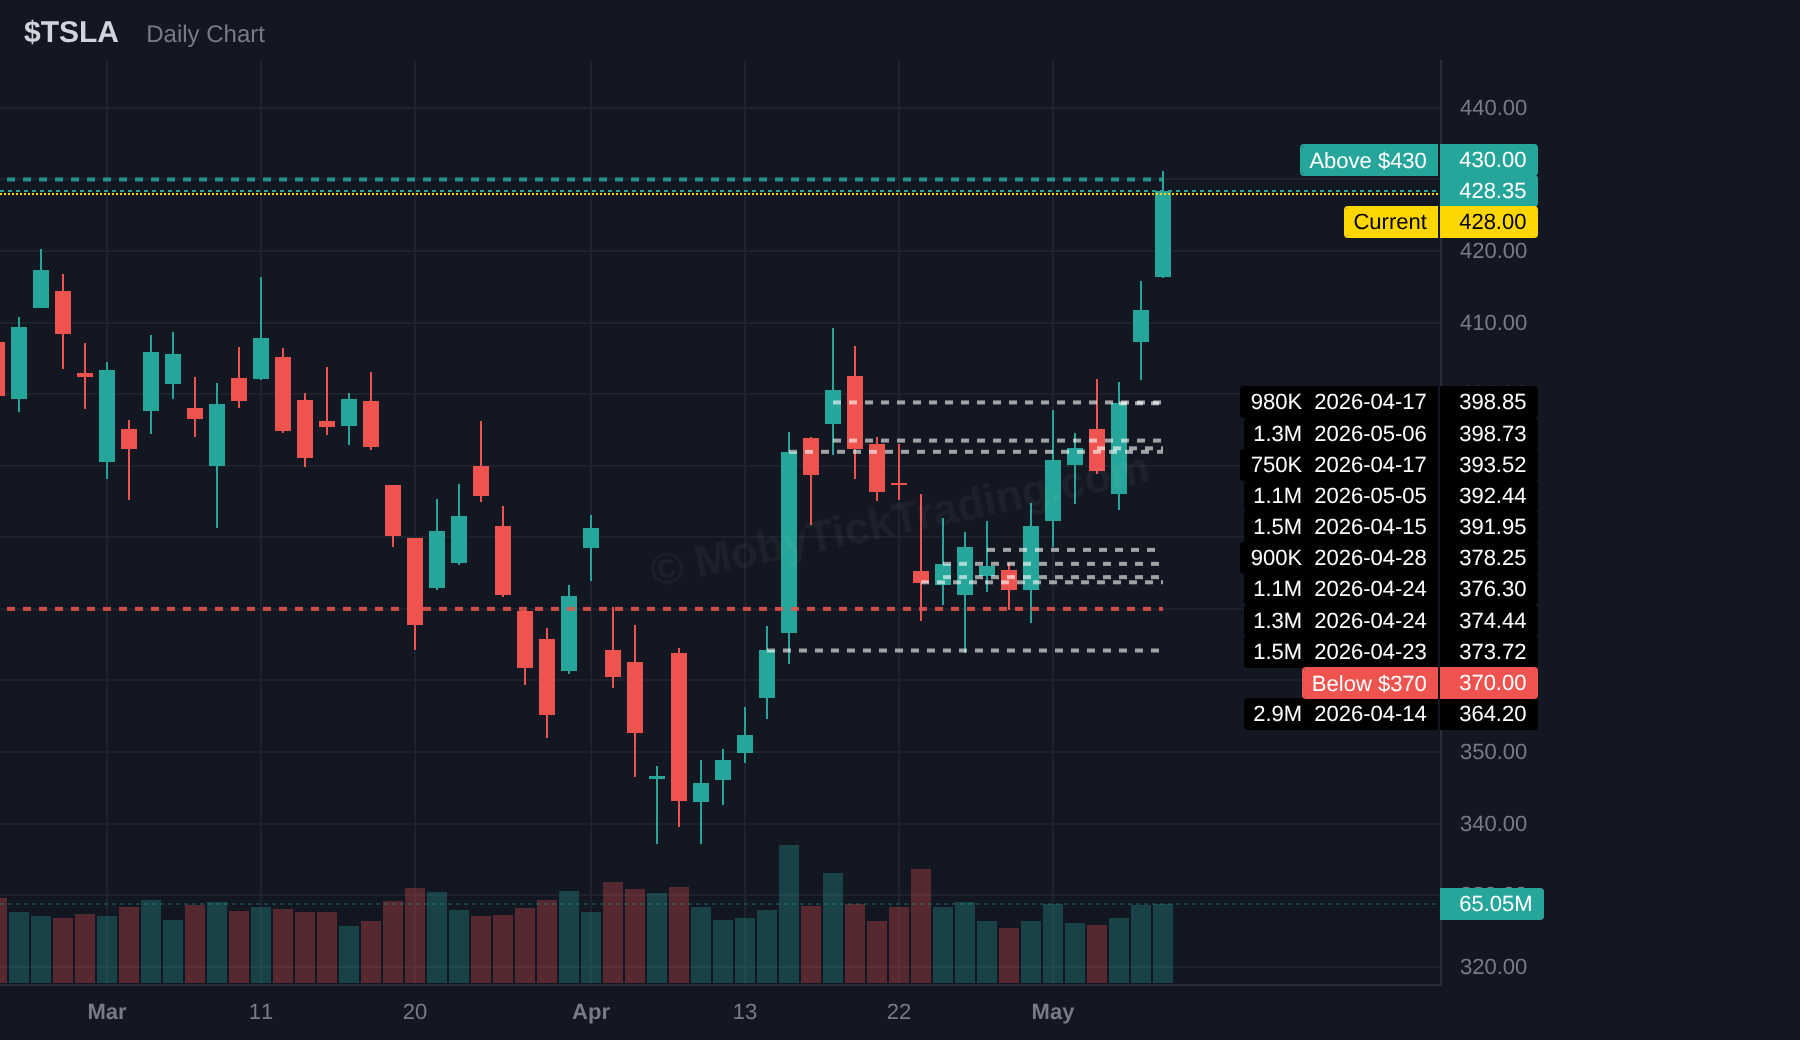
TSLA generated $554.0 million across 3 dark pool prints with average execution at $400.16.
The new ladder is set at $430 above and $370 below — wider spacing appropriate to TSLA volatility.
🟢 Above $430 | T1 $440 | T2 $450 | T3 $460 | T4 $475 | T5 $500
🔴 Below $370 | T1 $360 | T2 $350 | T3 $340 | T4 $330 | T5 $320 | T6 $300
Dark Pool Context: $428.1M total flow | 7.55M shares | 3 prints | Avg print $56.66
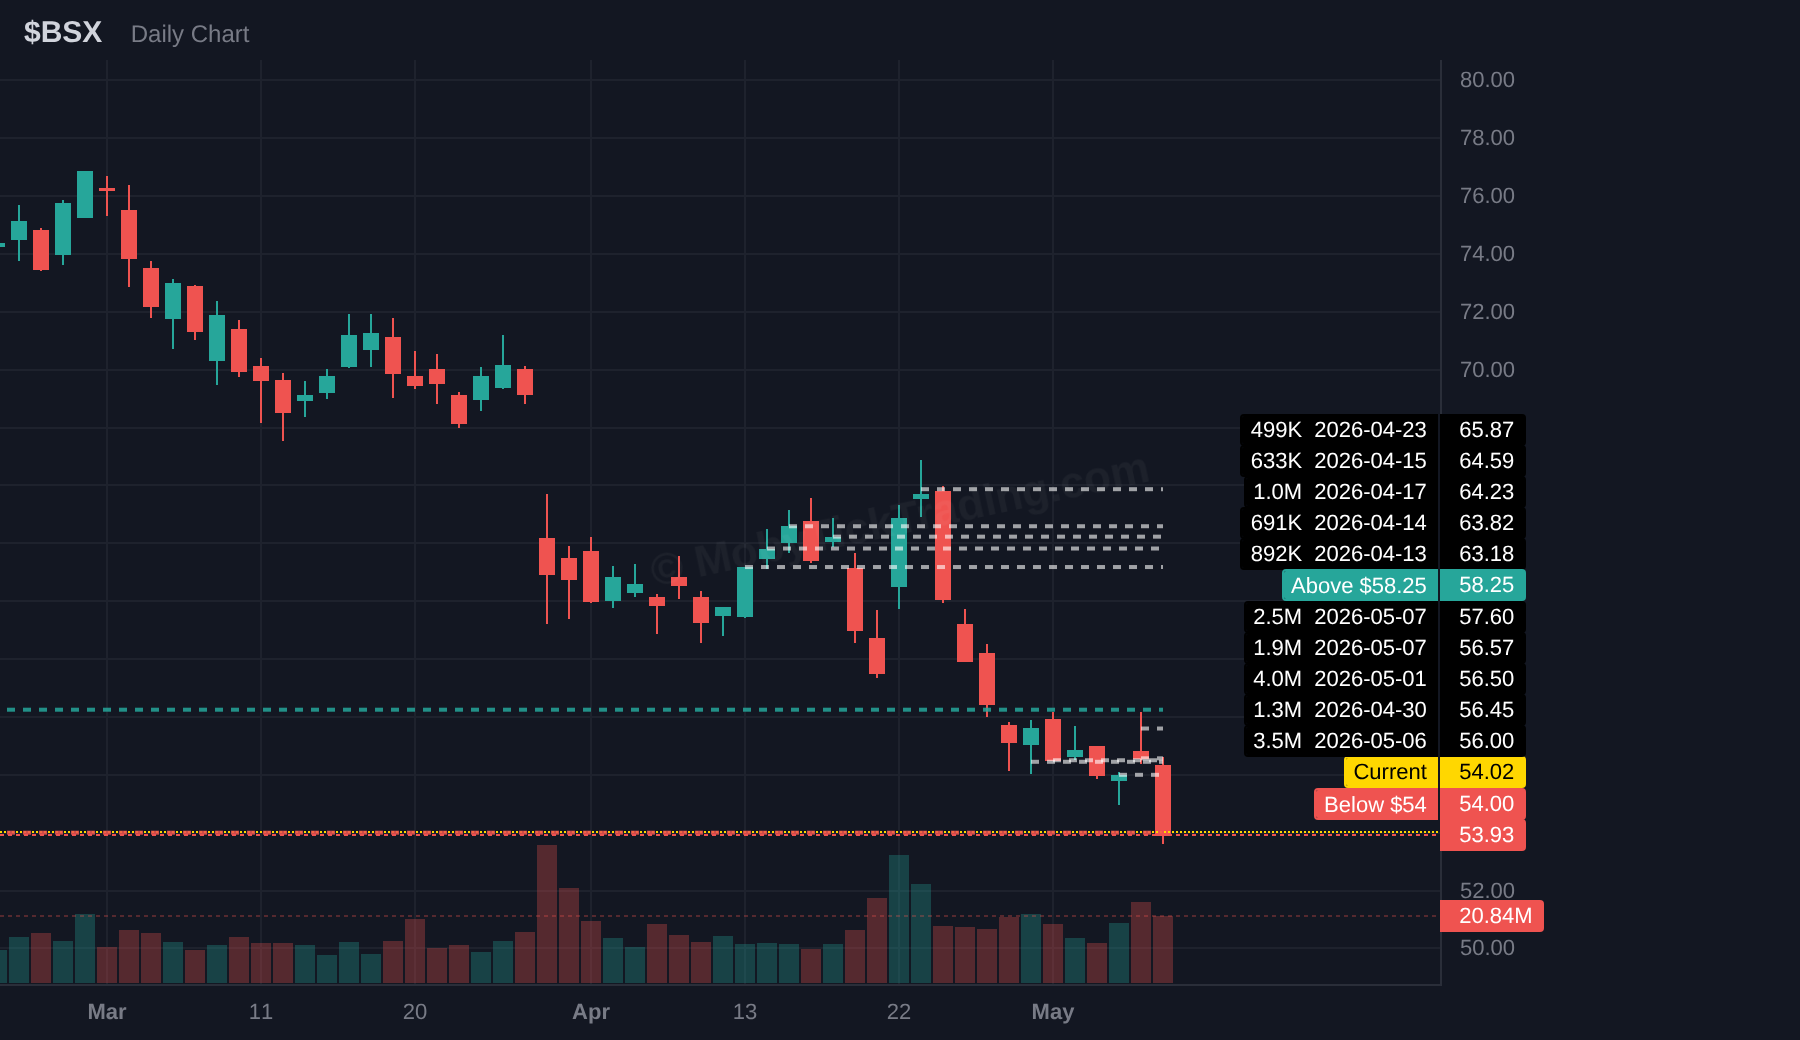
BSX printed $428.1 million across 3 dark pool blocks on 7.55M shares. Average dark pool execution was $56.66.
The fresh callout begins at $58.25 above and $54 below.
🟢 Above $58.25 | T1 $60 | T2 $61.25 | T3 $62.50 | T4 $65 | T5 $67.50 | T6 $70
🔴 Below $54 | T1 $53 | T2 $52 | T3 $50 | T4 $47.50 | T5 $45 | T6 $43
A common question every Monday: “The new report is out — does that mean last week’s callouts are over?” The short answer is no. A new newsletter doesn’t close out the prior week’s setups. If a name triggered above a level and is still trending, the trade is still valid. The newsletter resets the callout sheet every week — it does not reset the trade.
The cleanest way to manage these continuation trades is with the 4 and 8 exponential moving averages on the daily chart:
Take profit along the way, but leave some to run. Scaling out at the listed targets — T1, T2, T3 — locks in the move while still leaving size on for the longer trend. Leaving even a small runner can dramatically change the math on the trade if a name extends well beyond the original target ladder.
A live example: MU has been called out for several weeks now. Look at MU’s weekly chart — the name has held its weekly EMAs the entire time, with each new weekly bar continuing to build on the prior one rather than rolling over. Anyone who took partial profits at each interim target and left a piece on the table watched the trade extend to $747.21 last week — well beyond what most readers would have expected when MU first triggered above the original callout level.
The takeaway: the callouts are the entry framework. The 4 and 8 EMA are the exit framework. Combine partial profit-taking with a small runner, and the math works in your favor over time.
Disclaimer: Dark pool prints represent off-exchange trade reports filed with FINRA. MobyTick aggregates and analyzes this data for informational purposes only. This report is for educational and informational use. It is not financial advice. All investments involve risk. Past performance does not guarantee future results.
Stop guessing. Start tracking where the smart money is. View Plans →