Physical Address
304 North Cardinal St.
Dorchester Center, MA 02124
Physical Address
304 North Cardinal St.
Dorchester Center, MA 02124

MobyTick's weekly dark pool report for September 14-18, 2026: 13 tickers with above and below trigger levels, last week's callout scorecard, ETF dark pool flow, and a plain-English look at why the week before quadruple witching behaves differently.
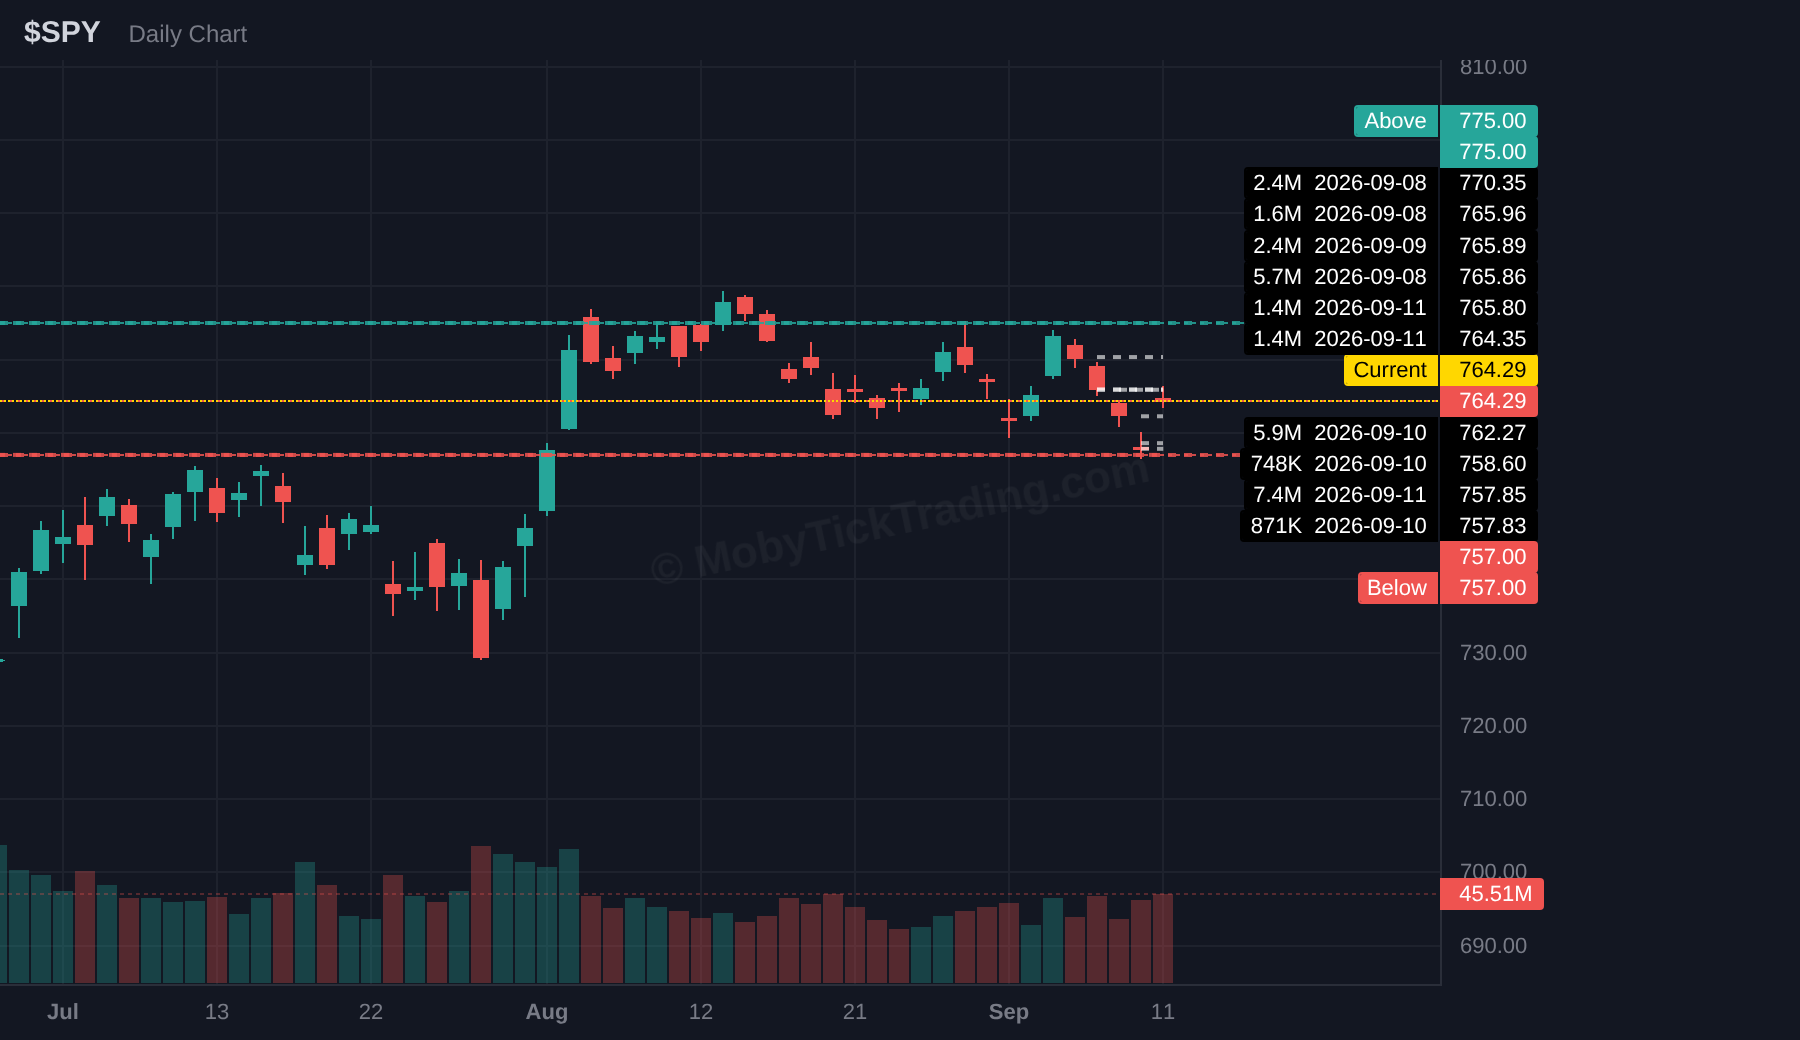
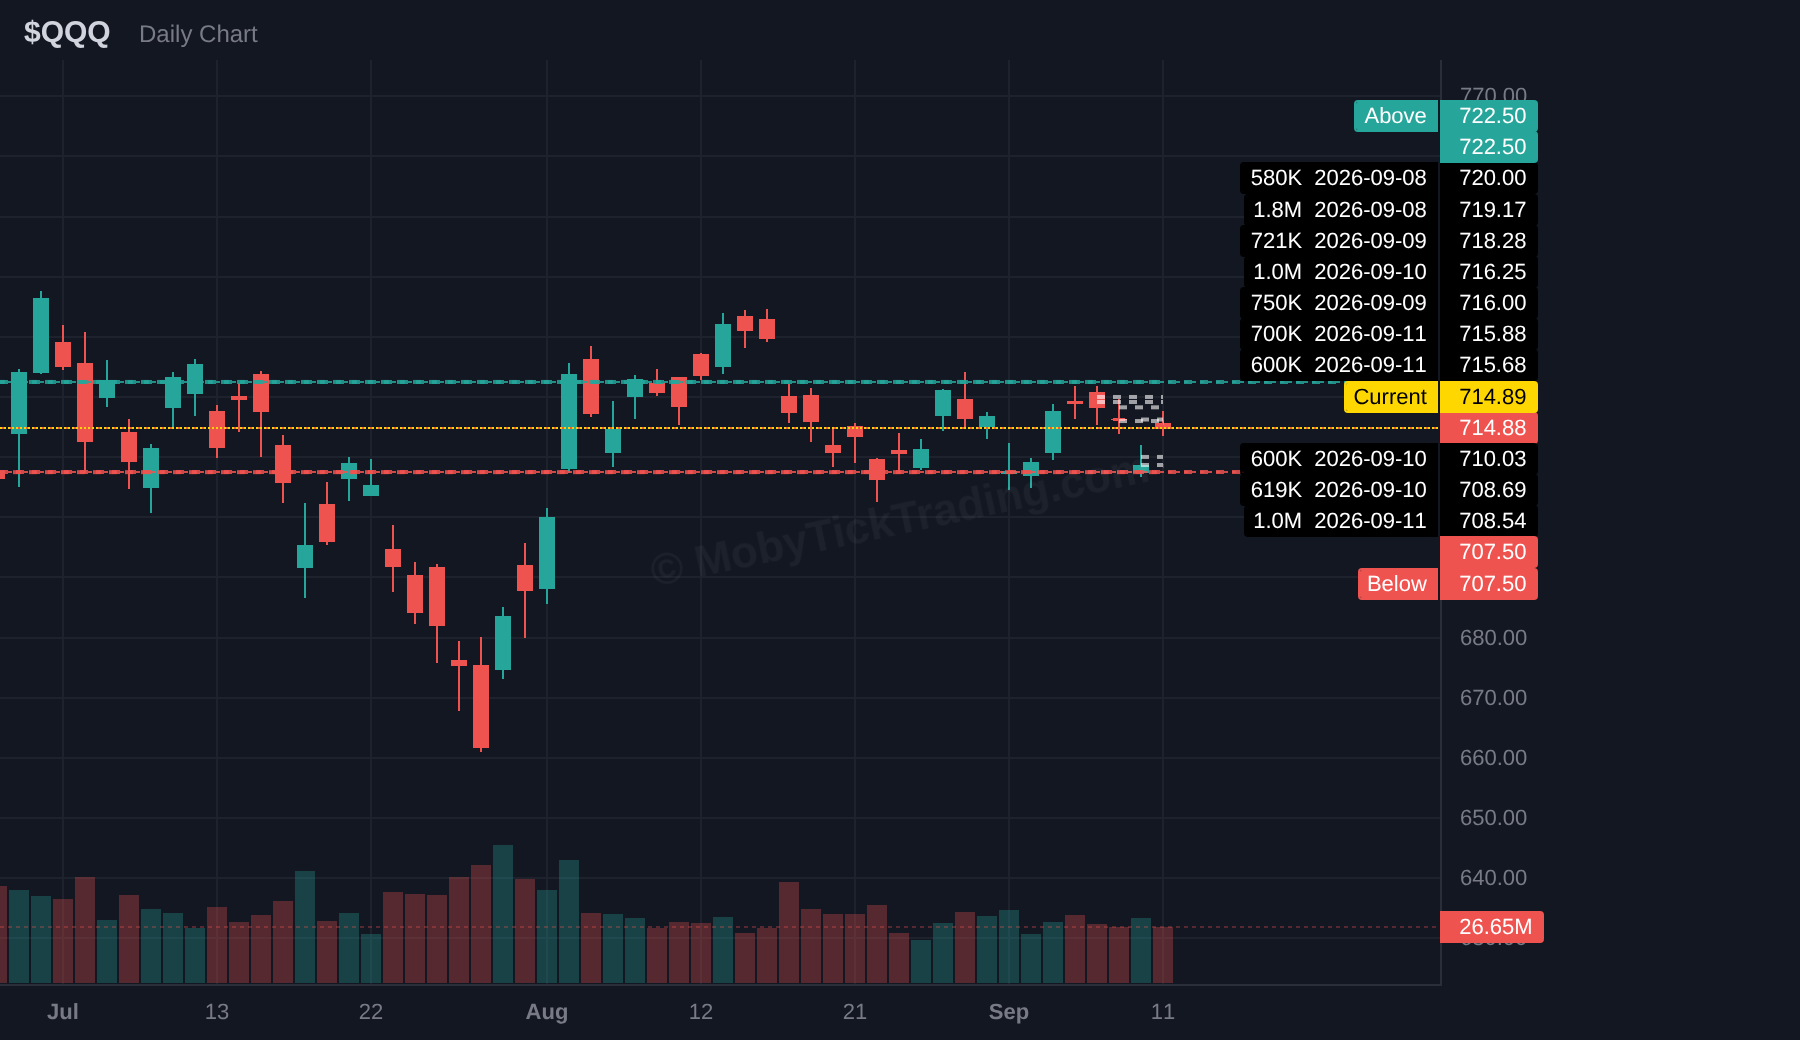
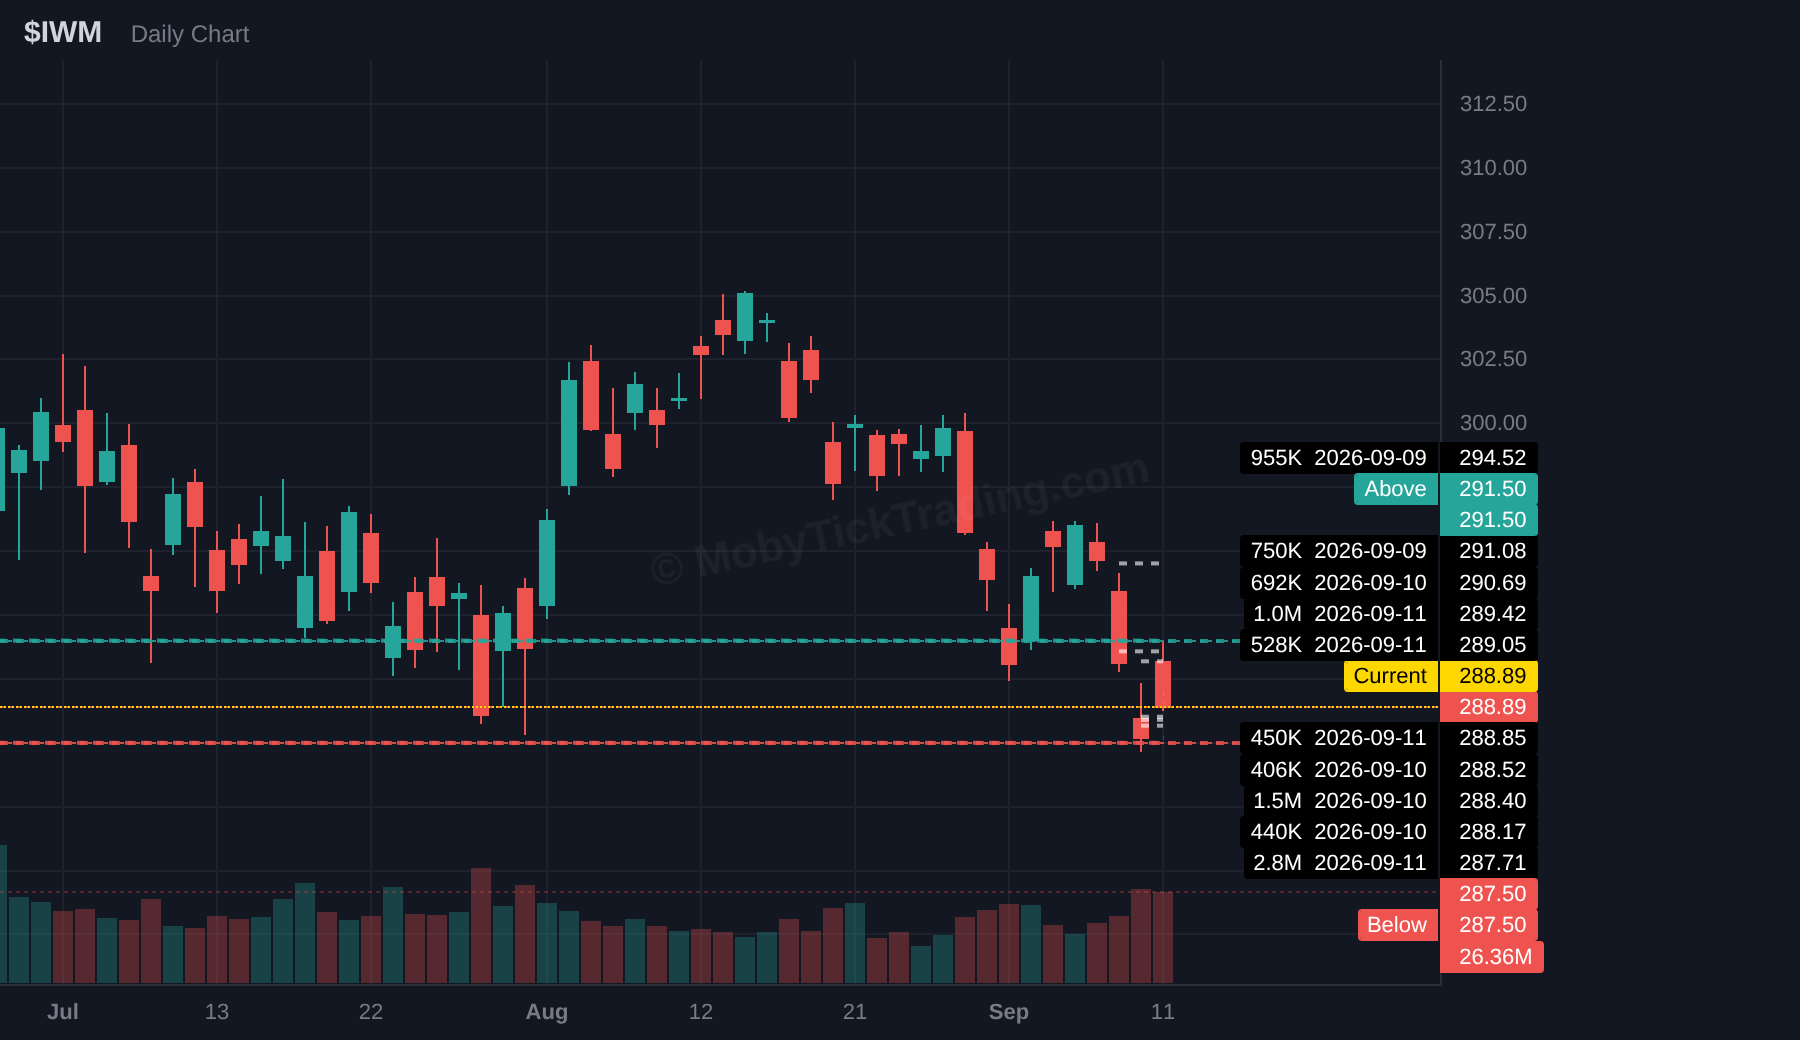
The major ETFs finished the holiday-shortened week lower. SPY closed at 764.29 inside a 756.64 to 769.70 weekly range, off 0.77% from the prior Friday close. QQQ closed 714.88 in a 706.855 to 721.886 range, down 0.57%. IWM closed 288.89 in a 287.18 to 296.10 range, down 2.41%, the widest weekly decline of the four. DIA closed 525.79 in a 519.80 to 530.39 range, down 1.55%. The daily sequence was the same for all four names: each declined Tuesday, Wednesday and Thursday, then rose on Friday. Thursday September 10 marked the weekly low close for SPY, QQQ, IWM and DIA alike.
Two inflation prints framed the week. August PPI was released Thursday September 10 at final demand +0.4% month-over-month and +5.4% for the twelve months ended August, with core PPI at +0.2%. August CPI followed on Friday September 11 at +0.4% month-over-month and +3.4% year-over-year, with core CPI at 2.4% year-over-year. Two dated items sit inside the September 14 to 18 window. The FOMC holds a two-day meeting Tuesday September 15 through Wednesday September 16, with the policy decision due Wednesday afternoon. Friday September 18 is the quarterly quadruple witching expiration, the third Friday of the quarter. No CPI or PPI release falls in the coming week.
The 13 callouts from the prior issue met their marked levels as follows: 7 tagged the Above level, 4 tagged the Below level, and 2 stayed inside the band all week, those being QQQ and MSFT. Ten of the 13 reached at least one marked target.
The widest excursions past an Above level came from CRWV, which ran 14.93% past its 91.00 marker to a 104.59 high and reached its fourth target at 100.00. SUNB stretched 10.81% past 70.00 to a 77.565 high and also reached a fourth target, at 77.50. INTC ran 9.43% past 97.50 to 106.69 and reached its third target at 105.00. META extended 6.28% past 625.00 to 664.24 and reached a third target at 660.00. WDC ran 5.42% past 470.00 to a 495.49 high and tagged its first target at 485.00.
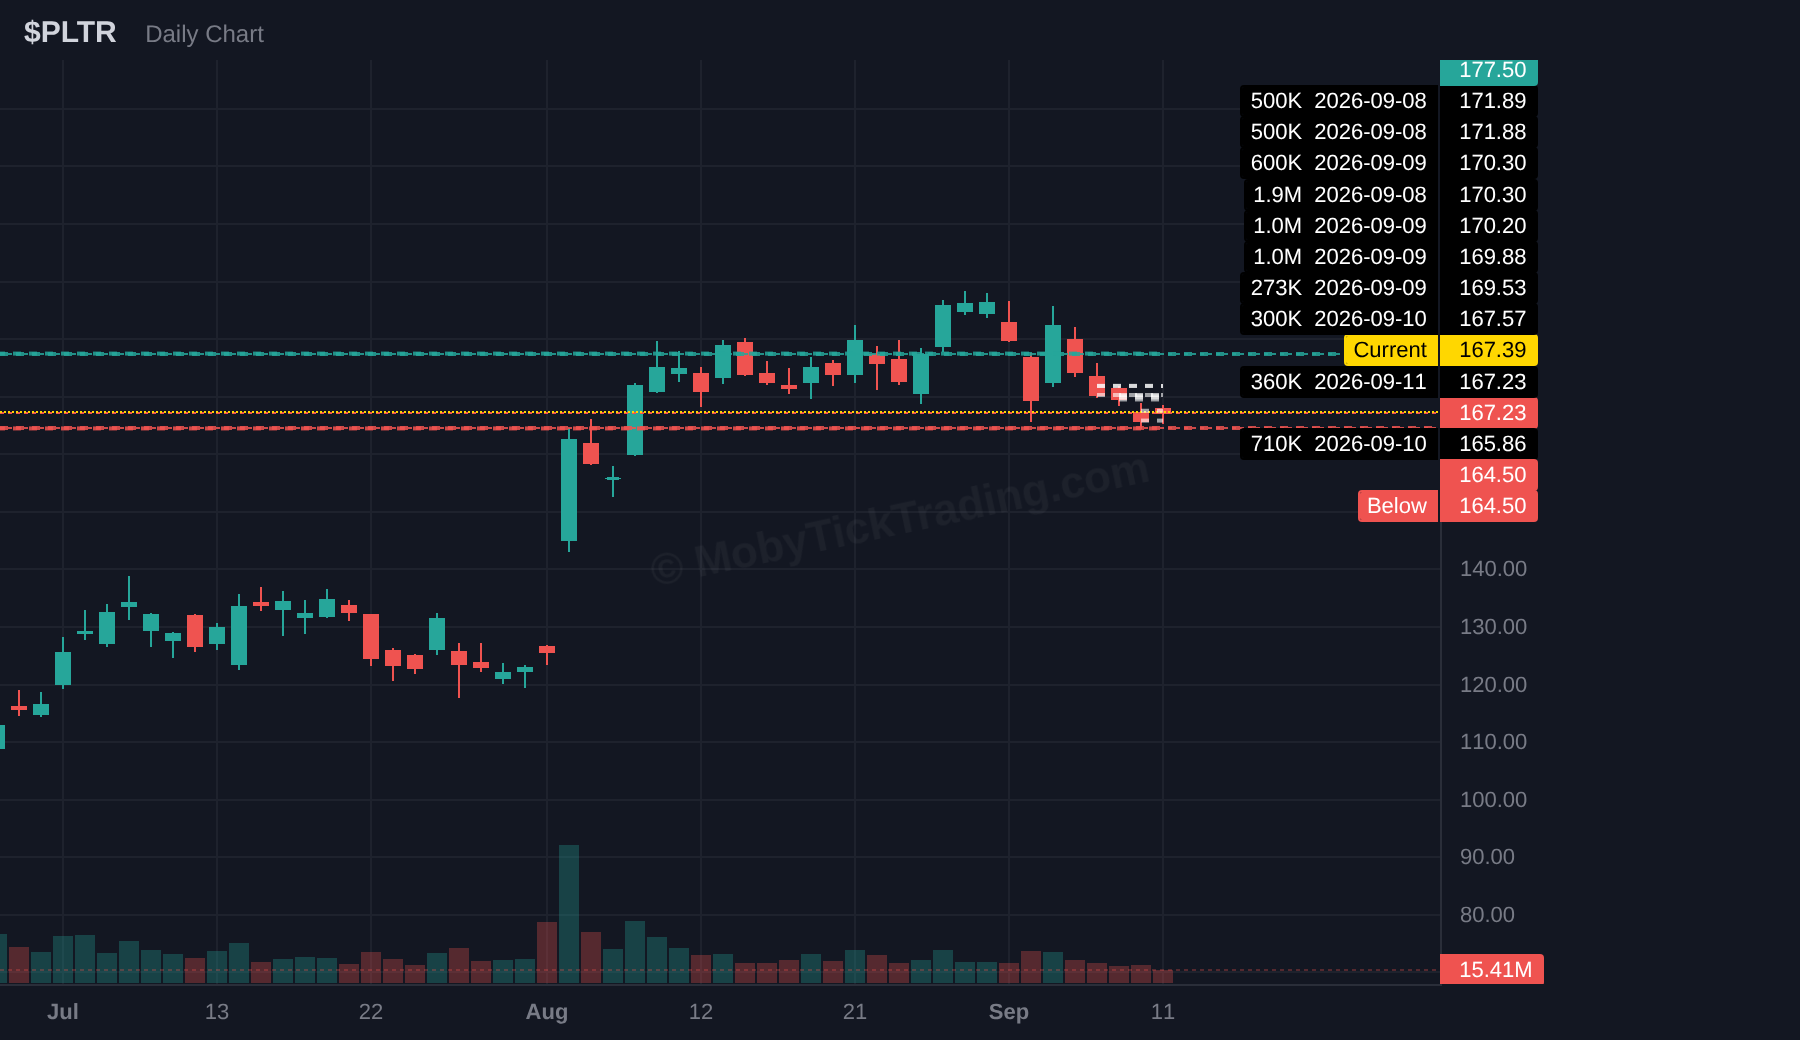
On the Below side, SPY crossed 760.00 and reached its first target at 757.50 with a 756.64 low. IWM crossed 290.00 and reached its first target at 287.50 with a 287.18 low. PLTR crossed 169.00 and reached a second target at 165.00 with a 164.55 low. MCHP crossed 71.00 but printed a 70.94 low and reached no marked target.
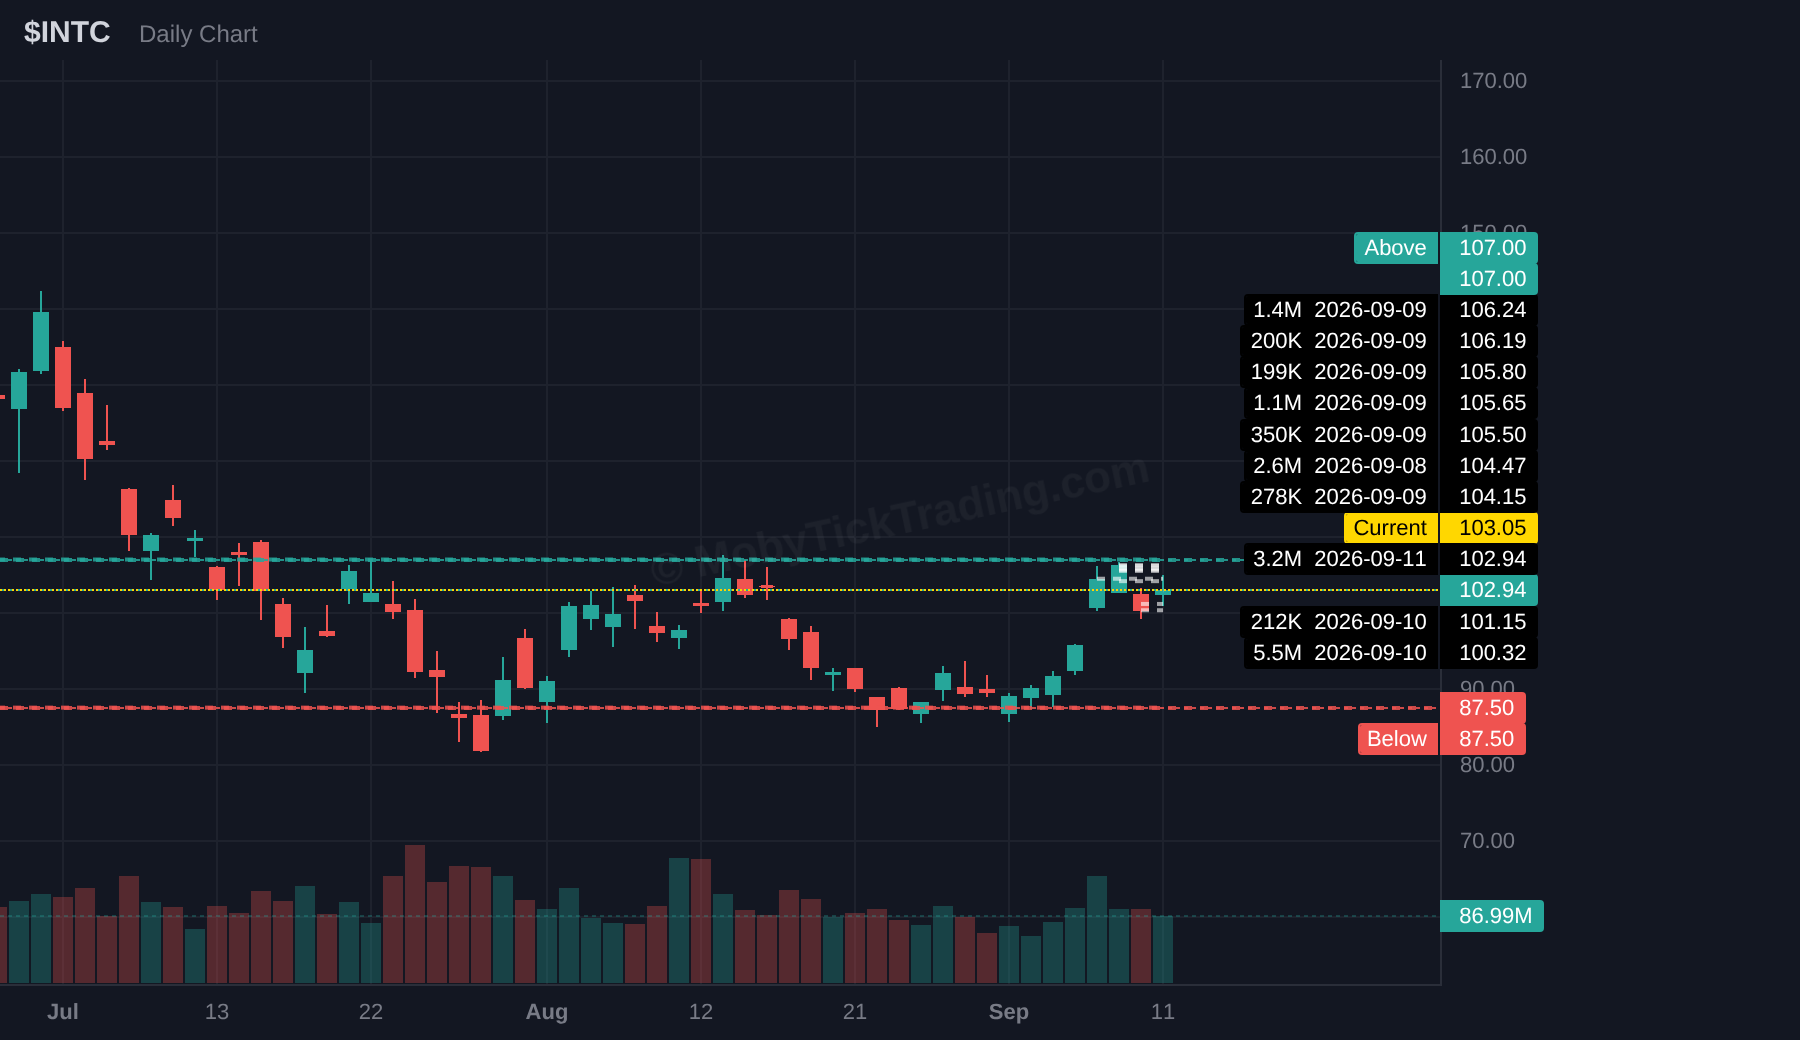
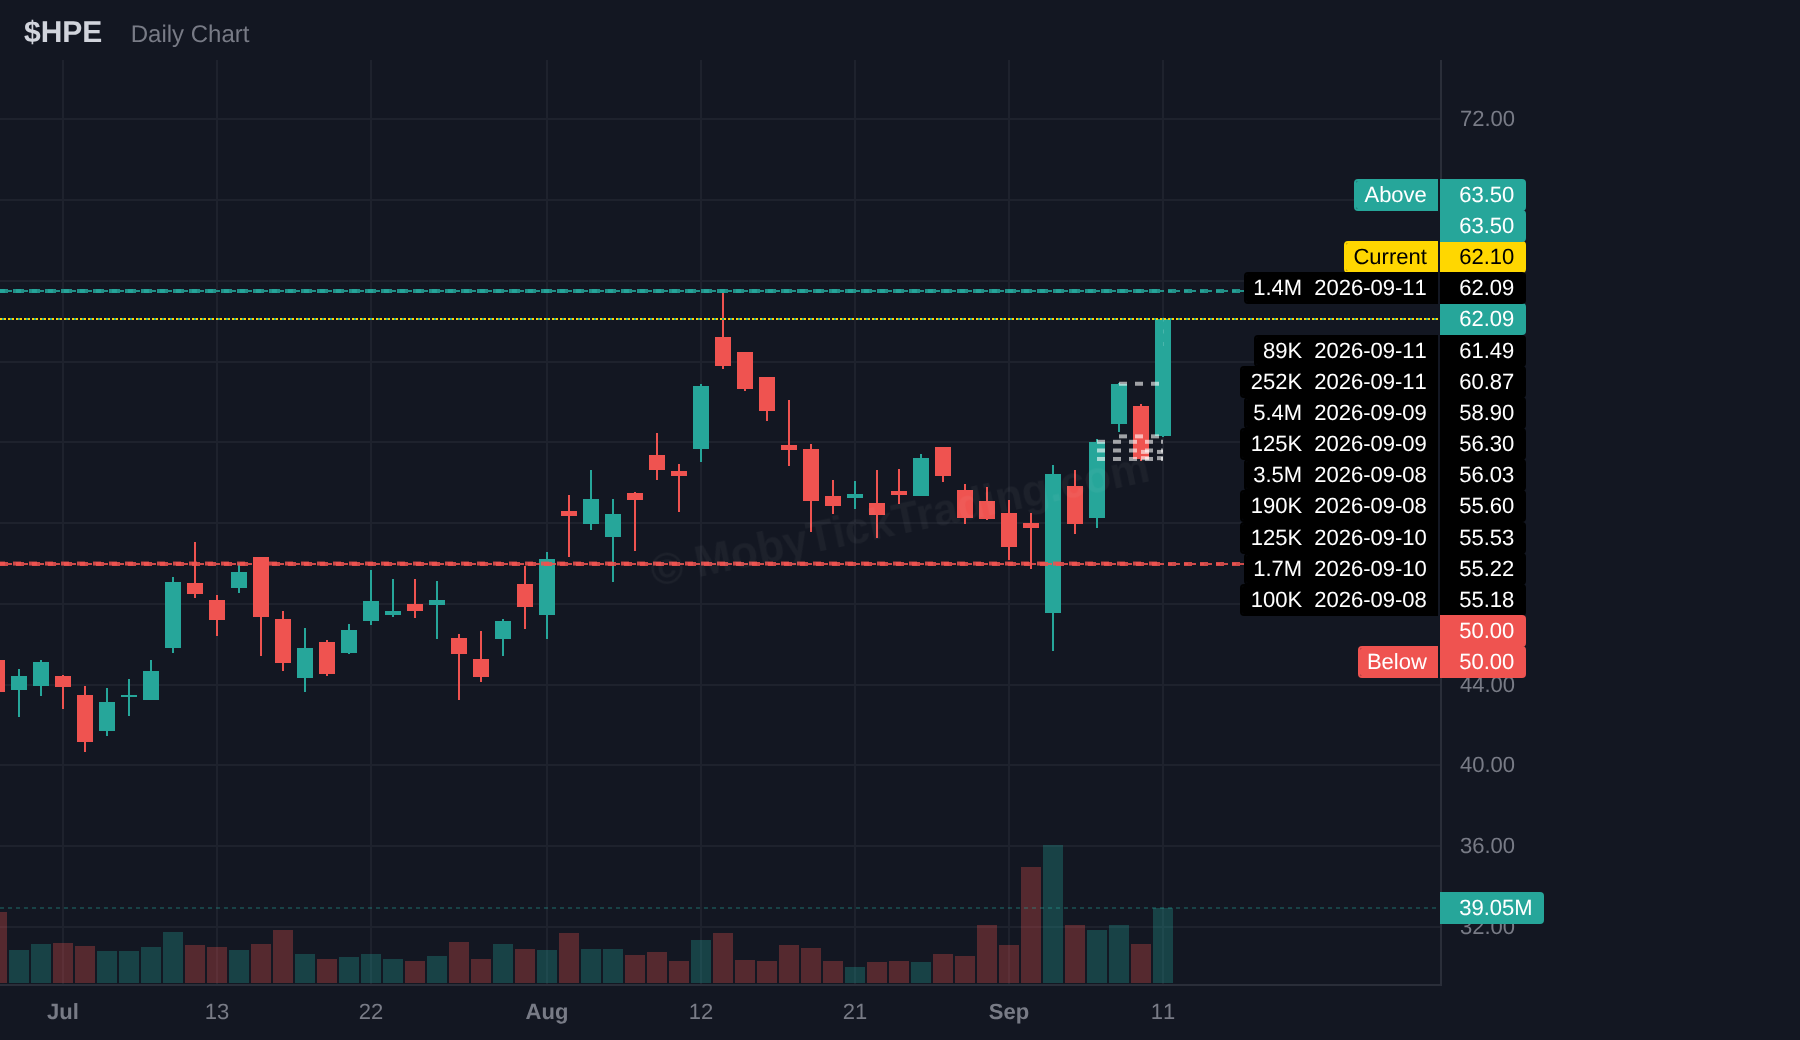
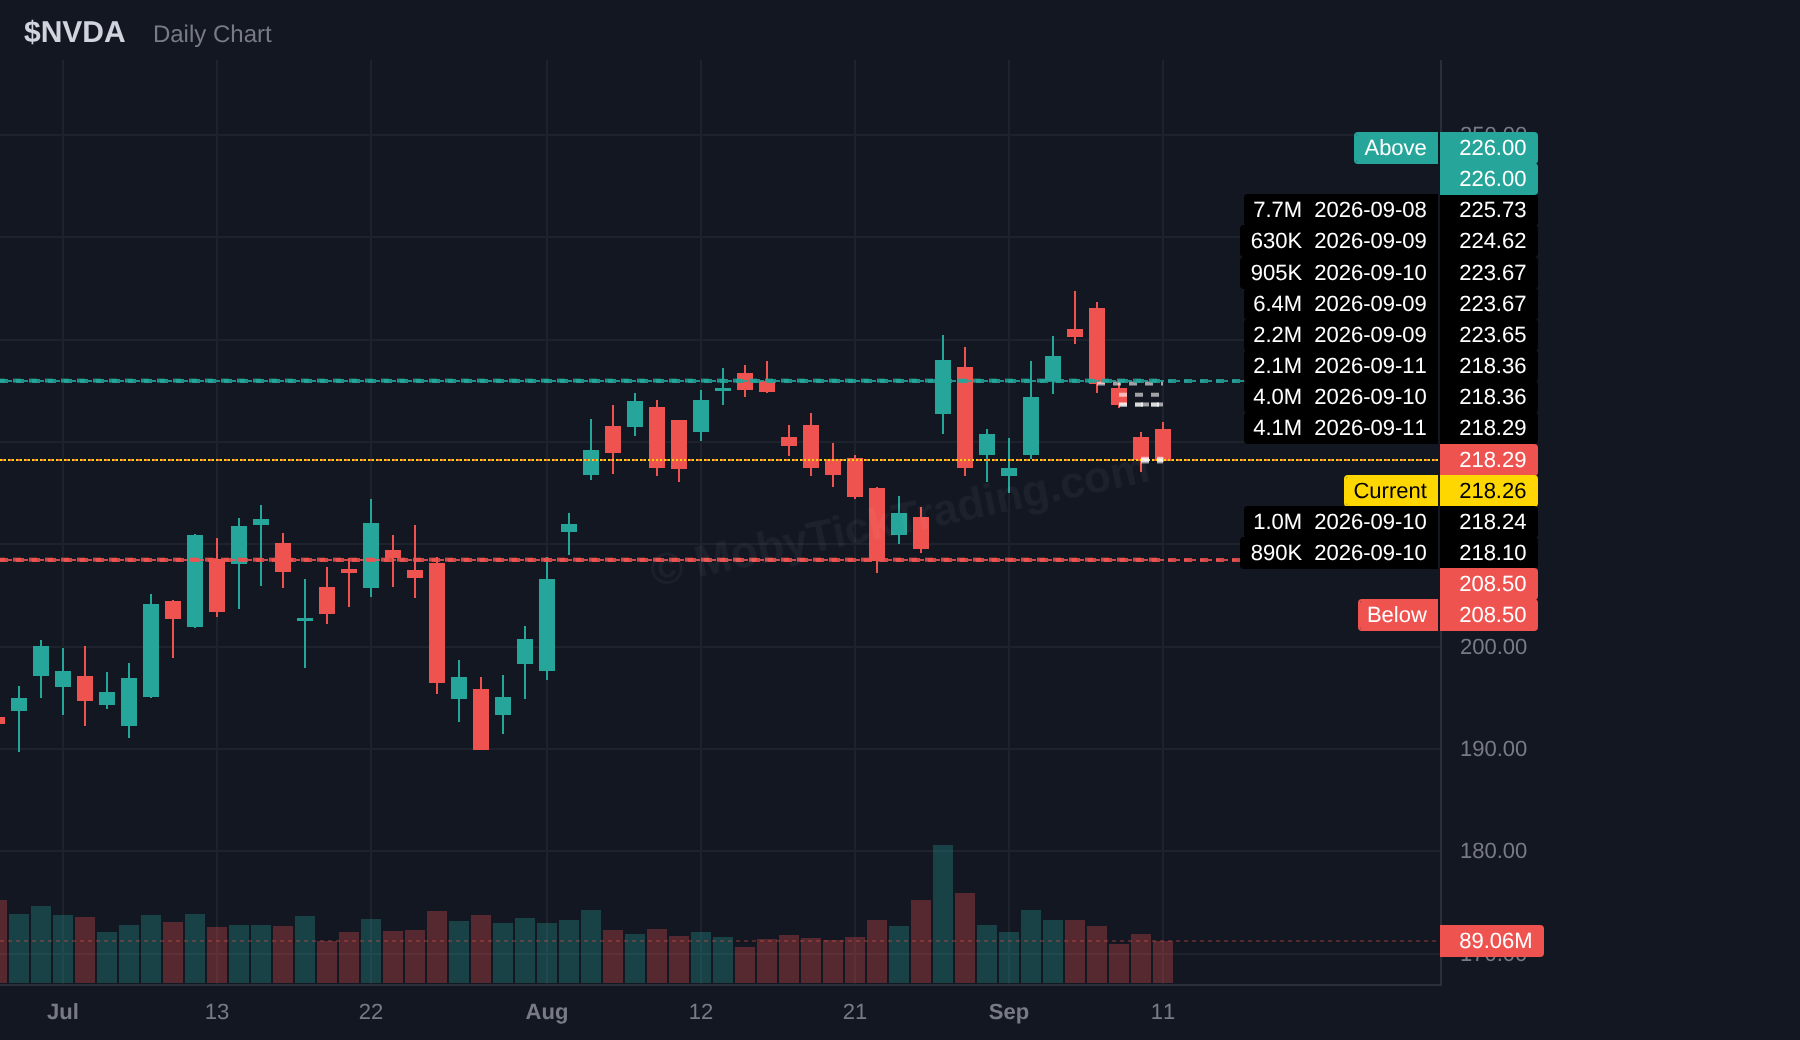
Thirteen tickers carry levels into the September 14 to 18 week: SPY, QQQ, IWM, AADX, INTC, HPE, NVDA, PLTR, UNH, AMZN, WMT, NXPI and MRK. Five repeat from last week’s sheet: SPY, QQQ, IWM, INTC and PLTR. Eight are new: AADX, HPE, NVDA, UNH, AMZN, WMT, NXPI and MRK. Levels, targets, and dark pool notional for each name follow below.
Data sourced from MobyTick.
| Ticker | Above | Below | High | Low | Close | Triggered | Targets Hit | Move From Trigger |
|---|---|---|---|---|---|---|---|---|
| SPY | 780 | 760 | 769.7 | 756.64 | 764.29 | Below | 1 of 6 → T1 ($757.5) | $760 → $756.64 (-0.44%) |
| QQQ | 725 | 705 | 721.886 | 706.855 | 714.88 | None | — | — |
| IWM | 300 | 290 | 296.1 | 287.18 | 288.89 | Below | 1 of 6 → T1 ($287.5) | $290 → $287.18 (-0.97%) |
| SPCX | 152.5 | 132.5 | 155 | 144.89 | 151.21 | Above | 1 of 7 → T1 ($155) | $152.5 → $155 (+1.64%) |
| WDC | 470 | 440 | 495.49 | 442.78 | 447.18 | Above | 1 of 6 → T1 ($485) | $470 → $495.49 (+5.42%) |
| CRWV | 91 | 81 | 104.59 | 88.62 | 88.99 | Above | 4 of 5 → T4 ($100) | $91 → $104.59 (+14.93%) |
| MSFT | 517.5 | 480 | 498.97 | 486 | 495.63 | None | — | — |
| SUNB | 70 | 65 | 77.565 | 67.395 | 72.68 | Above | 4 of 5 → T4 ($77.5) | $70 → $77.565 (+10.81%) |
| PLTR | 187.5 | 169 | 175.82 | 164.55 | 167.23 | Below | 2 of 4 → T2 ($165) | $169 → $164.55 (-2.63%) |
| META | 625 | 600 | 664.24 | 609.74 | 648.03 | Above | 3 of 4 → T3 ($660) | $625 → $664.24 (+6.28%) |
| CVX | 212.5 | 200 | 217.4 | 209.18 | 214.06 | Above | 1 of 5 → T1 ($215) | $212.5 → $217.4 (+2.31%) |
| MCHP | 76 | 71 | 75.16 | 70.94 | 74.2 | Below | 0 of 5 | $71 → $70.94 (-0.08%) |
| INTC | 97.5 | 86.25 | 106.69 | 99.34 | 102.94 | Above | 3 of 6 → T3 ($105) | $97.5 → $106.69 (+9.43%) |
Above triggered: 7 · Below triggered: 4 · Not triggered: 2
Tickers reaching ≥1 target: 10
| Ticker | Above Trigger | Targets |
|---|---|---|
| SPY | $775.00 | $778.25 → $780.00 → $785.00 → $790.00 → $795.00 → $800.00 |
| QQQ | $722.50 | $725.00 → $730.00 → $735.00 → $740.00 → $745.00 |
| IWM | $291.50 | $293.25 → $295.00 → $297.50 → $300.00 → $302.50 |
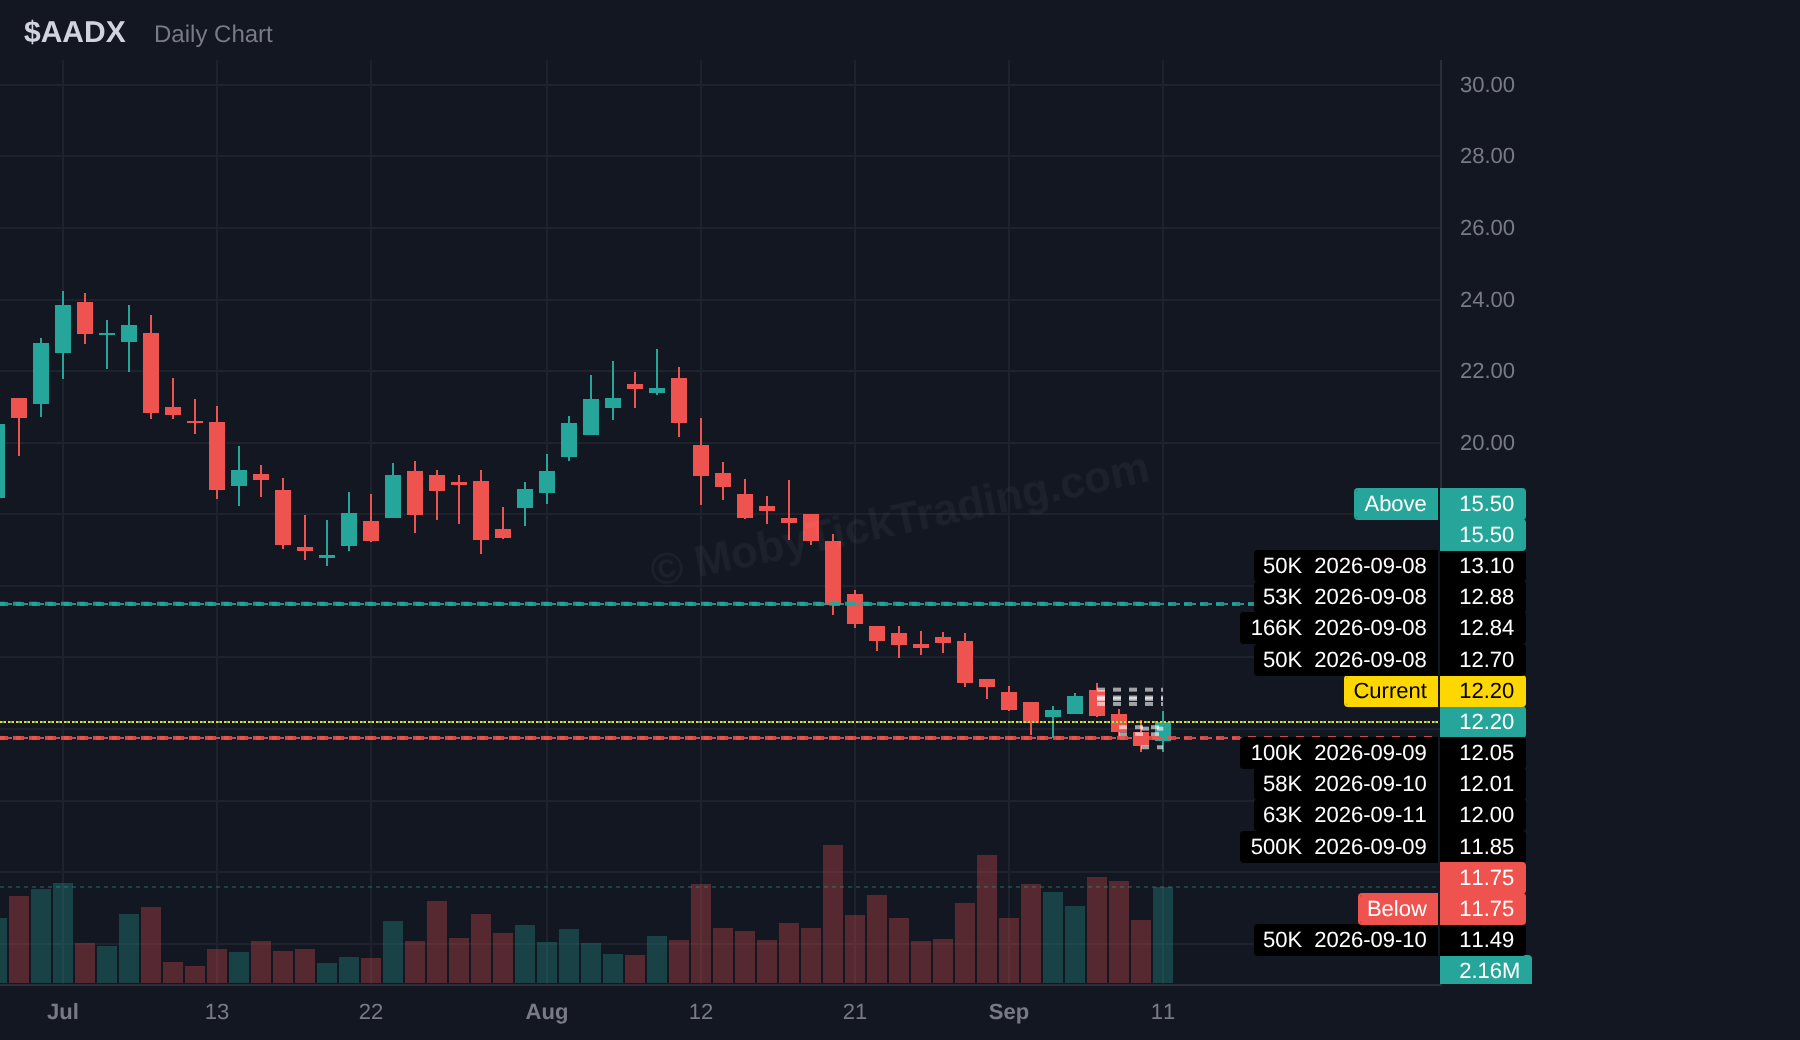
| AADX | $15.50 | $16.00 → $17.00 → $18.00 → $19.00 → $20.00 |
| INTC | $107.00 | $110.00 → $112.50 → $115.00 → $117.50 → $120.00 |
| HPE | $63.50 | $65.00 → $67.50 → $70.00 |
| NVDA | $226.00 | $230.00 → $232.50 → $235.00 → $237.50 → $240.00 |
| PLTR | $177.50 | $180.00 → $183.00 → $186.50 → $190.00 → $195.00 → $200.00 |
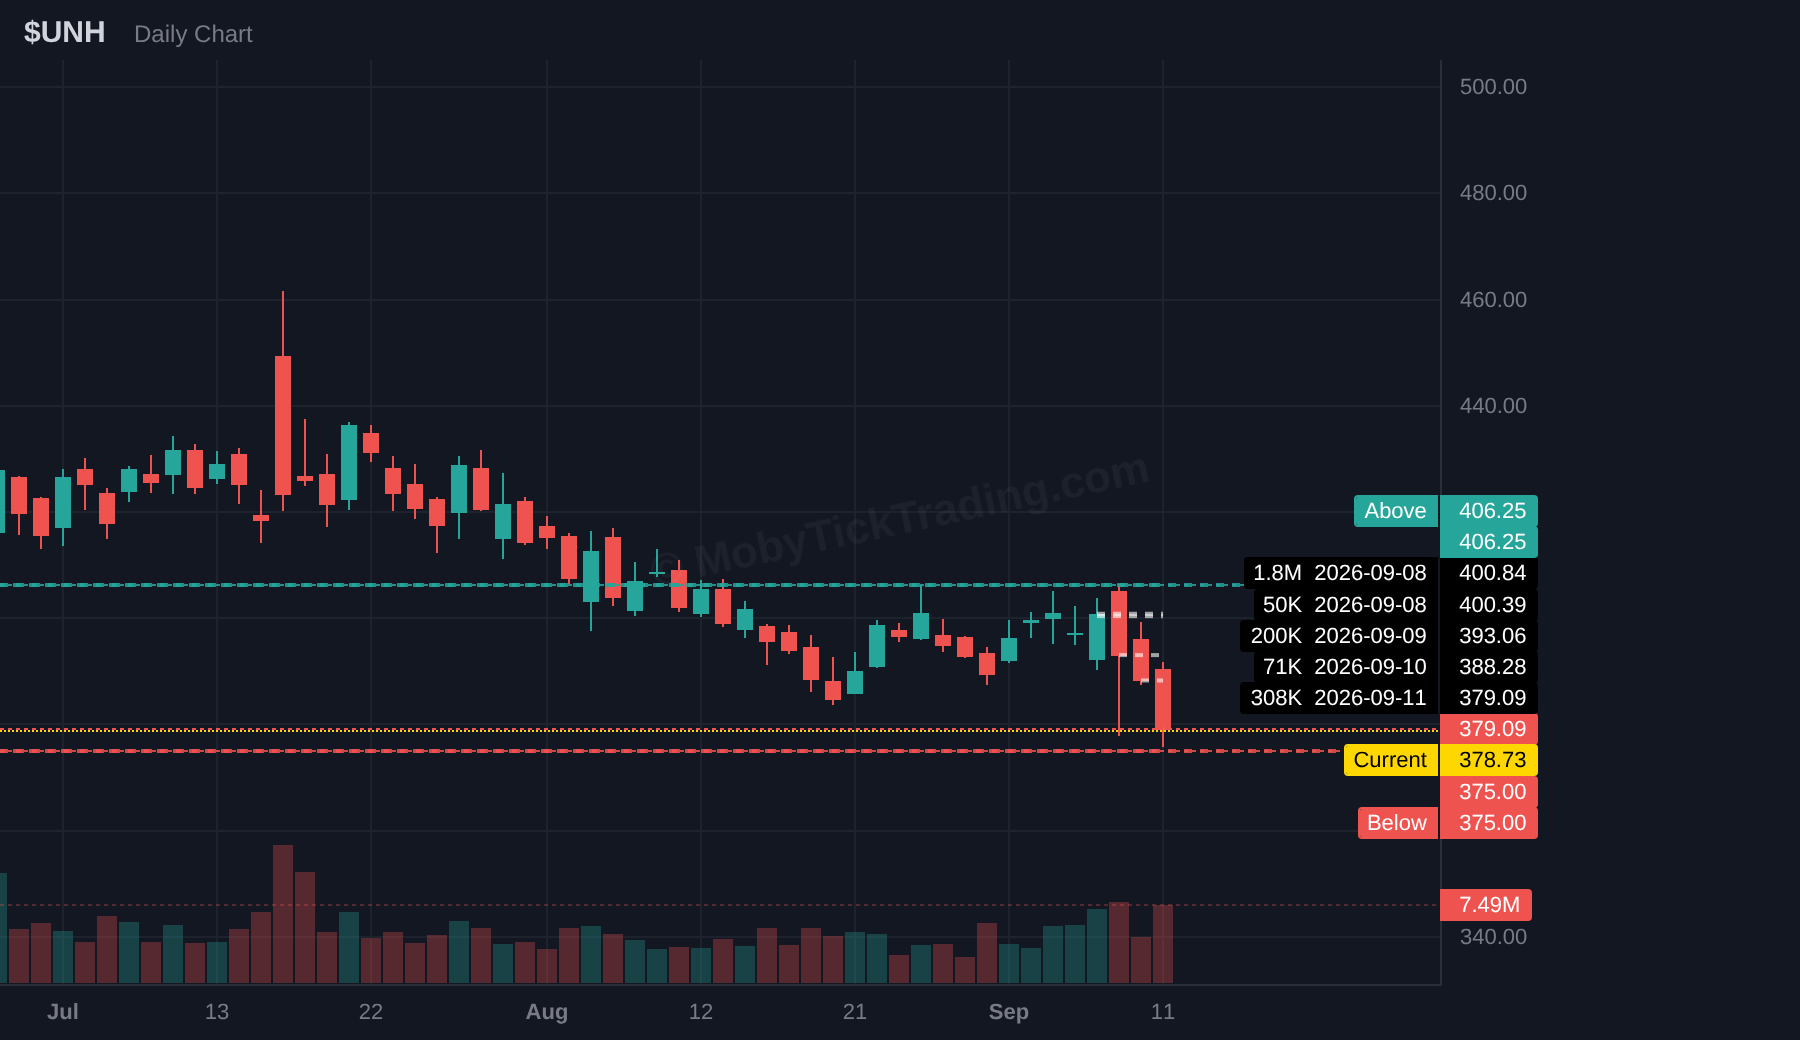
| UNH | $406.25 | $410.00 → $412.50 → $415.00 → $420.00 → $430.00 → $440.00 |
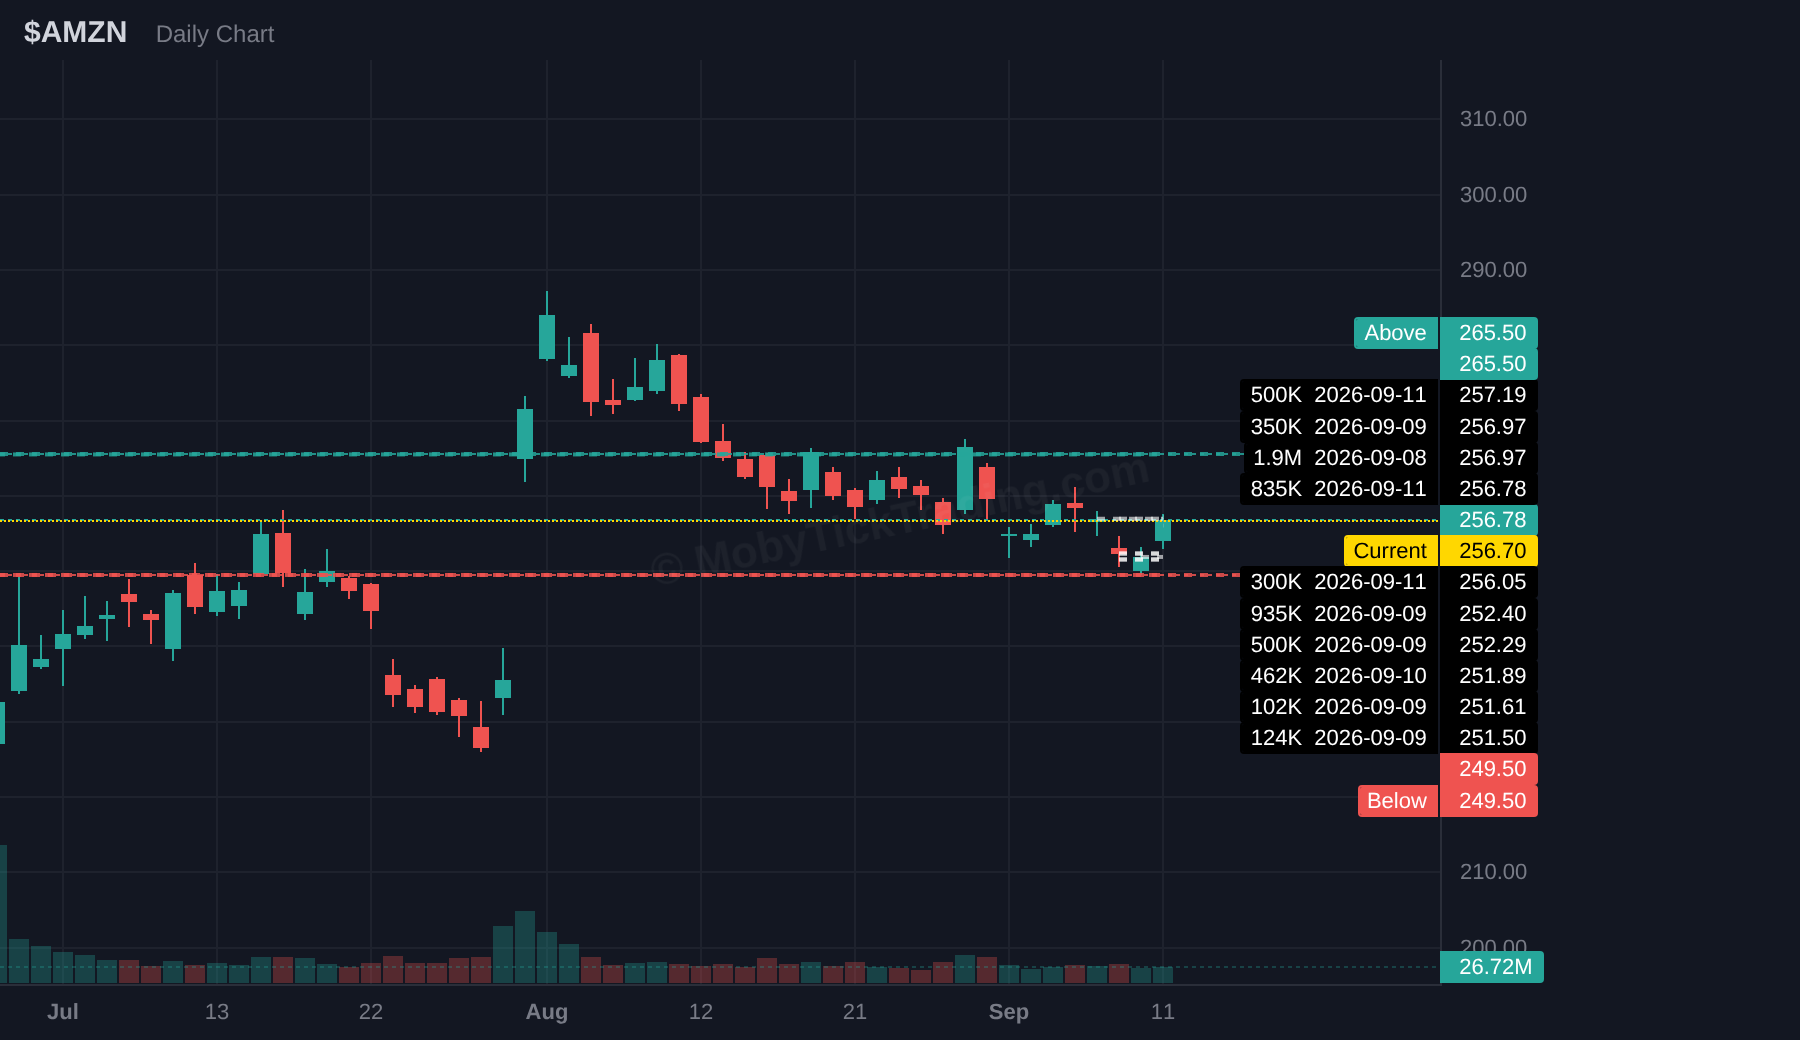
| AMZN | $265.50 | $270.00 → $275.00 → $280.00 → $282.50 → $285.00 |
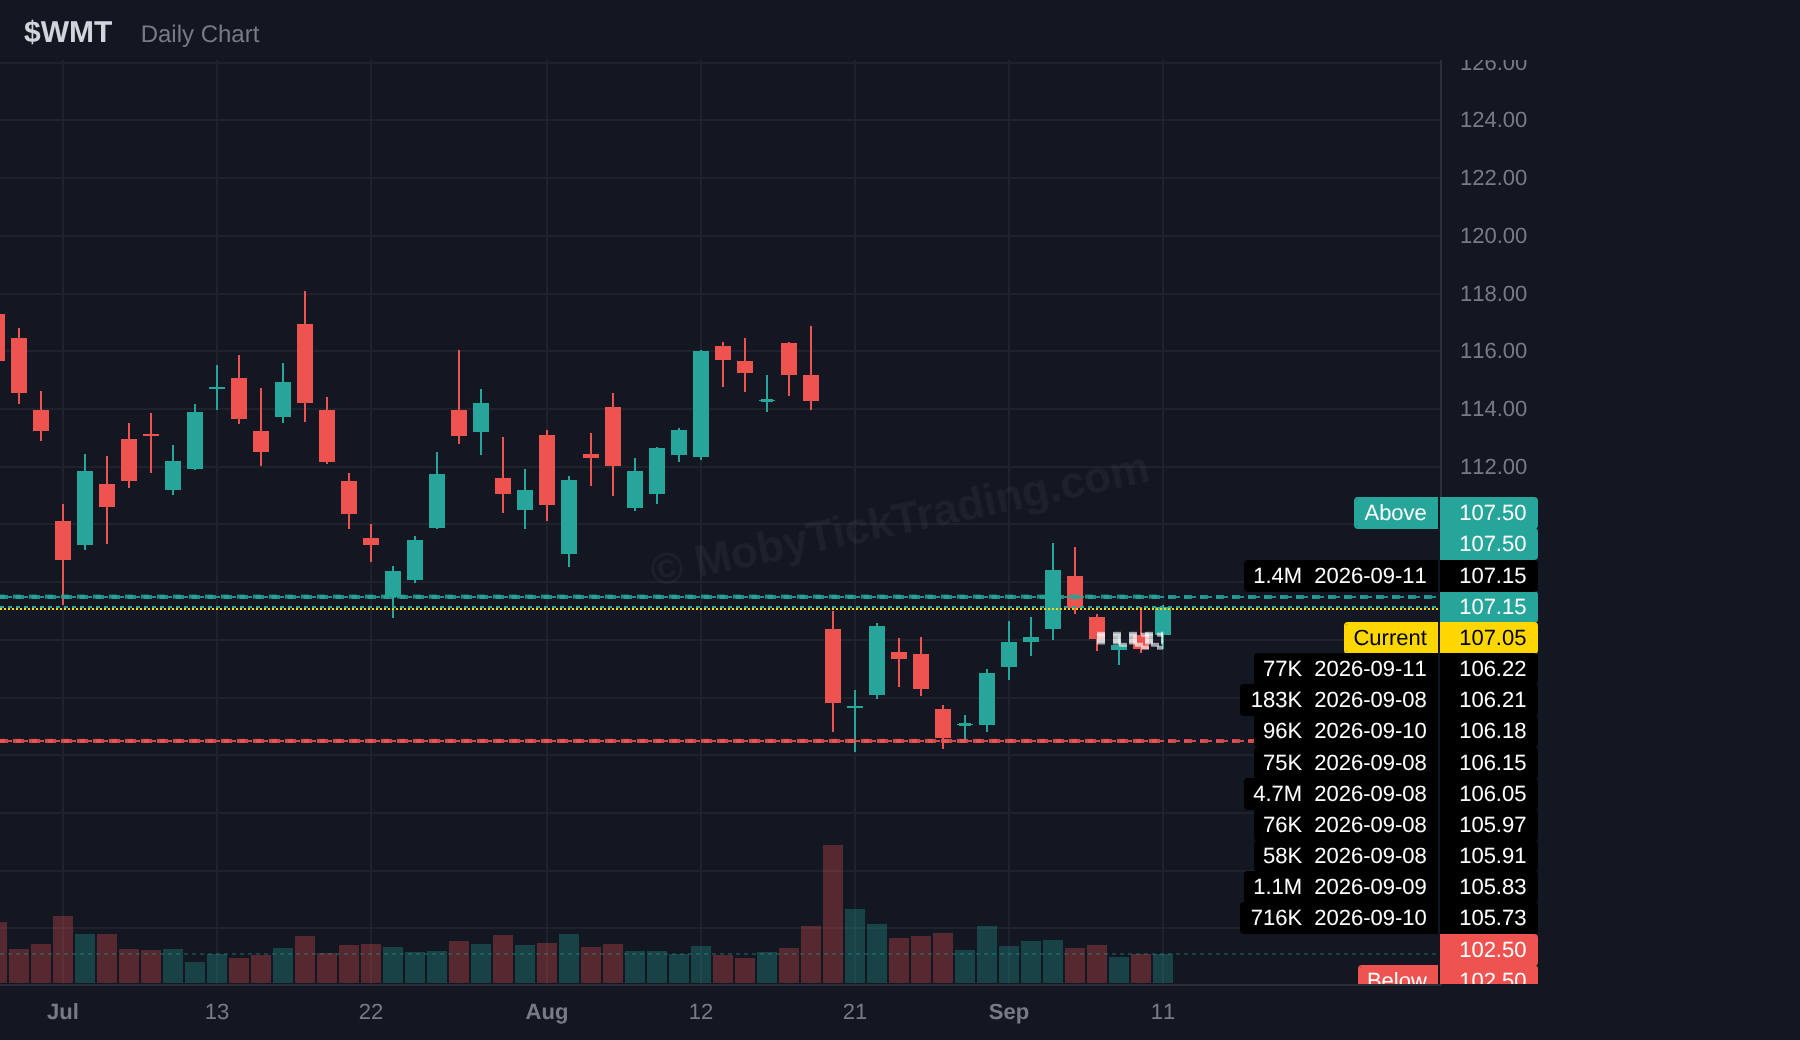
| WMT | $107.50 | $110.00 → $112.00 → $114.00 → $115.20 |
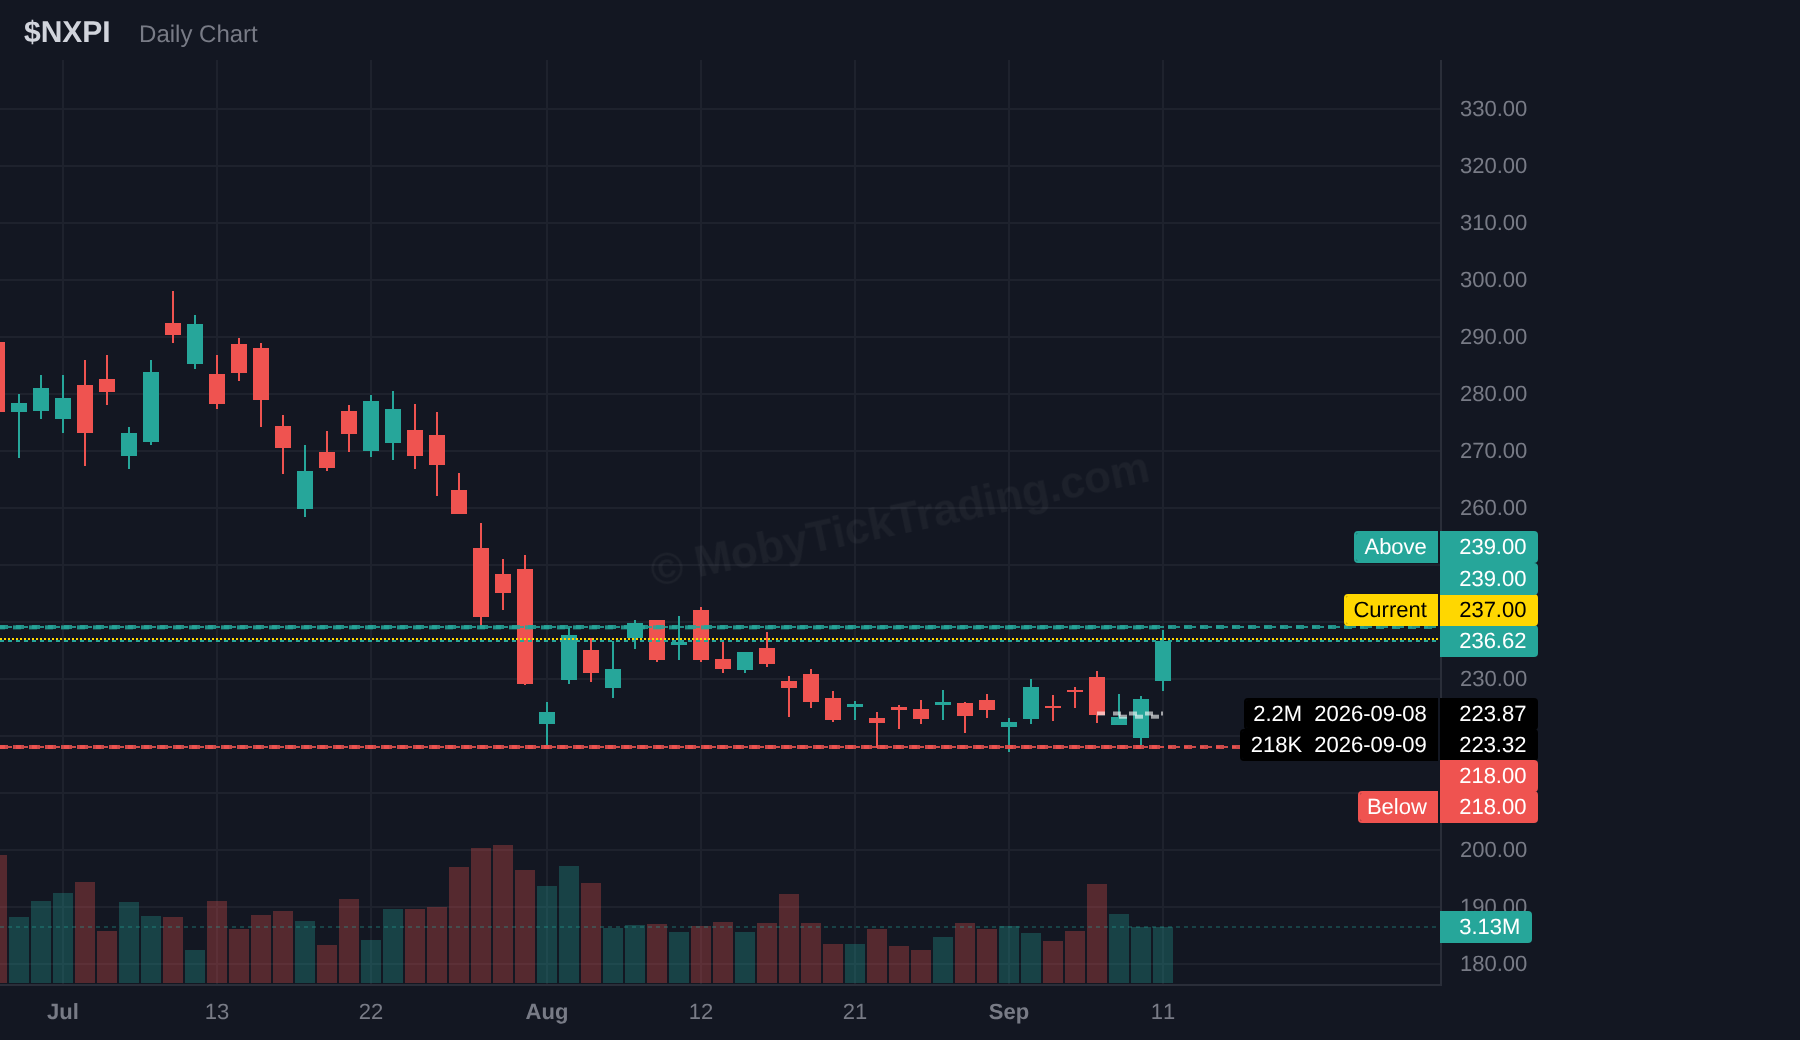
| NXPI | $239 | $245 → $247.5 → $250 → $255 → $260 |
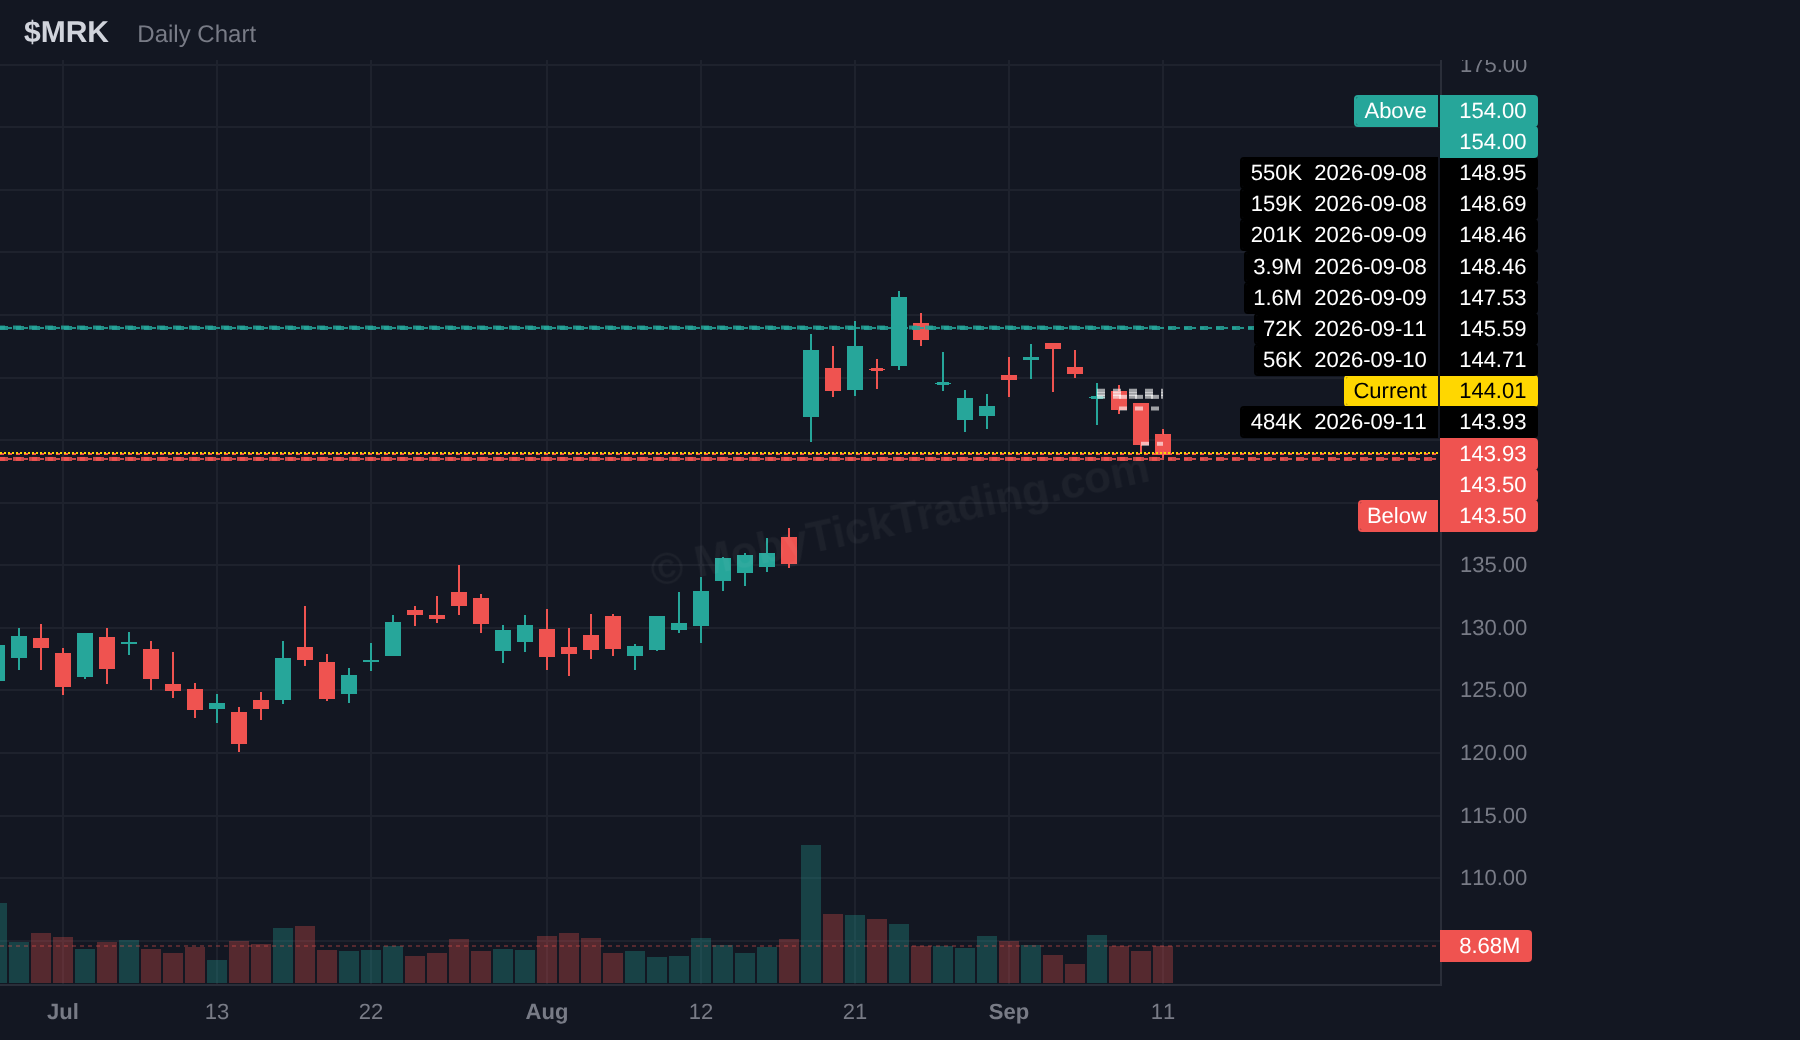
| MRK | $154 | $156.25 → $157.5 → $160 → $162.5 → $165 → $170 |
| Ticker | Below Trigger | Targets |
|---|---|---|
| SPY | $757.00 | $755.00 → $750.00 → $745.00 → $740.00 → $735.00 → $730.00 |
| QQQ | $707.50 | $700.00 → $695.00 → $690.00 → $685.00 → $680.00 |
| IWM | $287.50 | $285.00 → $282.50 → $280.00 → $277.50 → $275.00 |
| AADX | $11.75 | $11.00 → $10.00 → $9.00 → $8.00 → $7.50 → $7.00 |
| INTC | $87.50 | $85.00 → $82.50 → $80.00 → $75.00 → $72.50 → $70.00 |
| HPE | $50.00 | $48.25 → $45.00 → $42.50 → $40.00 |
| NVDA | $208.50 | $208.00 → $205.00 → $203.00 → $200.00 |
| PLTR | $164.50 | $160.00 → $157.50 → $155.00 → $152.50 → $150.00 |
| UNH | $375.00 | $370.00 → $365.00 → $360.00 → $355.00 → $350.00 |
| AMZN | $249.50 | $248.00 → $246.00 → $242.50 → $240.00 → $237.50 → $235.00 |
| WMT | $102.50 | $100.00 → $97.50 → $95.00 → $92.50 → $90.00 |
| NXPI | $218 | $215 → $212.5 → $210 → $205 → $200 |
| MRK | $143.5 | $140 → $132.5 → $130 → $128 → $124 |
Each card below shows the dark pool flow data for the past week, along with the key trigger levels and profit targets for the upcoming week. Dark pool stats are sourced from MobyTick’s proprietary analytics.
Above $775.00 → $778.25 → $780.00 → $785.00 → $790.00 → $795.00 → $800.00
Below $757.00 → $755.00 → $750.00 → $745.00 → $740.00 → $735.00 → $730.00
Above $722.50 → $725.00 → $730.00 → $735.00 → $740.00 → $745.00
Below $707.50 → $700.00 → $695.00 → $690.00 → $685.00 → $680.00
Above $291.50 → $293.25 → $295.00 → $297.50 → $300.00 → $302.50
Below $287.50 → $285.00 → $282.50 → $280.00 → $277.50 → $275.00
Above $15.50 → $16.00 → $17.00 → $18.00 → $19.00 → $20.00
Below $11.75 → $11.00 → $10.00 → $9.00 → $8.00 → $7.50 → $7.00
Above $107.00 → $110.00 → $112.50 → $115.00 → $117.50 → $120.00
Below $87.50 → $85.00 → $82.50 → $80.00 → $75.00 → $72.50 → $70.00
Above $63.50 → $65.00 → $67.50 → $70.00
Below $50.00 → $48.25 → $45.00 → $42.50 → $40.00
Above $226.00 → $230.00 → $232.50 → $235.00 → $237.50 → $240.00
Below $208.50 → $208.00 → $205.00 → $203.00 → $200.00
Above $177.50 → $180.00 → $183.00 → $186.50 → $190.00 → $195.00 → $200.00
Below $164.50 → $160.00 → $157.50 → $155.00 → $152.50 → $150.00
Above $406.25 → $410.00 → $412.50 → $415.00 → $420.00 → $430.00 → $440.00
Below $375.00 → $370.00 → $365.00 → $360.00 → $355.00 → $350.00
Above $265.50 → $270.00 → $275.00 → $280.00 → $282.50 → $285.00
Below $249.50 → $248.00 → $246.00 → $242.50 → $240.00 → $237.50 → $235.00
Above $107.50 → $110.00 → $112.00 → $114.00 → $115.20
Below $102.50 → $100.00 → $97.50 → $95.00 → $92.50 → $90.00
Above $239 → $245 → $247.5 → $250 → $255 → $260
Below $218 → $215 → $212.5 → $210 → $205 → $200
Above $154 → $156.25 → $157.5 → $160 → $162.5 → $165 → $170
Below $143.5 → $140 → $132.5 → $130 → $128 → $124
Broad market ETFs printed $49.92B in dark pool notional from September 8 to September 11. The nine sector funds that printed at all totaled $1.53B. That is a 32.6-to-1 split, and it is more than twice as lopsided as the prior week’s 13.8-to-1. Sector products were 3.0% of the $51.45B combined ETF tape. The print counts run the same direction: 71 prints across six broad vehicles, 22 across nine sector funds.
IVV carried the week at $25.09B, half of all broad ETF notional on its own (50.3%) across 27 prints and 32.77M shares. It ran 2.24x VOO’s $11.19B, 2.69x SPY’s $9.32B, 8.5x QQQ’s $2.95B, and 19.2x IWM’s $1.31B. IJR printed once for $60.94M, which is 0.12% of the broad total and 1/412th of IVV. IVV, VOO, and SPY together held $45.60B, or 91.3% of broad notional; IVV and VOO alone made up $36.28B, or 72.7%.
The scale gap is the story. IVV’s single-ticker total is 16.4x the entire nine-fund sector complex. QQQ at $2.95B is 1.93x that complex by itself, and IWM at $1.31B reaches 0.85x of it.
| Sector ETF | Notional | Prints |
|---|---|---|
| XLF | $269M | 4 |
| XBI | $245M | 3 |
| SMH | $239M | 1 |
| XLE | $221M | 4 |
| XLP | $140M | 3 |
| XLV | $130M | 1 |
| XLC | $114M | 1 |
| XLB | $96M | 4 |
| XLK | $76M | 1 |
| Total | $1,530M | 22 |
XLI, XLU and XRT produced no aggregated prints above the 400,000-share threshold this week, so they do not appear in the table.
XLF led at $269M, 1.22x XLE, but the top of this table is flat: XLF, XBI, and SMH sit within $31M of each other and combine for $753M, 49.2% of sector notional. SMH reached $239M on one print of 416,214 shares. XBI at $245M ran 3.22x XLK’s $76M, so the biotech tracker outprinted the technology sector fund by a wide margin. The bottom three, XLC, XLB, and XLK, combined for $286M, 18.7% of the sector total and still above XLF alone. Stack XLV, XLC, XLB, and XLK together and you get $415M, roughly a third of IWM’s $1.31B.
Three of this week’s 13 callouts are index products above: SPY, QQQ, and IWM, worth $13.58B combined, 27.2% of broad ETF notional. Semiconductor callouts INTC, NVDA, and NXPI map to the $239M SMH line. UNH and MRK sit against XLV’s $130M, WMT against XLP’s $140M, and PLTR and HPE against XLK’s $76M. The rest of the sheet reads AADX and AMZN.
Data sourced from MobyTick.
Friday, September 18, 2026 is a quadruple witching day — the third Friday of September, one of four dates a year (March, June, September, December) where several kinds of derivative contracts expire at the same time.
The four contract types behind the name are stock index futures, stock index options, single-stock options and single-stock futures. One honest footnote: single-stock futures no longer trade on a U.S. venue, so in practice the American version is really three of the four. The name stuck anyway. What matters is the pile-up, not the label.
Think of an options chain as a parking lot map. Open interest is not the cars driving past today — it is the cars still parked. The quarterly lot has been filling since June: positions opened months out, rolled forward, left there. By the time the front quarterly is a week away, September strikes on the big index products hold the most concentrated open interest on the board.
That concentration matters because of who is on the other side. When a dealer or market maker fills an options order, they usually do not want a directional position. They neutralize it with shares or futures. That hedge is a real order in the real market, not an accounting entry. One contract is noise. Because every contract covers 100 shares, a heavily held strike represents millions of shares of exposure somebody has to keep hedged.
Two things happen as expiry approaches. Hedging sensitivity rises sharply for strikes near the current price — that is gamma, strongest close to the money and close to expiration. And the hedging is no longer spread across dozens of future dates, because a large share of it expires on one specific Friday. Heavier open interest plus higher sensitivity means dealers re-hedge more often and in bigger size around the biggest strikes. Those strikes stop reading like numbers on a chain and start behaving like levels.
Pinning is the effect people notice on expiration Friday: price seems to stick near a large strike instead of wandering.
Nobody is steering it. When heavy positioning sits at one strike near expiry, hedging pulls against movement from both sides. Drift above the strike and hedges adjust one way; drift below and they adjust the other way. The net effect is a mechanical tug back toward the strike. Arithmetic, not intent.
Two cautions. Pinning is an observed market-mechanics effect, not a forecast — plenty of expirations show nothing of the kind. And it is local. It needs genuinely heavy, concentrated open interest at a strike near the current price, with nothing bigger arriving. Real news walks straight through it. Hedging pressure is a current, not a dam.
Max pain is the strike where the largest dollar value of open contracts would expire worthless. That is the whole definition. It is a summary statistic.
Nothing in that arithmetic claims price will travel there. Our Episode 6, “Max Pain Myth vs. Pinning,” covers why the popular “market makers push it there” story does not survive contact with how those firms actually operate. Treat max pain as descriptive, not predictive. It is also lossy: it collapses a whole chain into one number that can sit well away from the strike actually carrying the concentration. The distribution tells you more than the summary does.
| Concept | What it is | What it is not |
|---|---|---|
| Open interest | Contracts still open at a strike | A read on who is long or short |
| Pinning | Hedging pull toward a heavy nearby strike | A prediction of Friday’s close |
| Max pain | Strike where most contract value expires worthless | A price target |
Two features cover the parts that move fastest in a week like this. 0DTE Volume Walls tracks same-day-expiry concentration — the piece yesterday’s open interest cannot show you, because those walls build and shift within the session. GEX & Options Levels maps dealer-positioning levels, so you can see where hedging sensitivity clusters instead of guessing from a contract count.
Read them alongside the block print levels in this issue. Prints show where size transacted. Options levels show where hedging is concentrated. Neither predicts direction, and when both point at the same price, that is worth noting.
> Key Takeaway: Quad witching on Sept 18, 2026 lands the year’s most concentrated index open interest on one date, so dealer hedging is heavier and big strikes behave more like levels in the days before. Pinning and max pain describe that mechanic — they do not forecast it.
Get institutional-grade dark pool intelligence delivered to your inbox every week.
Disclaimer: This newsletter is for informational and educational purposes only. It does not constitute financial advice, investment recommendations, or solicitation to buy or sell securities. Trading stocks, ETFs, and options involves substantial risk of loss. Past performance is not indicative of future results.