MAJOR ANNOUNCEMENT: Moby Tick Now Generates Custom TradingView Dark Pool Indicators!
We’re excited to announce our new TradingView Script Generator – transform your charts with personalized institutional dark pool data
For the first time ever, Moby Tick subscribers can automatically generate custom Pine Script indicators with their own selected tickers, timeframes, and block trade thresholds. No more manual data entry, no more generic indicators – just pure institutional intelligence tailored to YOUR trading focus.
What Makes This Revolutionary?
The Game-Changer: Our new TradingView Script Generator bridges the gap between institutional-grade dark pool data and retail trading platforms. Previously, this level of customization required expensive Bloomberg terminals or institutional data feeds.
What This Means for Your Trading:
Personalized Intelligence: Choose YOUR specific tickers to track
Custom Parameters: Set block trade sizes that matter for your strategy
Fresh Data: Generate updated scripts with the latest institutional activity
Zero Technical Skills Required: Copy, paste, and start following smart money
This isn’t just another indicator – it’s your personal institutional intelligence system.
The Moby Indicator in Action
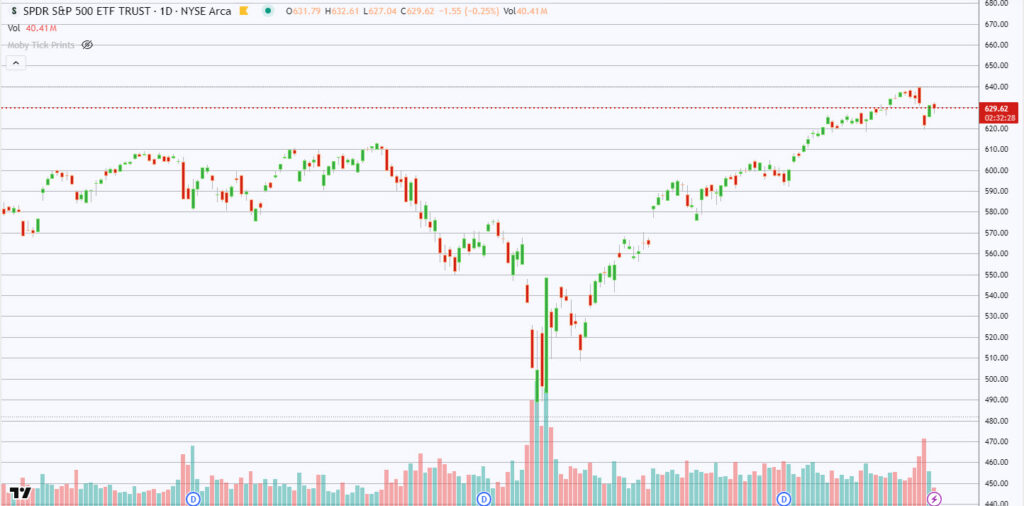
Chart Comparison: SPY
This is a blank SPY daily chart as of August 5, 2025
SPY 1 Day chart
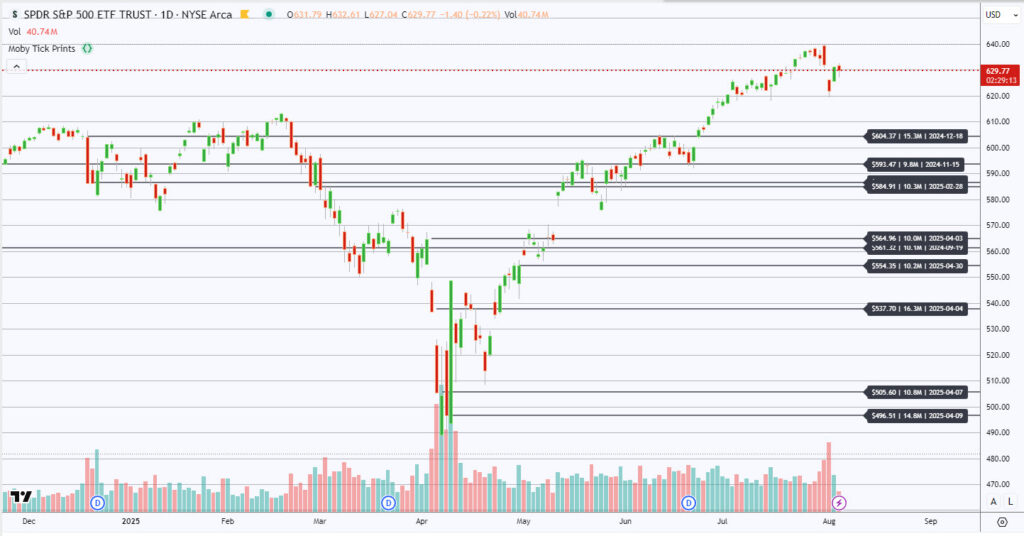
Below is the SPY Daily Chart with the largest trades in the last year overlayed
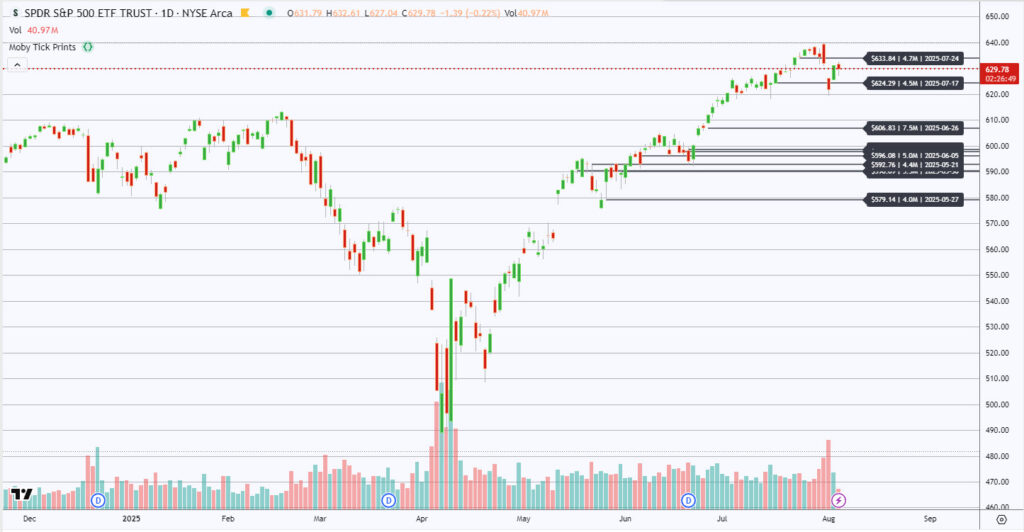
SPY 1 Day chart with the largest block trades over the last yearSPY daily chart with the largest trades in the last 90 days
Quick Start: Try the Demo Version First
New to dark pool analysis? Start with our pre-built demo indicator to see how institutional data appears on your charts:
This demo version includes sample data across popular tickers so you can:
See how dark pool trades appear on charts
Understand the visual presentation
Test the concept before customizing with your own tickers
Learn to interpret institutional flow patterns
Ready for custom data with your specific ticker selections? Continue with the full setup guide below.
What You’ll Learn
By the end of this guide, you’ll know exactly how to:
Set up custom MobyTick dark pool indicators on TradingView
Generate personalized Pine Script code with your selected tickers
Update your indicator with fresh institutional data
Interpret dark pool signals for better trading decisions
Prerequisites: Active Moby Tick subscription (Remora plan or higher) with Print Lookup feature access.
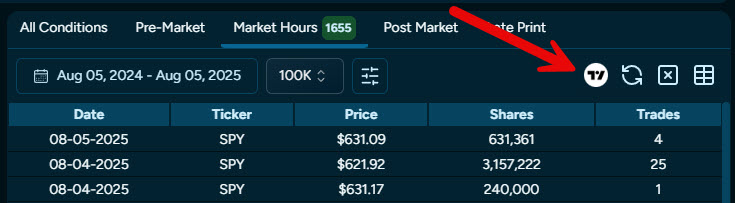
Step 1: Access the Print Lookup Feature
After logging into your MobyTick dashboard, navigate to the Print Lookup section. This powerful feature is your gateway to generating custom TradingView indicators with the exact tickers and parameters you want to track.
Why Print Lookup?
The Print Lookup feature allows you to:
Select up to 50 specific tickers for dark pool tracking
Customize block trade size thresholds
Choose your preferred timeframe (1 year, 6 months, or custom date ranges going back to Jan 1, 2020)
Generate fresh Pine Script code with real institutional data
Step 2: Configure Your Indicator Settings
Click on the TradingView icon to open the Script Configuration
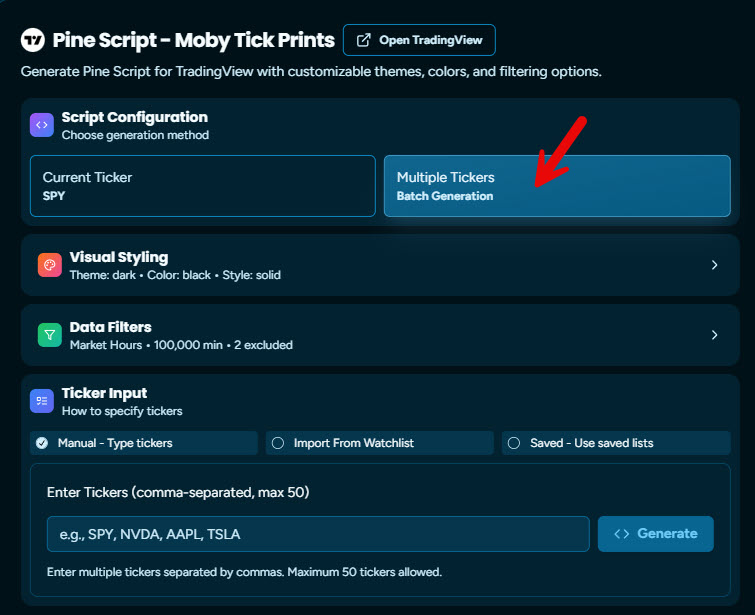
Click the Multiple Tickers Option or Single Ticker, if you want just one:
Select Multiple Tickers Option
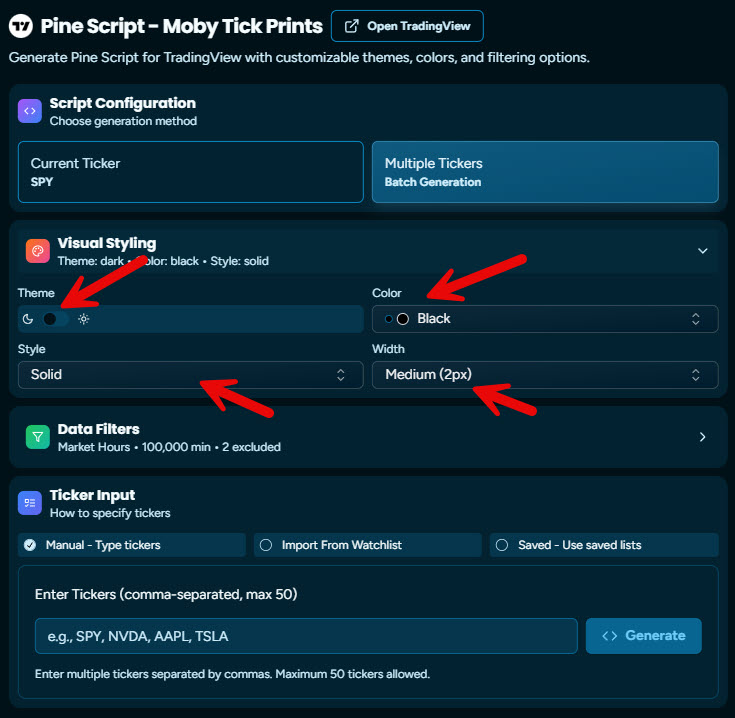
Select your Theme options for how the prints will be displayed on your chart along with light or dark mode, color of the lines, style and line width
Theme configuration for prints displaying on chart
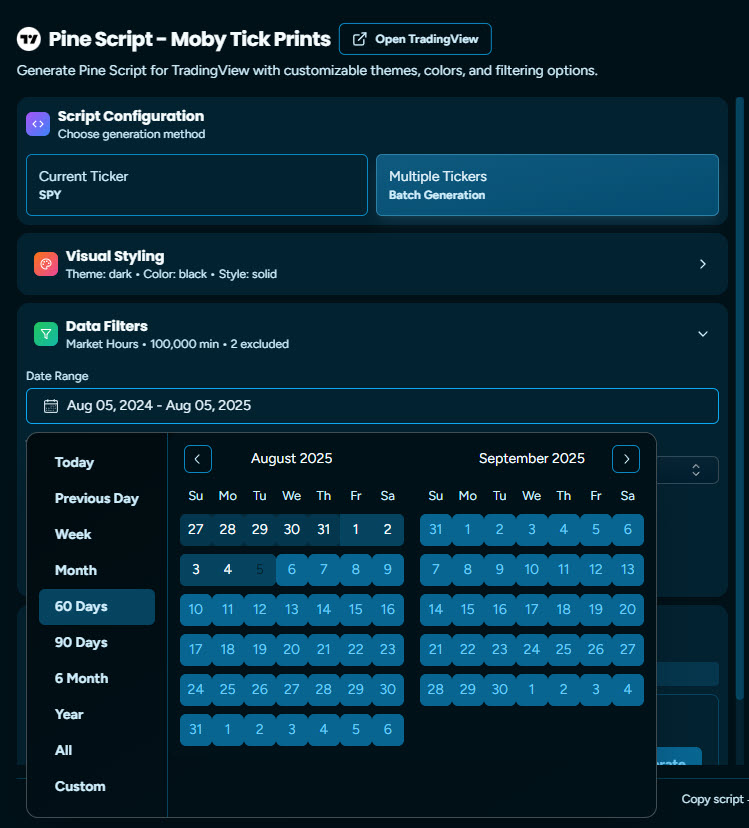
Choose the timeframe range for the trade dates to be used for your script
Select the date ranges for prints to be added to your chart
Selecting Your Tickers
Choose the stocks or ETFs you want to monitor for institutional activity. Consider focusing on:
Your current positions – See if institutions are accumulating or distributing
Watchlist stocks – Identify potential setups before they become obvious
Sector plays – Track institutional rotation between sectors
High-volume names – Where institutional activity is most frequent
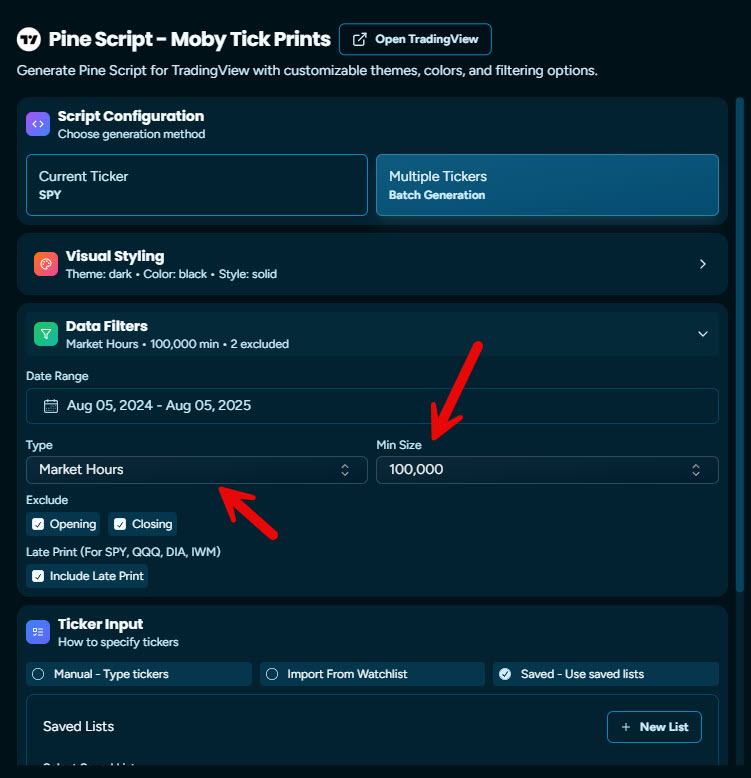
Select the minimum share sizes and the trading hours.
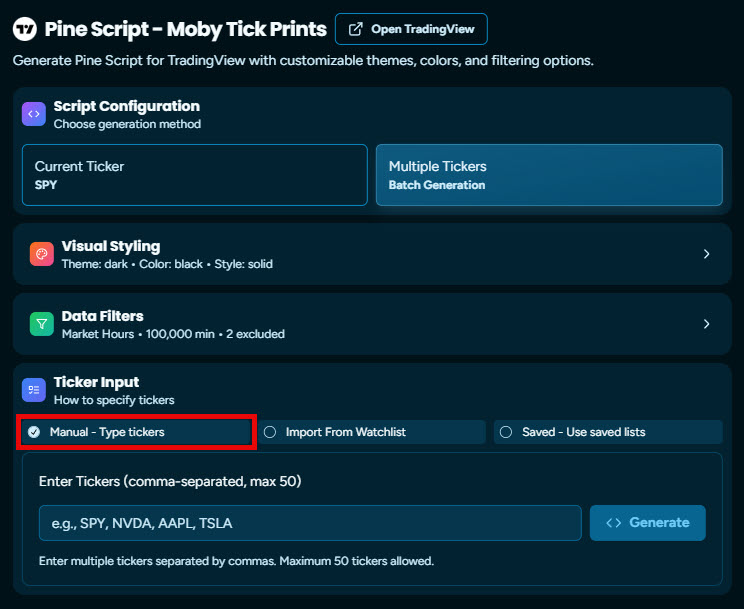
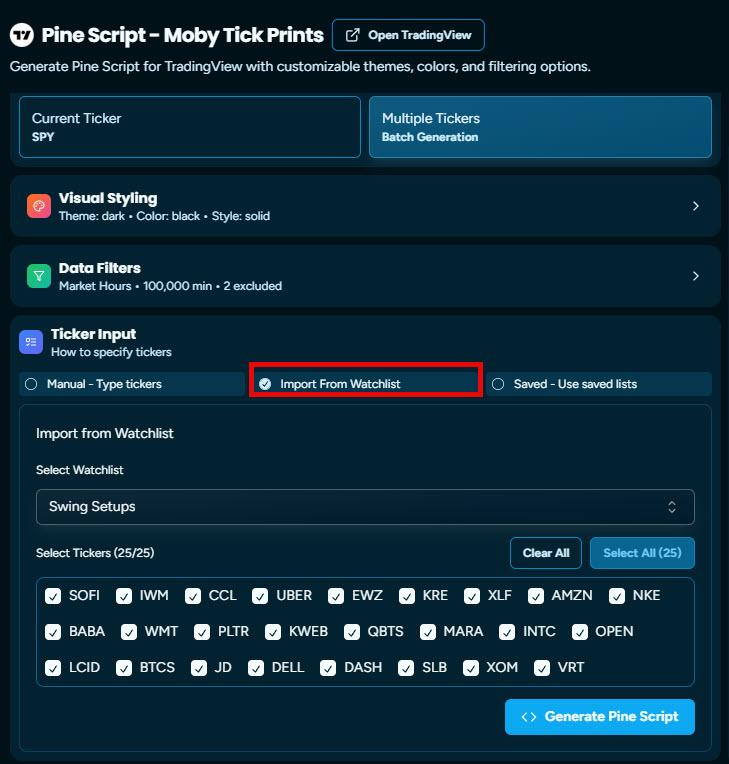
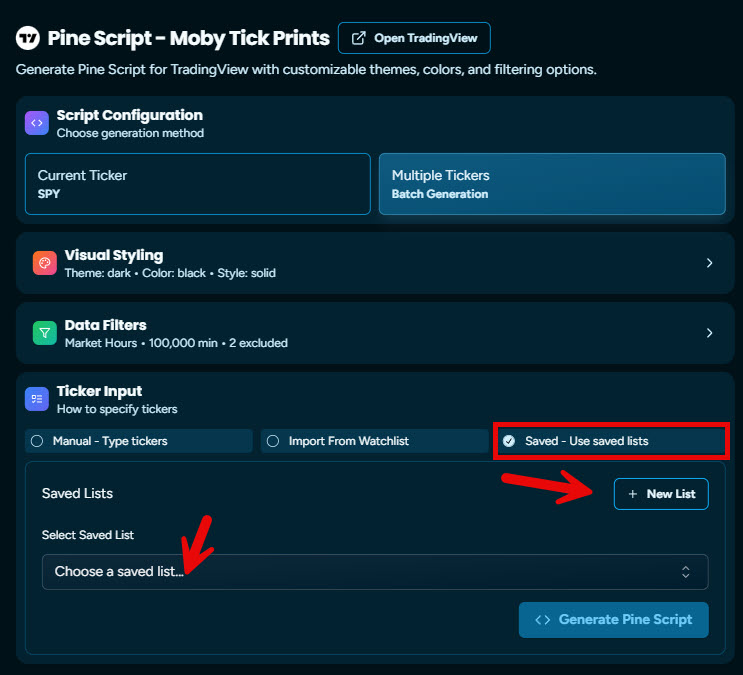
Manually enter tickers, import them from watchlists or create and save custom lists to re-use later
Click Import from Watchlist to select all tickers from a watchlistCreate custom, re-usable ticker lists to be saved
Setting Block Trade Thresholds
Customize the minimum trade size that appears on your indicator:
Choose from minimum block sizes of 50,000 shares of cumulative prints at those levels
Choosing Your Timeframe
1 Year: Full historical context for long-term positioning
6 Months: Recent institutional activity and trend changes
Custom Range: Focus on specific periods around earnings, catalysts, or market events
All: Get the top 10 largest trades in the last 5 years
Step 3: Generate Your Pine Script Code
Once you’ve configured your settings in Print Lookup:
Click “Generate Script” – The system processes your selections and creates custom Pine Script code
Copy the entire code – Use Ctrl+C (Windows) or Cmd+C (Mac) to copy the generated script
Save your settings – Note your configuration for future updates
What the Generated Code Contains
Your custom script includes:
All selected tickers with their historical dark pool data
Formatted data points showing trade size, timestamp, and price levels
Visual markers optimized for TradingView’s charting engine
Automatic scaling for different chart timeframes
Step 4: Install the Indicator on TradingView
Opening Pine Script Editor
Log into your TradingView account
Open any chart
Click the “Pine Editor” tab at the bottom of the screen
If you don’t see Pine Editor, go to Chart Settings > Tools > Pine Editor
Adding Your Code
Clear the existing code in the Pine Editor (select all and delete)
Paste your MobyTick code – Use Ctrl+V (Windows) or Cmd+V (Mac)
Click “Add to Chart” – The button appears at the top of the Pine Editor
Name your indicator – Use a descriptive name like “MobyTick Dark Pool Data – [Date]”
Verification
If successful, you’ll see:
Your indicator appears in the indicator list on your chart
Dark pool trade markers overlay on your price chart
A confirmation message that the script compiled without errors
Reading the Dark Pool Signals
Understanding the Visual Markers
Your indicator displays institutional dark pool activity as visual elements on your chart:
Large Block Trades: Significant institutional positioning
Look for clusters of activity at key technical levels
Multiple large trades often signal conviction-level institutional interest
Pay attention to trades near support/resistance zones
Accumulation vs. Distribution Patterns:
Accumulation: Large trades near support levels, buying pressure
Distribution: Large trades near resistance levels, selling pressure
Continuation: Trades in direction of prevailing trend
Key Levels to Watch
Support bounces with institutional buying – High-probability long setups
Resistance tests with institutional selling – Potential distribution zones
Breakout levels with institutional flow – Momentum confirmation signals
Fresh institutional interest in your tracked tickers
Update Schedule Recommendations
Active day traders: Update daily or any time throughout the day
Swing traders: Daily or twice per week updates are typically sufficient
Position traders: Bi-weekly updates work well
How to Update
Return to Print Lookup in your MobyTick dashboard
Keep the same settings or adjust tickers/parameters as needed
Generate new script code
Replace the old code in your Pine Editor
Click “Add to Chart” to refresh your indicator
Advanced Usage Tips
Combining with Technical Analysis
The most powerful setups occur when institutional dark pool activity aligns with:
Key moving averages (50-day, 100-day, 200-day)
Support and resistance levels
Chart patterns (triangles, flags, breakouts)
Volume profile nodes and high-volume areas
Multi-Timeframe Analysis
Consider running separate indicators for different timeframes:
Daily charts: Medium to long-term institutional positioning
4-hour charts: Short-term institutional activity and timing
1-hour charts: Intraday institutional flow for day trading
Risk Management Integration
Use institutional flow data to improve your risk management:
Position sizing: Increase size when institutional flow aligns with your bias
Stop placement: Use institutional accumulation zones as support levels
Profit targets: Take profits when reaching institutional distribution zones
Troubleshooting Common Issues
Script Won’t Compile
Check for copy/paste errors: Ensure you copied the complete code
Verify TradingView plan: Some features require paid TradingView subscriptions
Clear browser cache: Sometimes refreshing resolves compilation issues
No Data Showing on Charts
Confirm ticker symbols: Ensure your selected stocks match TradingView’s symbols
Check timeframe: Some data may not appear on very short timeframes
Verify date ranges: Make sure your chart timeframe includes your data range
Performance Issues
Reduce ticker count: Start with 10-20 tickers if experiencing slow loading
Shorten time ranges: Use shorter historical periods for better performance
Close unused indicators: Too many indicators can slow chart performance
Maximizing Your Trading Edge
Building Your Watchlist Strategy
Start with 10-15 core positions you’re already familiar with
Add 5-10 potential new positions based on institutional activity
Include 2-3 sector ETFs to track broader institutional rotation
Monitor 3-5 high-beta names for momentum opportunities
Creating Alert Systems
While the indicator provides visual data, consider setting up alerts for:
New large block trades in your core positions
Unusual institutional activity in watchlist stocks
Institutional flow reversals in trending stocks
Developing Your Edge
The goal isn’t just to see institutional activity – it’s to develop the skill to:
Anticipate where institutions might accumulate next
Recognize when institutional interest is building
Position yourself ahead of obvious retail interest
Exit when institutional distribution becomes apparent
Next Steps
Now that you have your MobyTick dark pool indicator running on TradingView, focus on:
Paper trading setups that combine institutional flow with technical analysis
Documenting which institutional patterns work best for your trading style
Refining your ticker selection based on which stocks show the most actionable signals
Developing your own systematic approach to following institutional flow
Remember: Institutional dark pool data is a powerful tool, but it’s most effective when combined with solid technical analysis, proper risk management, and disciplined execution.
The smart money leaves footprints – now you know how to follow them.
Ready to Transform Your Trading with Institutional Intelligence?
Stop guessing where the market is headed. Start following where smart money is positioning.
While other traders rely on outdated indicators and social media sentiment, you can now access the same institutional flow data that drives major price movements. Our TradingView Script Generator puts institutional-grade intelligence directly on your charts.
What You Get with MobyTick:
✅ Custom TradingView Indicators – Generate personalized scripts with your exact ticker selections ✅ Print Lookup Database – Search 10,000+ stocks and ETFs for institutional activity over the last 5+ years ✅ Real-Time Dark Pool Tracking – See where smart money positions before retail catches on ✅ Real TimeBlock Trade Indicator – Identify conviction-level institutional trades across all timeframes ✅ Daily Data Updates – Fresh institutional intelligence every trading day
✅ One Click Trade Setup Opportunities – Fresh institutional intelligence every trading day
The Difference Is Clear:
Traditional Trading: React to price movements after they happen MobyTick Trading: Position alongside institutions before major moves occur
Don’t let another institutional accumulation opportunity pass you by.
The traders making consistent profits aren’t the ones with the fastest computers or the most complex algorithms. They’re the ones who understand where institutional money is flowing and position accordingly.