Day Trade Setup Routine: Your Pre-Market Dark Pool Checklist
What smart money does before 9:30 AM determines your trading profits for the entire day.
While most traders scramble to find opportunities after the market opens, successful dark pool traders know the real edge comes from preparation. This pre-market checklist will help you identify the best institutional trading opportunities before the first bell rings.
Why Pre-Market Preparation Wins
Institutional traders don’t improvise. They have their targets mapped out before market open, and so should you. By following their pre-market activity and preparing your trading plan, you’re positioning yourself to profit from their moves rather than react to them.
Understanding Pivot Points: Your Price Roadmap
Person’s Pivots: A simple calculation using yesterday’s high, low, and close to determine support and resistance levels (R1, R2, R3 and S1, S2, S3). If price is above the pivot point, bias is bullish. Below the pivot, bias is bearish.
Camarilla Pivots: More sensitive pivot calculations that provide tighter support and resistance levels, especially useful for day trading and scalping strategies.
Floor traders used these because they needed quick, reliable reference points to decide direction. The same logic applies to following institutional money today.
Dark Pool Prints: These represent where large institutional orders were executed away from public exchanges. These price levels often act as strong support and resistance because institutions tend to defend their positions. Recent prints show current institutional interest, while larger prints on the daily chart reveal major institutional accumulation or distribution zones.
Your Pre-Market Checklist
Step 1: Market Environment Check (5 minutes)
Check for major news: FOMC announcements, Non-Farm Payrolls, earnings releases
Identify overall market sentiment: Are futures up or down significantly?
Note any overnight developments that could affect sector rotation
Step 2: Stock Screening Criteria (10 minutes)
Look for stocks that meet ALL these requirements:
Pre-market volume over 100,000 shares (shows institutional commitment)
Stock is up on the day (momentum in your favor)
Outside day pattern (current day’s range exceeds yesterday’s high/low)
ATR of at least $1 (14-period daily ATR for sufficient volatility)
Room to move: At least $0.50-$1.00 to next major resistance level
Entry point within 1 ATR of current price (avoid chasing)
Step 3: Setup Identification (10 minutes)
For each qualifying stock:
Map Person’s Pivots: Mark R1, R2, R3 and S1, S2, S3 levels
Check Dark Pool Prints: Recent prints and larger daily prints (key S/R levels)
Mark whole dollar levels: $0.50, $1.00, $2.50, $5.00, $10.00, etc.
Identify 4EMA and 8EMA levels on daily chart for trend direction
Check gap status: Did the stock gap up or down? Where’s the gap fill level?
Note: Moby Tick provides all this critical information with one click, showing you exactly where institutional money has been active.
Step 4: Plan Both Scenarios (5 minutes)
Always prepare for both directions:
Bullish Above Setup:
Entry trigger above specific resistance level
Target levels (R1, R2, next dollar level)
Stop loss placement
Bearish Below Setup:
Entry trigger below specific support level
Target levels (S1, S2, next dollar level)
Stop loss placement
Step 5: Risk Management Calculation (5 minutes)
Calculate position size: (Risk Amount ÷ Stop Loss Distance) = Share Size
Example: Want to risk $100, stop loss is $0.25 = 400 shares
Verify 1:3 risk/reward minimum
If risking $0.25, target should be at least $0.75-$1.00
Plan profit-taking levels:
1/4 position at first $0.20 move (or more for higher priced stocks)
1/4 to 1/2 position at next major level or pivot
Keep remainder for extended move if momentum continues
Entry and Exit Rules
Entry Timing:
Wait 15 minutes after market open for volatility to settle
Look for institutional block trades to confirm direction
Enter only when setup triggers with volume confirmation
Exit Strategies:
Scale out profits at predetermined levels
Hard stop if price closes below 4EMA or 8EMA on 5-minute chart
Take profits at Person’s pivots: R3 is usually overbought territory
Avoid 11 AM – 2 PM period (historically low-volume, high-stopout zone)
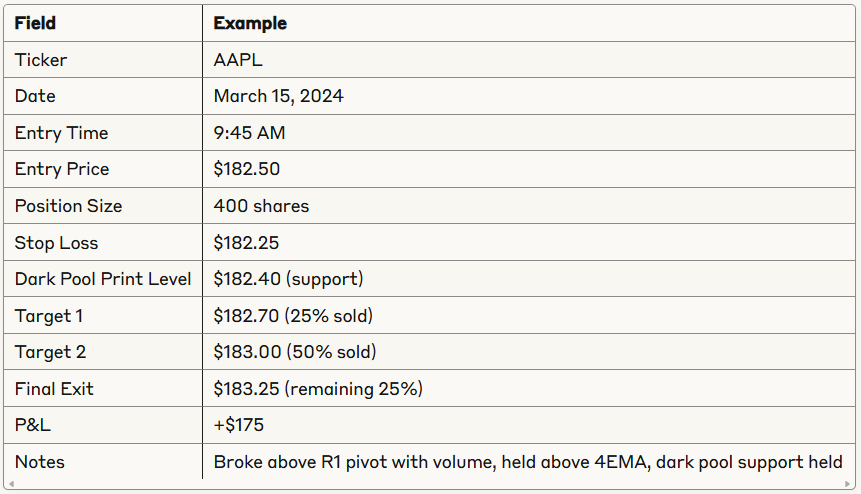
Trade Journaling Template
Record every trade with these details:
Weekly Review Questions:
What time of day do I get stopped out most often?
Which setups have the highest win rate?
Am I following my scaling rules consistently?
Are my position sizes appropriate for my risk tolerance?
Example: Real Morning Setup
Stock: XYZ Corp Pre-market: +2.5% on earnings beat, volume 150K shares ATR: $1.20 Yesterday’s close: $48.75 Current price: $50.10
Setup Analysis:
Outside day confirmed (already above yesterday’s high)
Person’s Pivot: $49.25 (bullish above)
R1: $50.50, R2: $51.25
Dark Pool Prints: Large print at $49.80 (support), recent prints at $50.25 (resistance)
Next whole dollar: $50.50, then $51.00
4EMA daily: $48.90 (supporting trend)
Trading Plan:
Bullish above $50.25 (break above dark pool resistance with volume)
Target 1: $50.50 (take 25%)
Target 2: $51.00 (take 50%)
Stop: $49.90 (just below dark pool support at $49.80, risk $0.35)
Position: Risk $140 ÷ $0.35 = 400 shares
Your Next Steps
Print this checklist and use it tomorrow morning
Set up Moby Tick alerts for volume and price breaks on your target stocks
Practice with small position sizes until the routine becomes automatic
Review your journal weekly to identify patterns and improve
The difference between profitable traders and everyone else isn’t talent—it’s preparation. Start tomorrow morning with this checklist, and you’ll be trading with the same systematic approach that institutions use.
Ready to follow smart money with precision? Start your 7-day free trial at MobyTickTrading.com and get access to real-time block trade data, pivot point indicators, and institutional flow analysis.