Physical Address
304 North Cardinal St.
Dorchester Center, MA 02124
Physical Address
304 North Cardinal St.
Dorchester Center, MA 02124
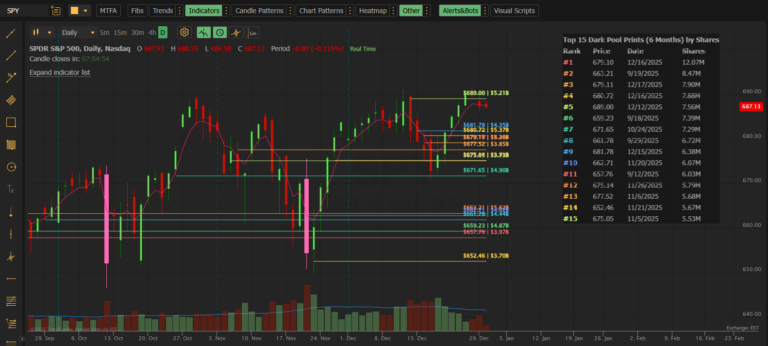
Dark pools are private exchanges where institutions execute large block trades without revealing their orders to the public market. These trades still get reported to the tape, but most retail traders never see them. Dark Pool Levels brings this institutional activity directly to your TrendSpider chart.
Our data comes from the exchanges. When a dark pool trade executes, it’s reported to the tape and captured in our system. We aggregate trades by price level so you can see the total institutional activity at each price.
Dark Pool Levels (Standard) updates within 5 minutes of trades being reported. For faster updates (within 60 seconds), see Dark Pool Levels PRO.
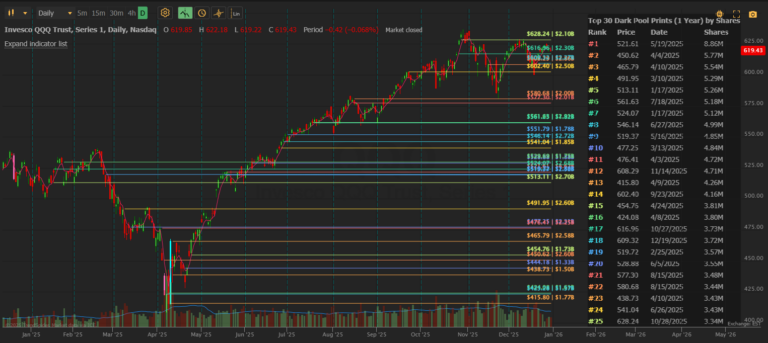
Over 10,000 US stocks and ETFs are covered, including all major indices (SPY, QQQ, IWM), large-caps, mid-caps, and most actively traded small-caps.
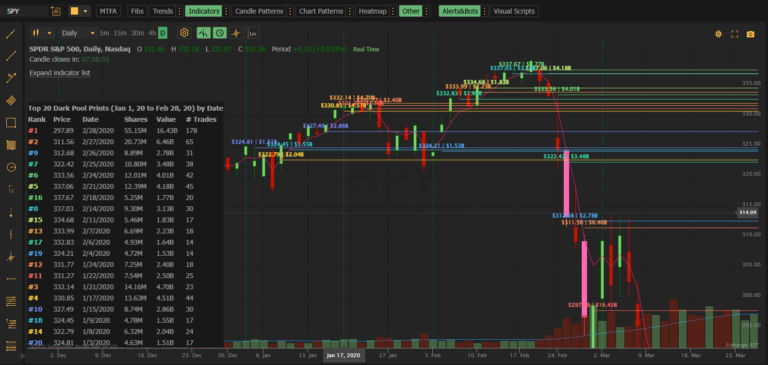
The Standard indicator allows lookback up to 1 year. Dark Pool Levels PRO extends this to January 2020, allowing historical analysis of major market events.
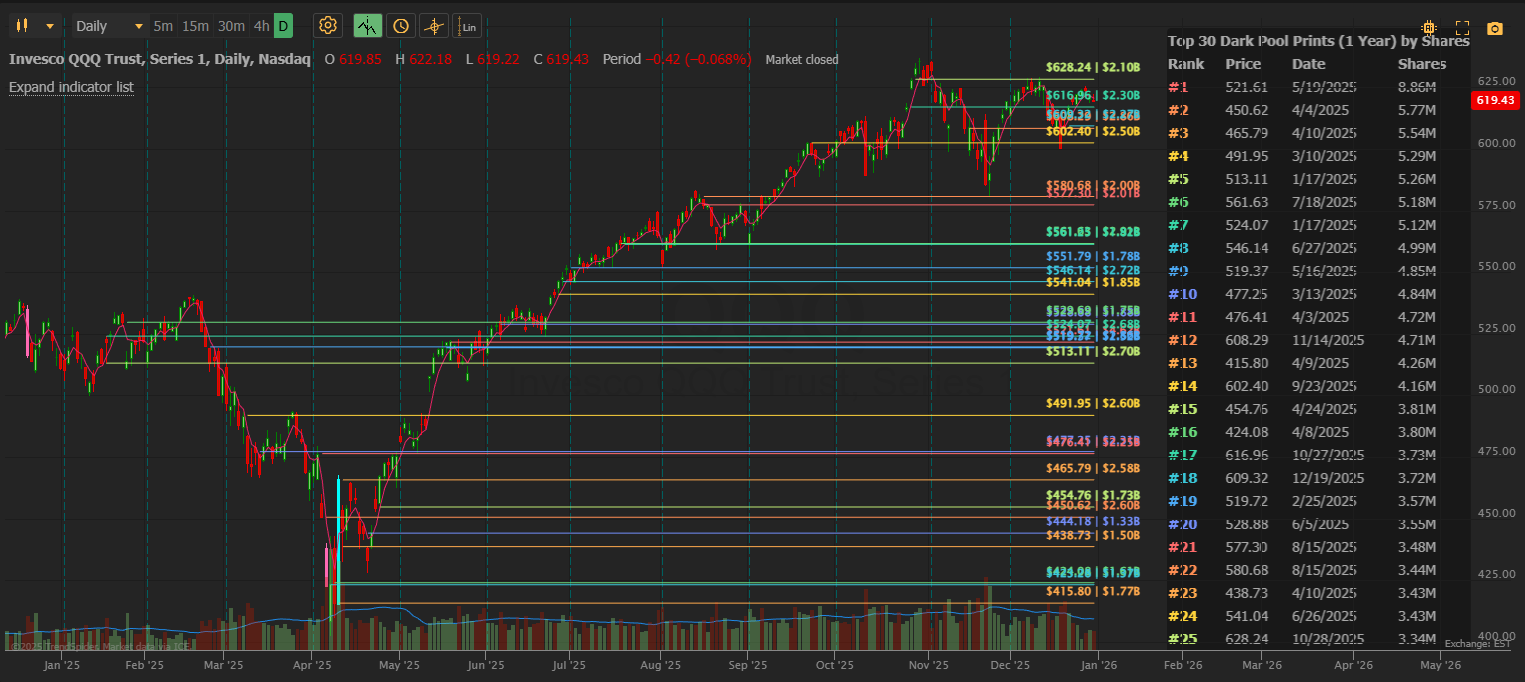
If 10 separate institutions each bought 100,000 shares at $150.00, you’ll see one line at $150.00 showing 1,000,000 total shares and “10” in the # Trades column. This gives you the full picture of institutional interest at that level.
Rank is always determined by share volume (#1 = most shares). But you can sort the table by Price or Date for different views. The rank numbers stay the same — only the display order changes.
| Column | Meaning | Example |
|---|---|---|
| Shares | Number of shares traded | 2,500,000 |
| Value | Dollar value (Shares × Price) | $425M |
Both are useful. Shares shows raw volume; Value helps compare across different stock prices.
Lower-volume stocks have less institutional dark pool activity. If you’re seeing few or no lines:
It depends on your trading style:
| Style | Recommended Range |
|---|---|
| Day trading | Today or Week |
| Swing trading | 30 Days or 60 Days |
| Position trading | 90 Days to 1 Year |
This depends on the stock’s typical volume:
| Stock Type | Recommended Minimum |
|---|---|
| Mega-caps (AAPL, MSFT, SPY) | 200,000 – 500,000 |
| Large-caps | 100,000 – 200,000 |
| Mid-caps | 50,000 – 100,000 |
| Small-caps | 50,000 |
Yes. In settings, uncheck “◆ Show Table” to display only the lines.
Yes. In settings, uncheck “◆ Show Labels” to display only the lines without text labels.
Yes. In the indicator settings panel, you’ll see each “DP Line” listed with a color swatch. Click EDIT to customize colors.
| Preset | Columns Shown |
|---|---|
| Standard | Rank, Price, Date, Shares |
| Minimal | Rank, Price |
| Compact | Rank, Price, Shares |
| Full | All columns |
Choose based on how much detail you want and your available chart space.
Try these steps in order:
This means the prints occurred at dates earlier than your visible chart range. Solutions:
Dark Pool Levels caches data for 5 minutes to optimize performance and automatically refreshes. If you are having issues:
For real-time updates (60-second refresh), consider Dark Pool Levels PRO.
This means no trades matched your criteria. Try:
TrendSpider requires a consistent number of painted elements. If lines disappear after changing settings:
The Custom Start date field must be within the valid range (past 1 year to today). If you see a validation error:
You can cancel anytime through the TrendSpider store. Your access continues until the end of your billing period.
Yes! TrendSpider offers a free trial so you can test Dark Pool Levels on your charts before subscribing.
| Feature | Standard ($39.95/mo) | PRO ($59.95/mo) |
|---|---|---|
| Data refresh | 5 minutes | 60 seconds |
| Max levels | 30 | 50 |
| Lookback period | 1 year | 5+ years (Jan 2020) |
| Custom end date | ❌ | ✅ |
| Historical ranges | ❌ | ✅ |
PRO is ideal for:
If your question isn’t answered here, contact us directly:
Email: support@mobyticktrading.com
We typically respond within 24 hours on business days.