Physical Address
304 North Cardinal St.
Dorchester Center, MA 02124
Physical Address
304 North Cardinal St.
Dorchester Center, MA 02124
Every day, billions of dollars in stock trades happen in the shadows. These aren’t your typical retail orders — they’re massive institutional block trades executed in private exchanges called dark pools.
Until now, retail traders had no way to see these hidden transactions. You’d watch price bounce off “invisible” levels, never understanding why. You’d see support appear out of nowhere, or resistance that made no sense on your chart.
Dark Pool Levels changes that.
For the first time, you can see exactly where institutions are executing large block trades — right on your TrendSpider chart, updated within 5 minutes of execution.
Institutions don’t trade like retail. When a hedge fund wants to buy 5 million shares of AAPL, they can’t just hit “buy” on Robinhood. That order would move the market against them before it even filled.
Instead, they execute in dark pools — private exchanges where large orders can be filled without revealing their hand to the market.
But here’s the thing: Those trades still get reported to the tape. And now you can see them.
When you see a 3 million share print at $178.25, you know something important:
| Traditional Charts | Dark Pool Levels |
|---|---|
| Shows retail order flow only | Reveals institutional block trades |
| Support/resistance based price action | Support/resistance based on actual large transactions |
| Guessing where institutions are | Knowing where institutions are |
| Historical patterns only | Real-time updates within 5 minutes |
| No insight into hidden liquidity | Full visibility into dark pool activity |
Real-time updates — within 5 minutes of trade execution
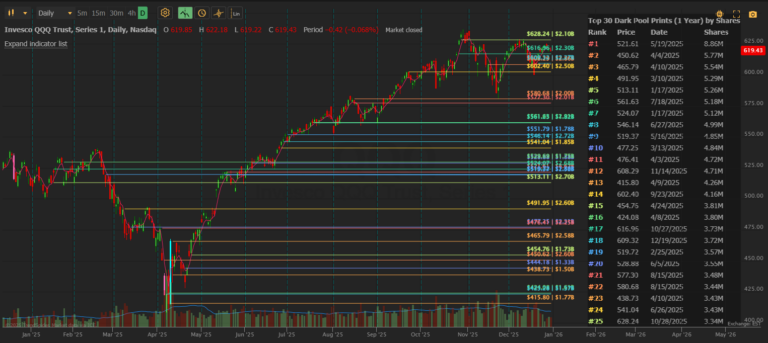
Each line on your chart represents an actual institutional transaction — not a calculated indicator, not a guess. These are real trades executed in dark pools, ranked by share volume.
The largest prints get the warmest colors (red/orange), making it easy to spot the most significant institutional levels at a glance.
A clean, customizable table displays your dark pool prints with:
Choose from 9 preset column layouts, from minimal (just Rank and Price) to full (all columns).
Attach informative labels to each level showing exactly what matters to your trading style — price only, price + size, all details, or anything in between.
From intraday scalping to swing trading to long-term investing:
Dark pool levels often act as invisible support and resistance zones. When you see multiple large prints clustered at a price level, institutions have established positions there — and they’ll likely defend those levels.
What to look for:
When institutions are building positions, they execute in dark pools to avoid moving the market. Watch for fresh prints appearing on your chart throughout the trading day.
What to look for:
Large prints appearing as price rises into resistance can signal institutional distribution — smart money selling into retail buying.
What to look for:
After a pullback, dark pool levels from recent weeks often become re-entry zones. Institutions who bought at $150 may add more if price returns to that level.
What to look for:
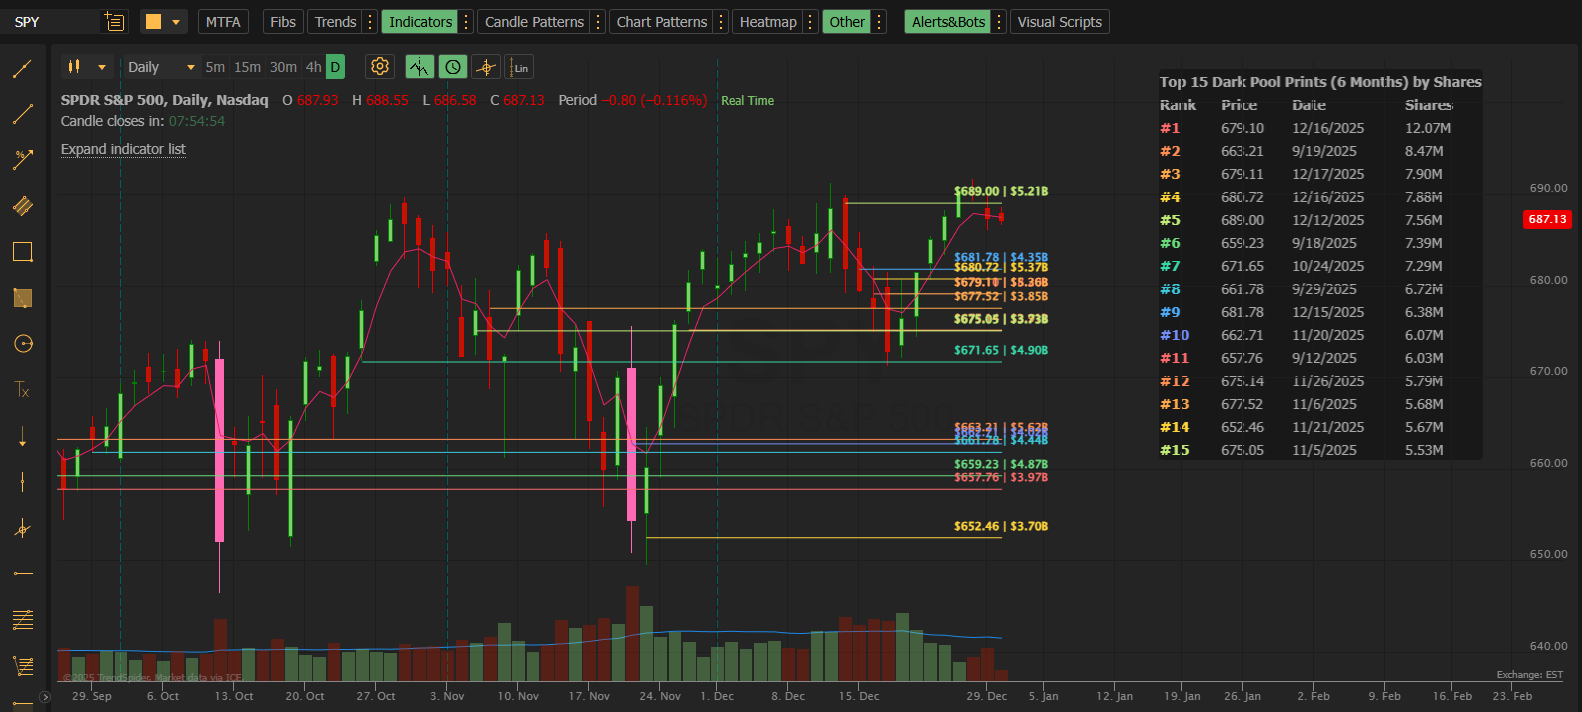
You see SPY approaching resistance at $690. You load Dark Pool Levels and notice three large prints (5M+ shares each) at $689.50-$690.00 over the past week.
Interpretation: Institutions are actively transacting at this level. If price breaks above with volume, these levels become support. If rejected, institutions may be distributing.
AAPL drops 3% and you’re wondering where to buy. You load Dark Pool Levels (60 Days) and see the largest print of the period at $178.25 with 8M shares.
Interpretation: This is a high-conviction institutional level. Watch for price reaction at $178.25 — institutions often defend their positions.
You’re trading NVDA on a 5-minute chart. You set Date Range to “Today” and watch as new prints appear within minutes of execution.
Interpretation: Fresh prints appearing in real time show you exactly where large orders are being filled right now. Use these as intraday support/resistance levels.
You want to buy MSFT on a pullback. You load Dark Pool Levels (90 Days) and sort by Shares (Largest). The top 5 prints are all between $415-$420.
Interpretation: This price zone has absorbed significant institutional volume. It’s a high-probability support zone for a swing entry.
Add the indicator twice on the same chart:
This lets you see fresh trades against historically significant levels — a powerful confluence signal.
This filters noise and shows only the prints that matter for that stock’s typical volume.
A single print at a price is interesting. Five prints within a $0.50 range? That’s an institutional zone they care about.
One avoided stop-out. One better entry. One time you held through the noise because you could see institutions defending a level.
That’s all it takes to pay for this indicator many times over.
The game isn’t rigged — you just couldn’t see the whole board.
Now you can.
$39.95/month — Cancel anytime
Includes:
Stop guessing. Stop hoping. Start seeing where the smart money is positioned.
Start Your Free Trial on TrendSpider
New to the indicator? Check our Quick Start Guide to get set up in 2 minutes.
Have questions? See the FAQ & Troubleshooting page.
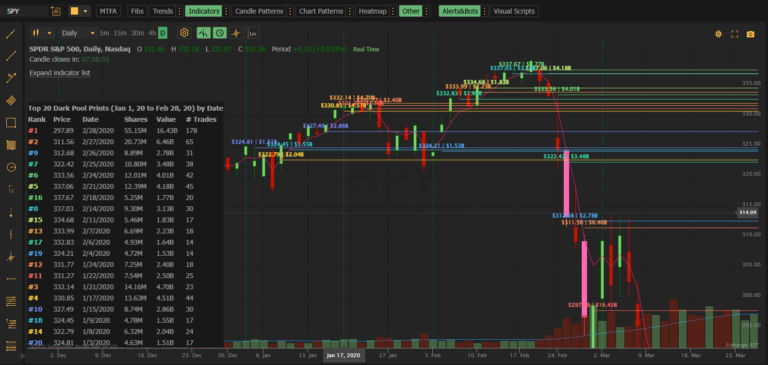
Want more power? Check out Dark Pool Levels PRO for 60-second updates, up to 50 levels, and historical date ranges back to January 2020.
Dark Pool Levels for TrendSpider by MobyTick Trading — Institutional Intelligence for Retail Traders
Learn more at MobyTickTrading.com