Physical Address
304 North Cardinal St.
Dorchester Center, MA 02124
Physical Address
304 North Cardinal St.
Dorchester Center, MA 02124

Learn how institutional dark pool prints consistently appear before major news events, using real examples from SPY and UNH, and a systematic swing trading checklist.
From the Moby Tick Webinar: “What Does It Mean To Follow The Money?”
One of the most important concepts in dark pool trading is understanding that institutional prints consistently appear before major news events move a stock’s price. This isn’t speculation — it’s a pattern that repeats week after week, across tickers and sectors. Learn to read the tape, and you can position yourself alongside the institutions rather than reacting to headlines after the fact.
Dark pool prints appear before major news catalysts — consistently.
As retail traders, we’re conditioned to react to headlines. “Growth fears snowball.” “Analyst downgrades.” “Bearish momentum drives fresh lows.” These headlines create urgency — and fear. But by the time you read the headline, the institutions have already placed their trades. The news is the catalyst that moves the price after they’re already positioned.
Think about it this way: if an institution places a $3.7 billion trade in SPY on the same day that Reuters publishes “Growth fears snowball,” who had better information? The institution committing billions, or the headline writer? The trade was filled on a private exchange before the news hit your screen.
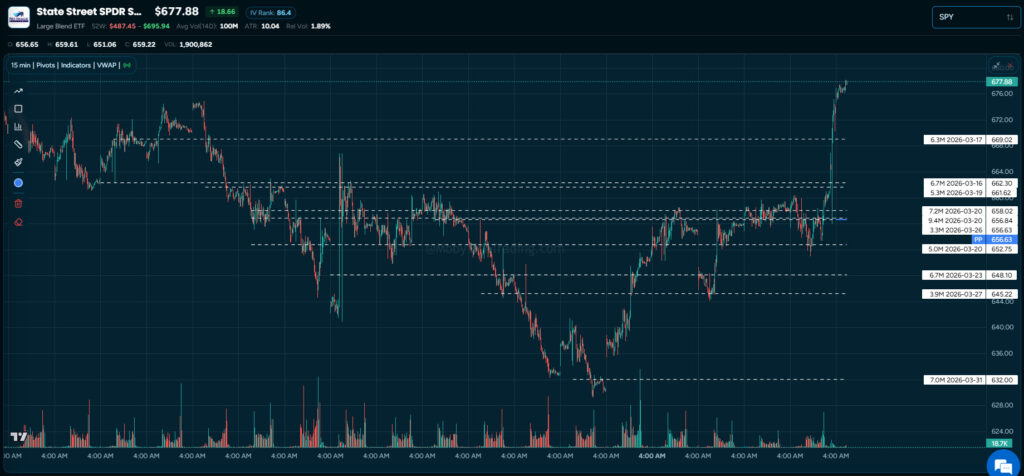
On March 30th, SPY had a big red candle. Headlines were grim: growth fears, inflation stress, bearish sentiment everywhere. If you were reading Reuters, you were probably thinking about selling.
But dark pool prints told a completely different story:
Total institutional activity on that single day: approximately $3.7 billion in dark pool prints. All while headlines screamed fear.
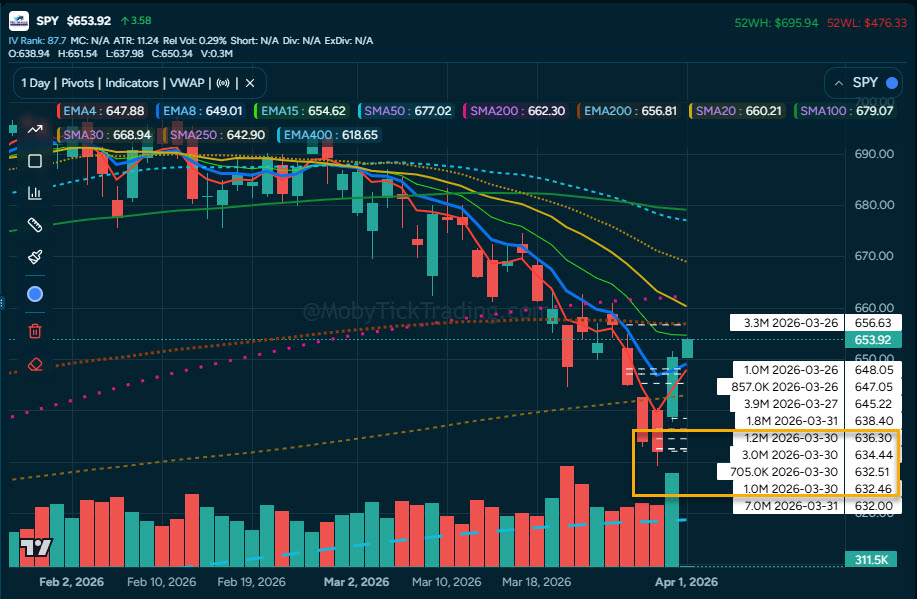
The very next day — March 31st — the Wall Street Journal’s headline read: “Nasdaq leads rally.” SPY bounced $22 in two days. Institutions were buying on March 30th while retail was selling into the panic. By the time the bullish headline appeared, the move was already underway.
United Health Group showed the exact same playbook. On March 27th, UNH dropped 4.7% on headlines about regulatory scrutiny, cyber attack costs, and analyst downgrades. Volume was increasing to the downside — it looked terrible.
But behind the scenes, institutions were accumulating aggressively. Between March 11th and March 20th, approximately $3 billion in dark pool prints appeared.
Then on March 23rd, UNH was added to a top-10 ETF holding (SCHD). Two days later, UBS issued a $410 price target upgrade. Two days after that, the stock dropped 3% — maximum fear — but institutions were still buying.
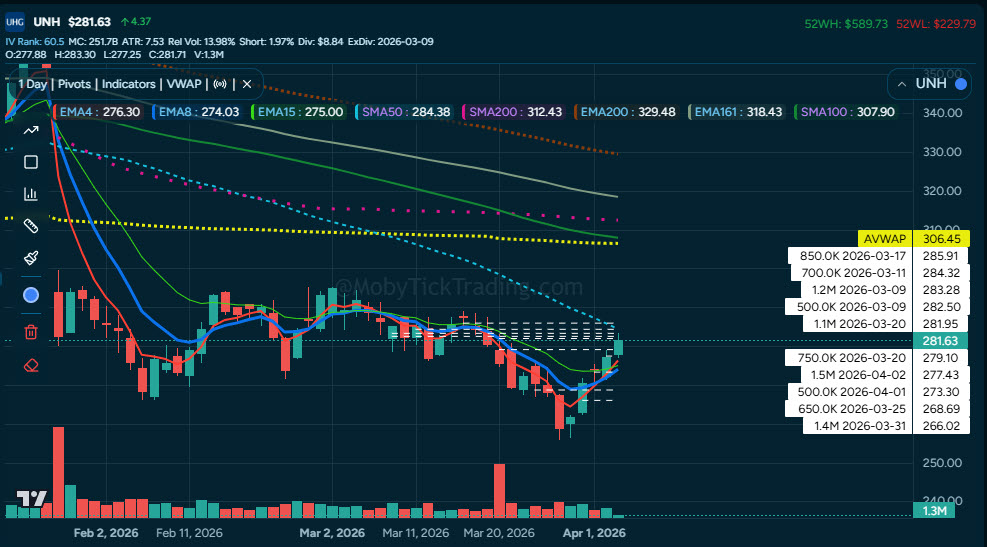
Between March 31st and April 2nd alone:
1.41M shares @ $266 + 1.5M shares @ $277 = $791M in 3 days.
Total institutional accumulation: approximately $3.5 billion. From the lows, UNH jumped 9%.
How do you know if a dark pool print represents buying or selling? Dark pools are anonymous by design — neither party knows who they’re trading with. But the price action after the print reveals intent.
A print remains relevant as long as it acts as support or resistance. If price slices through a print level with no pause, no wick, no bounce — it’s no longer useful. But prints from weeks or months ago can still act as key levels.
The systematic approach for identifying high-conviction swing trade setups using dark pool data:
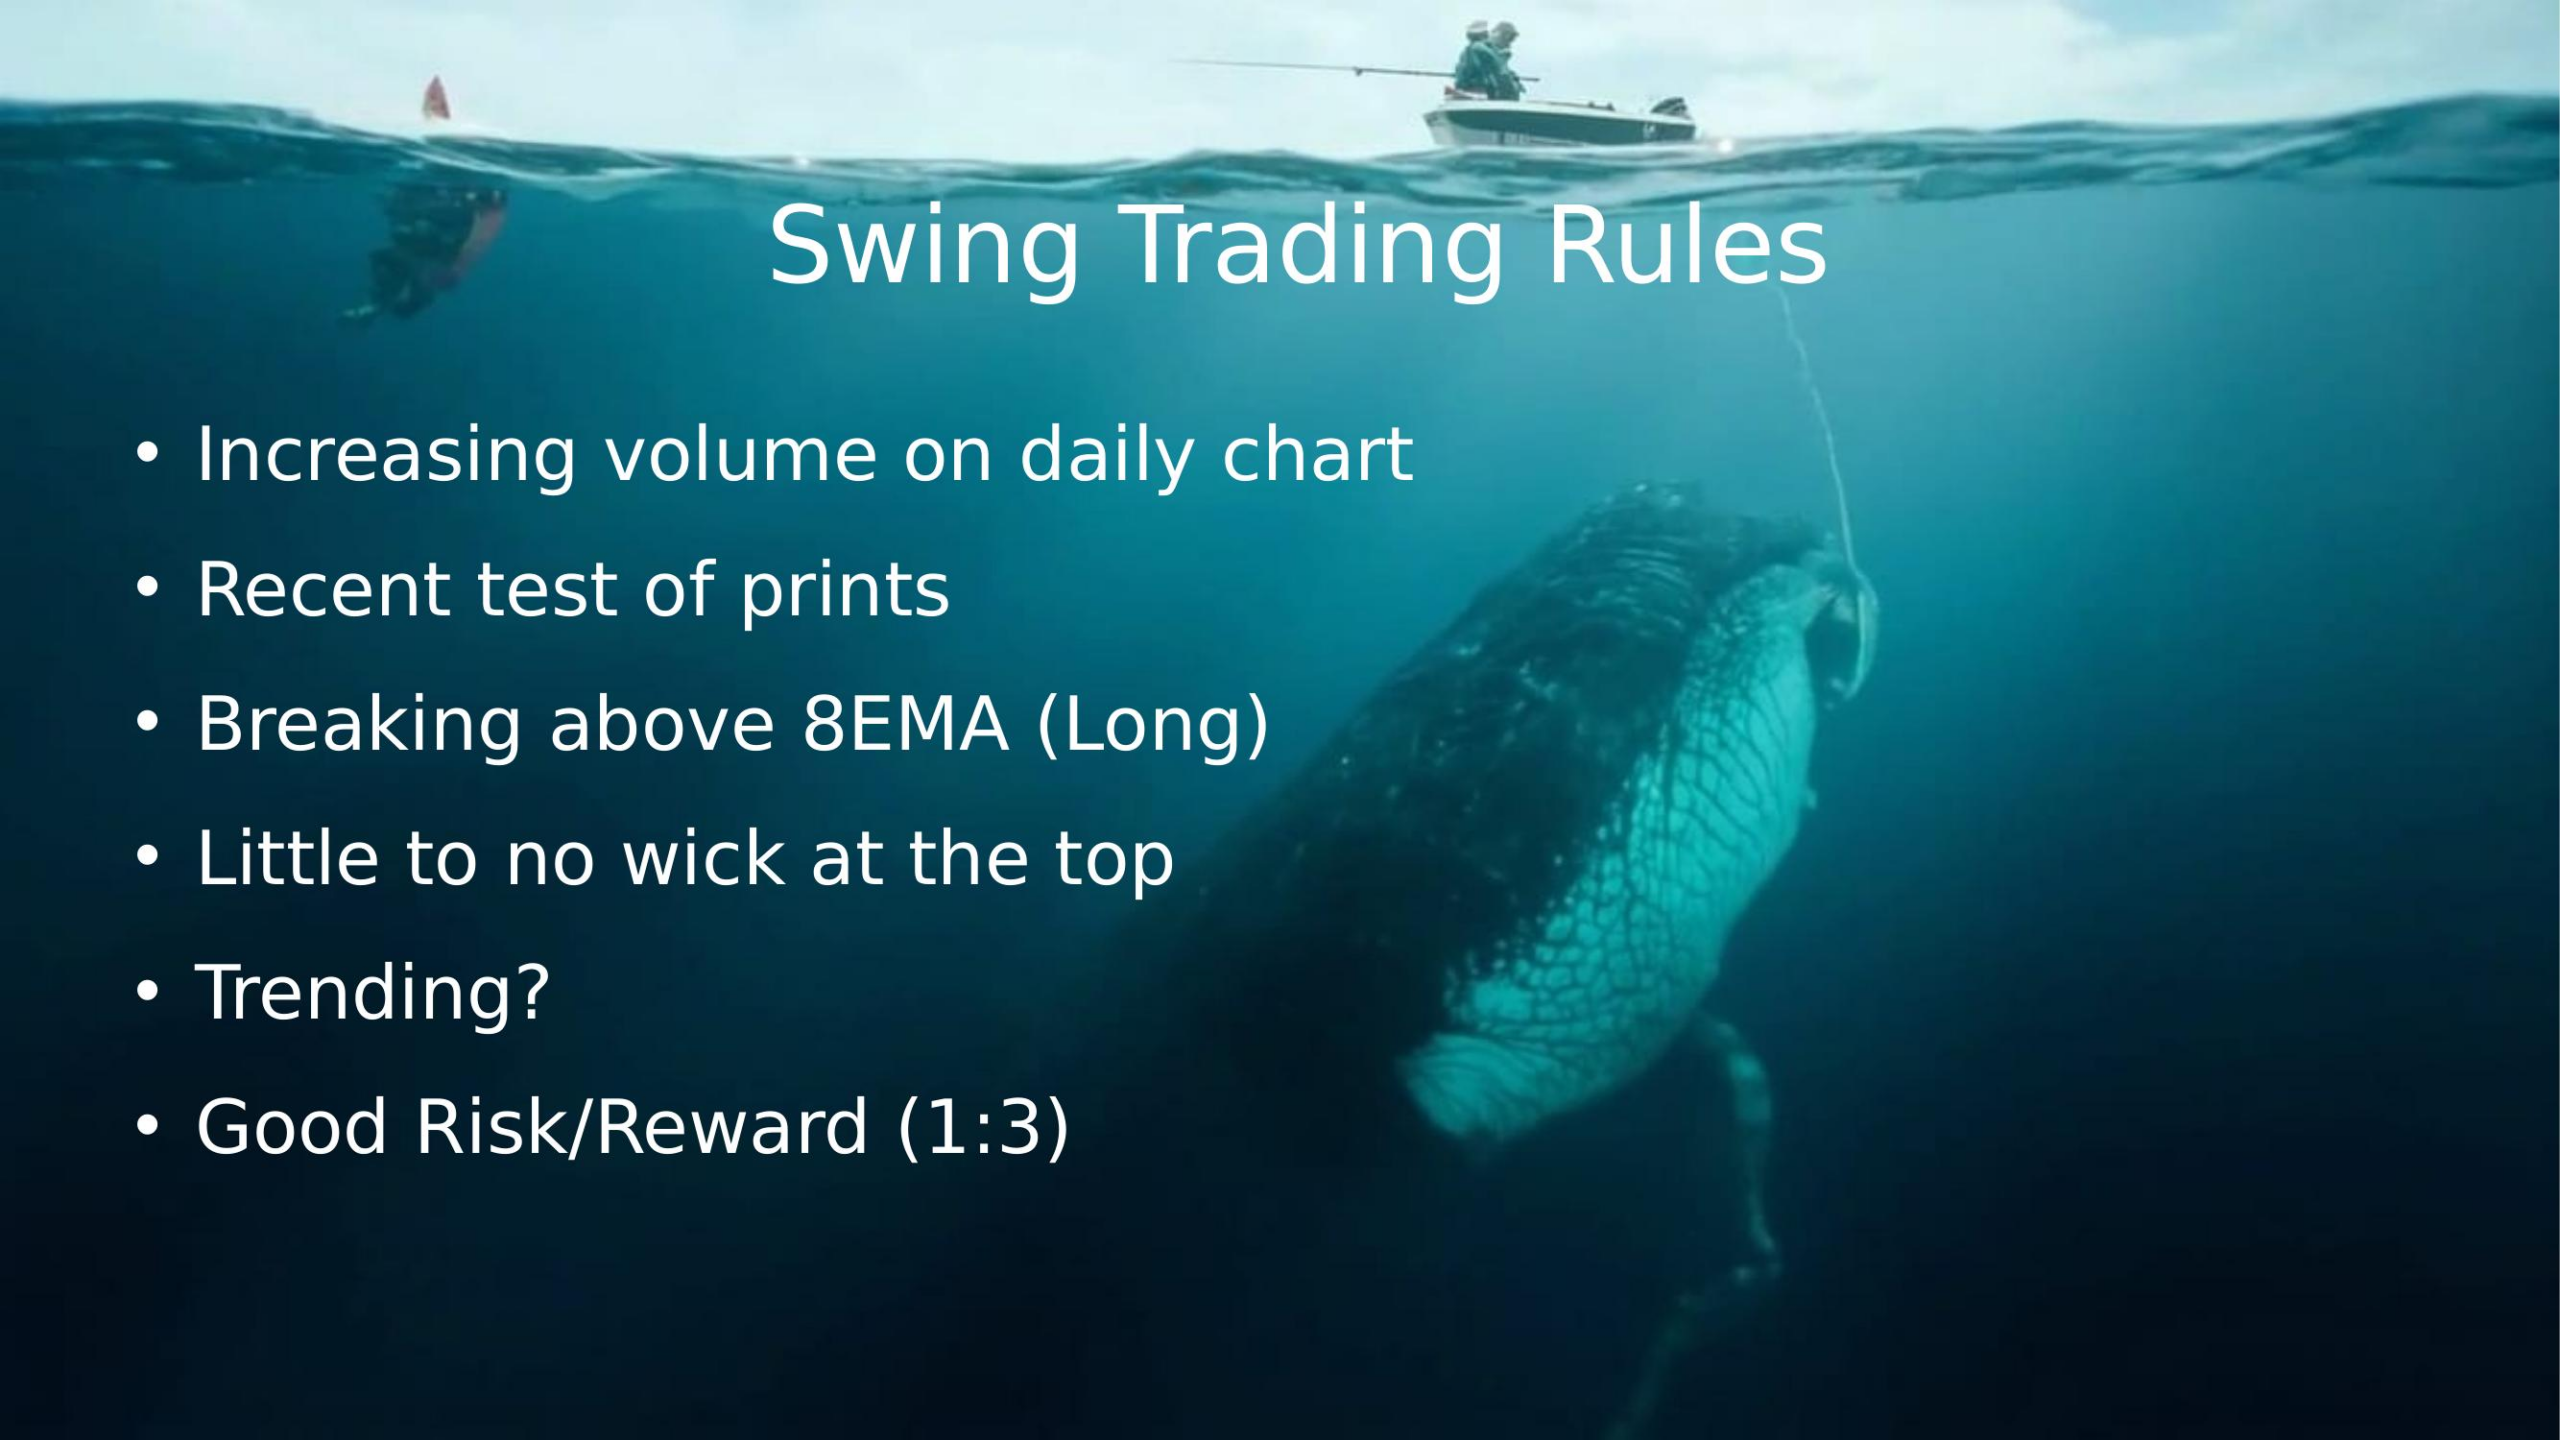
On intraday charts (5-minute and 15-minute), prints act as precise support and resistance. Price bounces between prints like a pinball — “print pong.” Each level either holds or breaks, giving clear entry and exit signals.
Several features in development to enhance how subscribers interact with dark pool data:
Disclaimer: For educational purposes only, not financial advice. All setups are examples, not trade recommendations. Past dark pool activity does not guarantee future results. Do your own research.