Physical Address
304 North Cardinal St.
Dorchester Center, MA 02124
Physical Address
304 North Cardinal St.
Dorchester Center, MA 02124

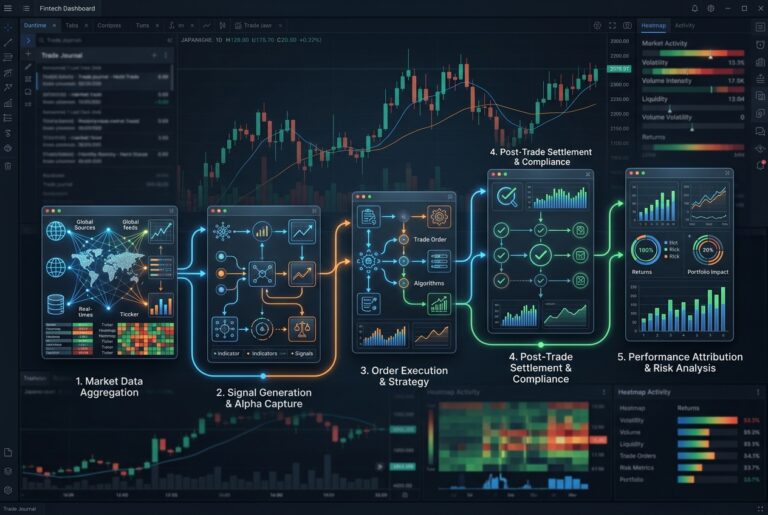
If you’re serious about understanding market dynamics, dark pool data is essential. Approximately 30-40% of all U.S. equity trading volume happens off-exchange through Alternative Trading Systems — invisible to standard platforms. Here’s what makes a dark pool trading tool worth using.
Standard charting platforms show you public exchange data — what’s visible to everyone. Dark pool data reveals the institutional layer underneath. A good dark pool trading tool bridges that gap.
Not all tools do this equally well. Here’s how to evaluate them.
Some tools track only the top 100-500 names. Others, like MobyTick, track 10,000+ stocks. Broad coverage matters because significant institutional activity can appear anywhere — not just in mega-cap names everyone already watches.
One print is a data point. A pattern of prints at the same level over months is a signal. Tools with 6+ years of historical data let you build institutional positioning maps that go far beyond today’s activity.
Raw dark pool data is overwhelming. A good tool lets you filter by:
Dark pool prints under current FINRA rules must be reported within 10 seconds of execution. Tools that deliver this data in near real-time give you actionable intelligence while it still matters.
A $500 million print in Apple is routine. The same $500 million in a mid-cap stock is extraordinary. The best tools calculate volume ratio (print size vs. ADV) automatically — giving you meaningful context, not just raw numbers.
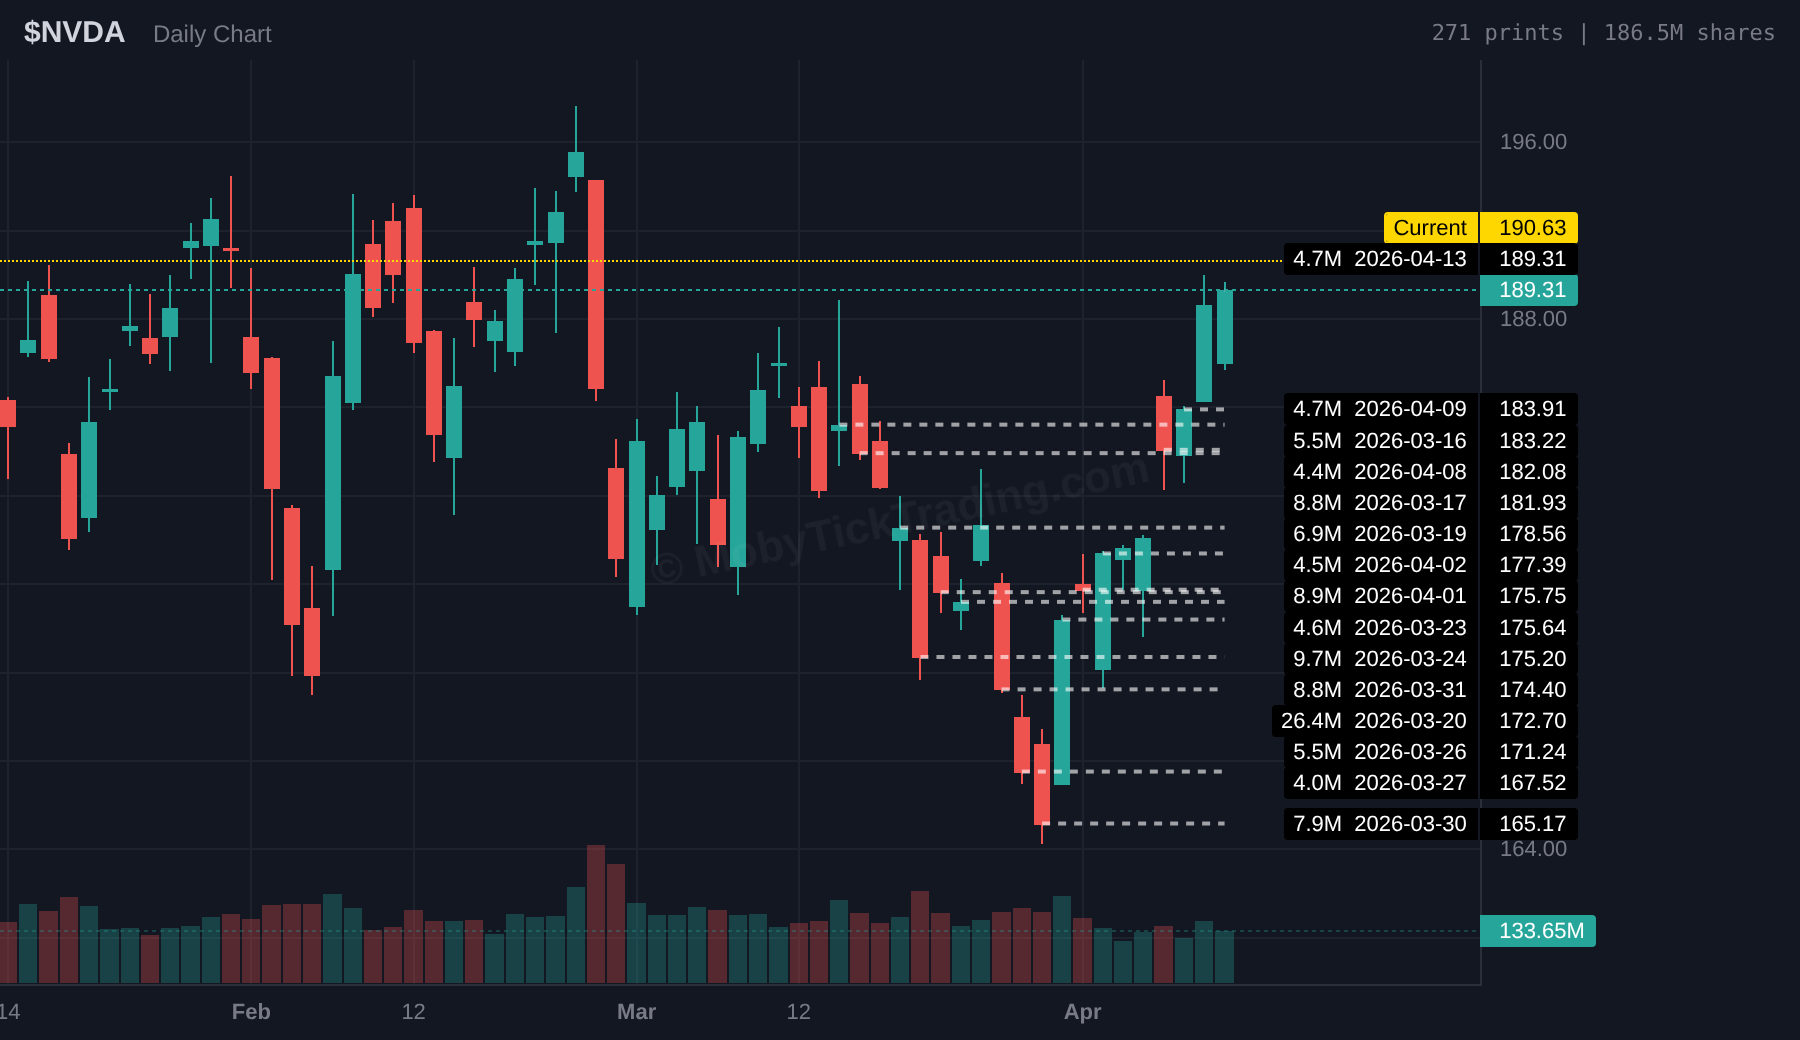
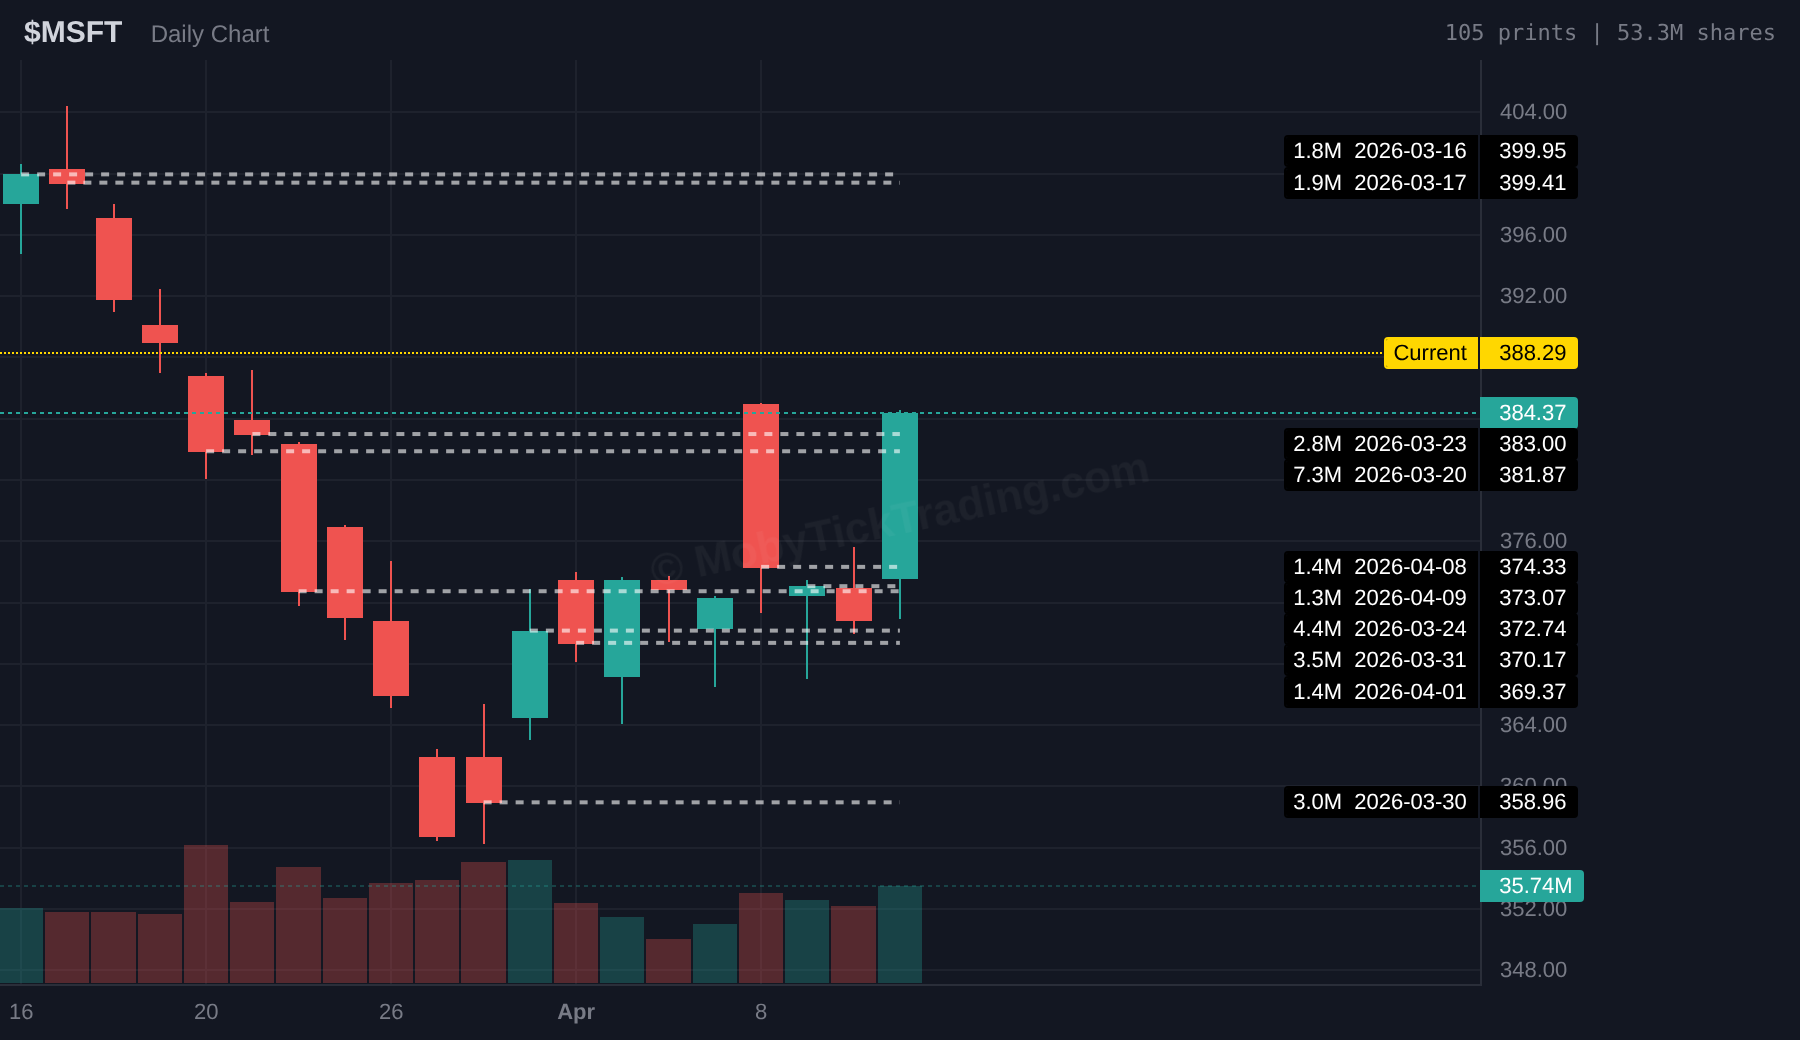
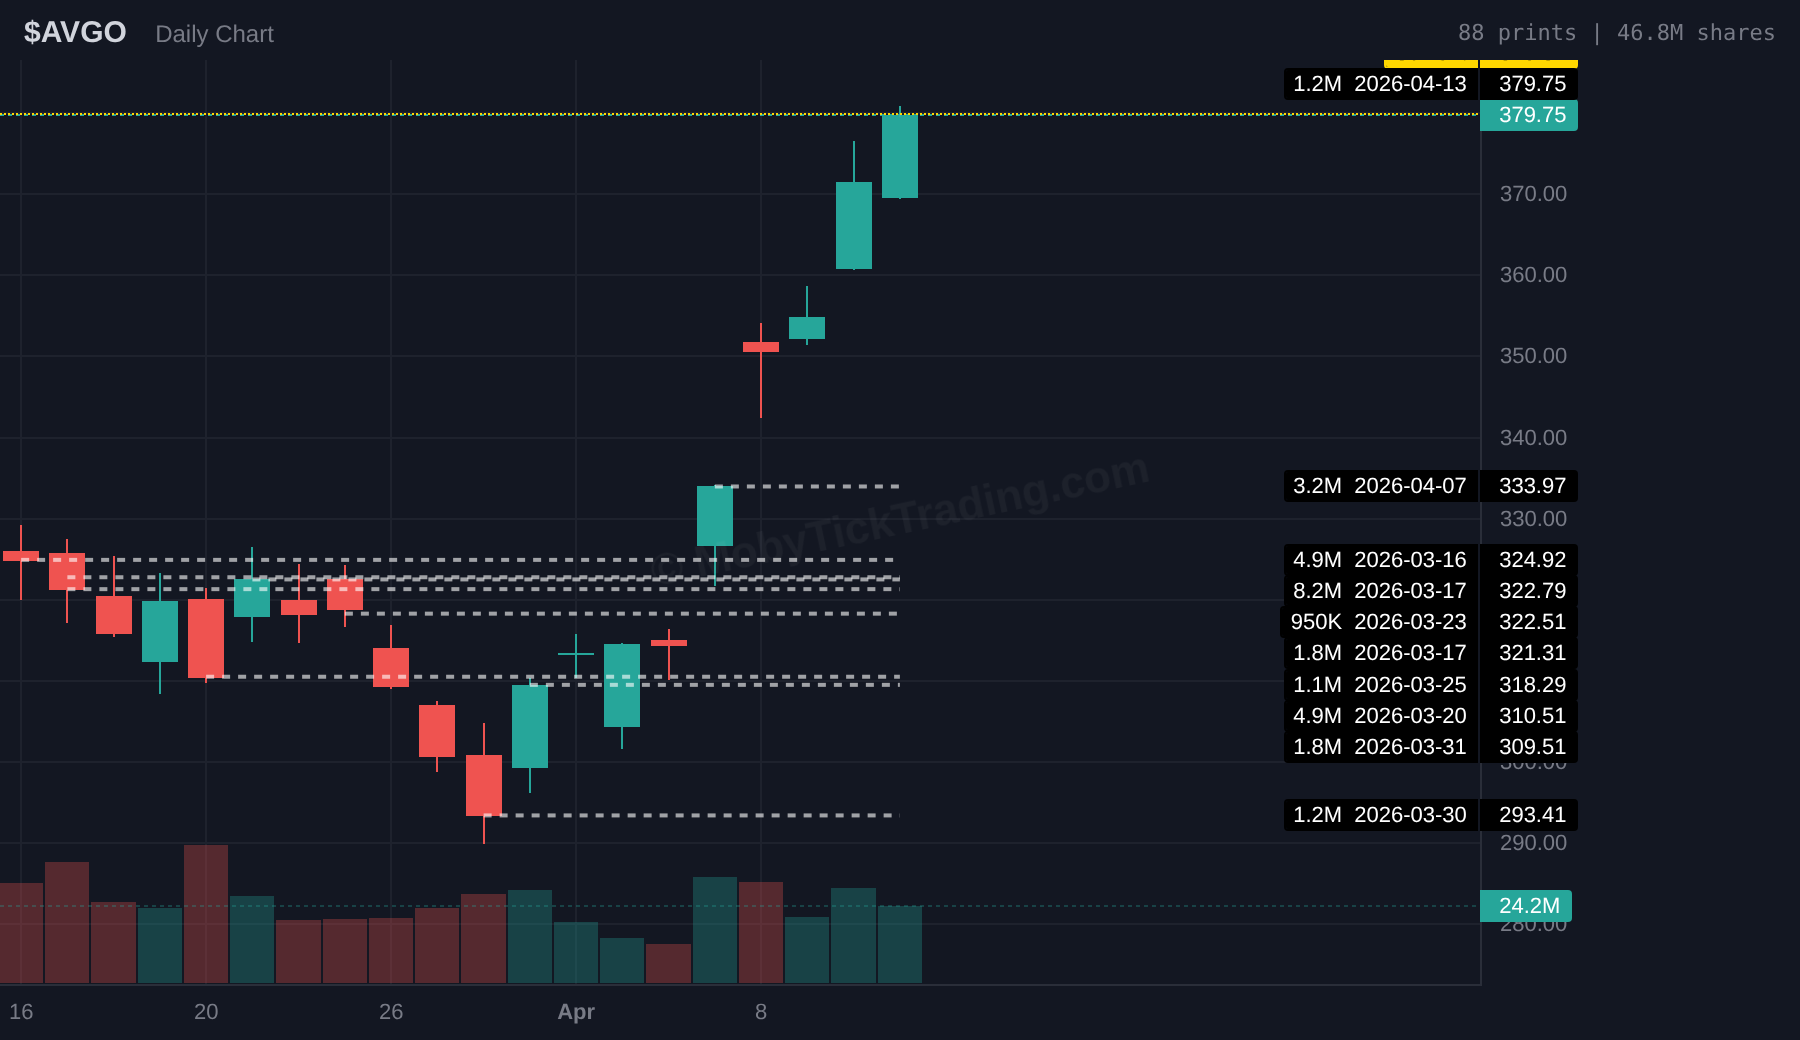
Here’s verified dark pool activity from the week of March 16-24, 2026 — data pulled directly from the MobyTick API:
| Ticker | Print Size | Price | Dollar Value | Date |
|---|---|---|---|---|
| NVDA | 26.4M shares | $172.70 | $4.55B | March 20 |
| SPY | 10.6M shares | $658.02 | $6.96B | March 20 |
| MSFT | 7.3M shares | $381.87 | $2.77B | March 20 |
| AVGO | 8.2M shares | $322.79 | $2.64B | March 17 |
| MU | 4.5M shares | $422.90 | $1.92B | March 20 |
Each of these represents a verified dark pool print — a single execution where an institution committed billions at a specific price. Together, they illustrate what institutional positioning looks like during periods of market stress.
| Feature | MobyTick | Competitor Avg. |
|---|---|---|
| Stocks Tracked | 10,000+ | 2,000-3,000 |
| Historical Data | 6+ years | Limited |
| Real-Time Alerts | ✅ | ✅ (higher tiers) |
| Opening/Closing Filters | ✅ | Limited |
| API Access | ✅ | Usually ❌ |
| Price | $19.99/mo | $49-149/mo |
A great dark pool trading tool gives you visibility into the institutional layer of the market. The features that matter most: broad coverage, historical depth, real-time delivery, and smart filtering.
MobyTick delivers all of these: 10,000+ stocks, 6+ years of history, real-time prints, and pricing starting at $19.99/month.
Start your free trial at mobyticktrading.com.