Physical Address
304 North Cardinal St.
Dorchester Center, MA 02124
Physical Address
304 North Cardinal St.
Dorchester Center, MA 02124
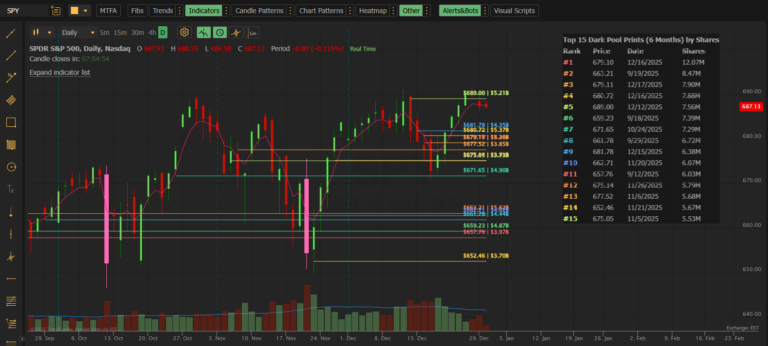
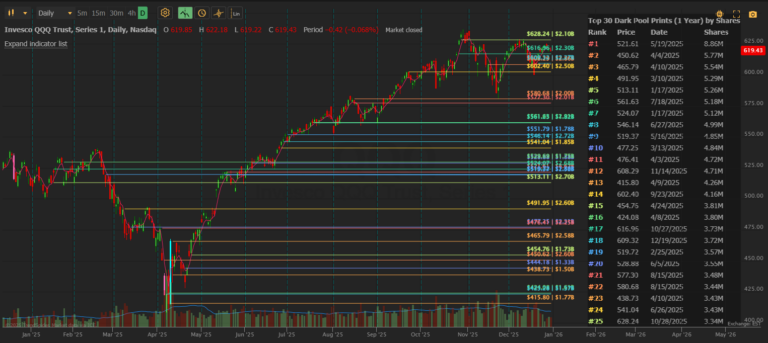
Dark Pool Levels changed the game by showing you where institutions are trading. Dark Pool Levels PRO takes it further — with real-time updates, more levels, and the ability to research any market period back to January 2020.
If you’re serious about tracking institutional flow, PRO gives you the complete picture.
| Feature | Standard | PRO |
|---|---|---|
| Data Refresh | 5 minutes | 60 seconds |
| Max Levels | 30 | 50 |
| Lookback Period | 1 year | 6+ years (Jan 2020) |
| Custom End Date | ❌ | ✅ |
| Historical Analysis | ❌ | ✅ |
| Price | $39.95/mo | $59.95/mo |
In fast markets, 5 minutes is an eternity. PRO delivers dark pool prints to your chart within 60 seconds of execution.
This matters when:
With PRO, you’re seeing institutional trades almost as fast as they’re reported. No more waiting. No more wondering.
Standard gives you 30 levels. For many traders, that’s enough.
But if you’re analyzing:
…you’ll want more levels to see the complete picture.
50 levels means:
This is the feature that makes PRO a research powerhouse.
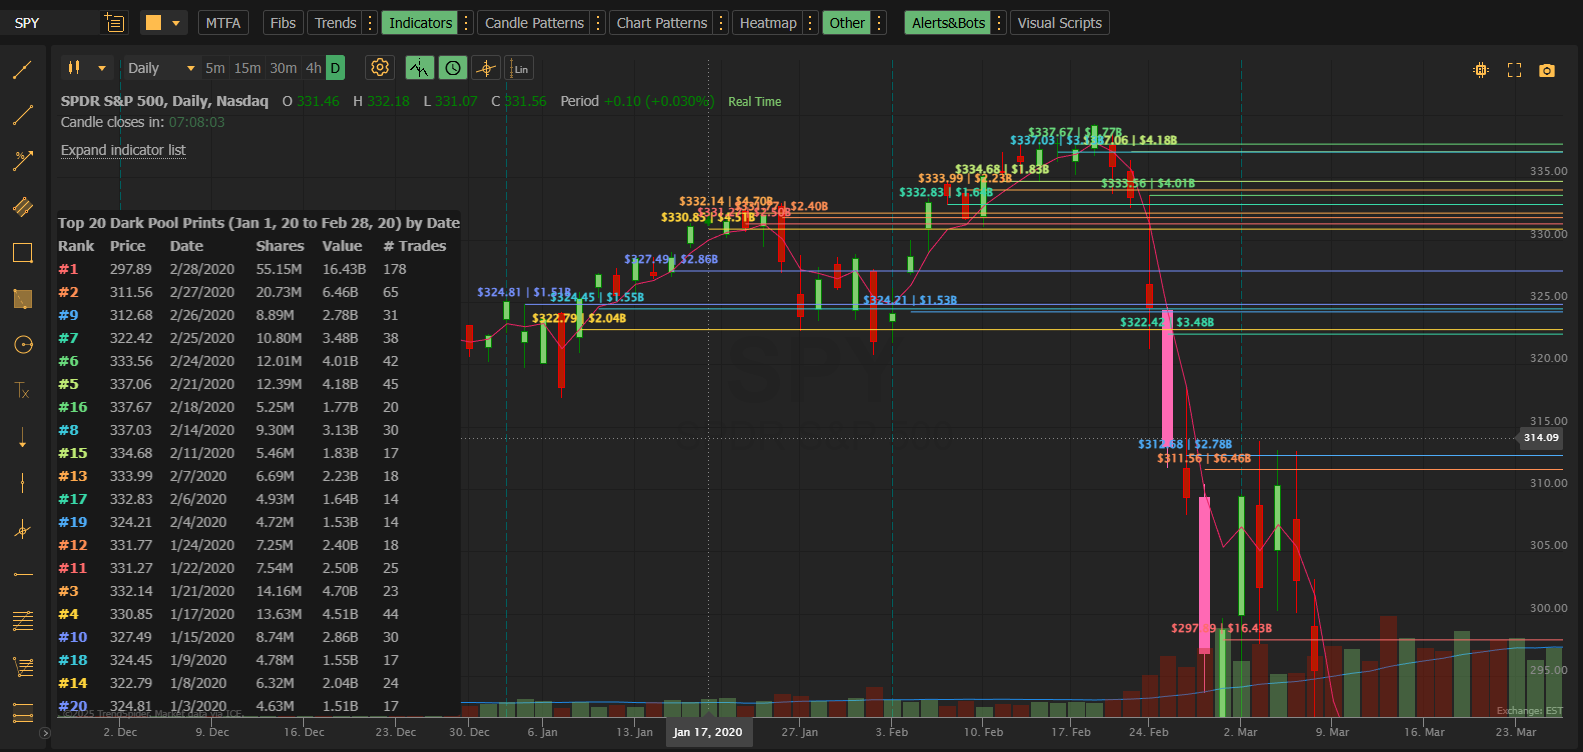
Standard limits you to the past year. PRO opens up 5+ years of institutional data — back to January 1, 2020.
Why this matters:
| Historical Period | What You Can Analyze |
|---|---|
| COVID Crash (Feb-Mar 2020) | Where institutions bought the bottom |
| 2020-2021 Bull Run | Accumulation patterns during the rally |
| 2022 Bear Market | Distribution zones before major drops |
| 2023 Recovery | Smart money re-entry points |
| Fed Rate Decisions | Institutional positioning around FOMC |
| Earnings Seasons | Historical institutional behavior around reports |
Example use case:
You want to understand how institutions behaved during the COVID crash. Set your date range:
Now you can see exactly where the largest dark pool prints occurred during one of the most volatile periods in market history. Where did institutions buy? Where did they sell? What levels did they defend?
This kind of historical analysis is impossible with delayed or limited data. PRO makes it simple.
Standard always ends at “today.” PRO lets you set both start AND end dates.
Why custom end dates matter:
| Scenario | Start Date | End Date |
|---|---|---|
| Analyze Q4 2024 only | Oct 1, 2024 | Dec 31, 2024 |
| Study pre-earnings period | 30 days before earnings | Earnings date |
| Research specific correction | Top of range | Bottom of range |
| Compare two time periods | Period 1, then Period 2 | Separate analyses |
This transforms Dark Pool Levels from a trading tool into a research platform.
You need real-time data. Period.
When you’re in and out of positions multiple times per day, a 5-minute delay means you’re trading on stale information. PRO’s 60-second updates keep you in sync with institutional flow as it happens.
PRO setup for day trading:
You hold positions for days or weeks. You want to enter where institutions are positioned and exit before they do.
PRO’s extended lookback and 50 levels help you identify:
PRO setup for swing trading:
You study market structure. You want to understand how institutions behave during specific events.
PRO’s historical date ranges let you:
PRO setup for research:
You trade around key levels. Knowing where institutions are positioned helps you:
PRO’s real-time updates and extended levels give you more data points to inform your options strategies.
Everything in Standard is included:
Data updates within 60 seconds of trades being reported to the tape. This is as close to real-time as dark pool data gets.
See up to 50 institutional transactions on your chart at once. More levels = more complete picture of institutional positioning.
| Option | Lookback |
|---|---|
| Today | Current session |
| Week | 7 days |
| 30 Days | 1 month |
| 60 Days | 2 months |
| 90 Days | 3 months |
| 6 Months | 6 months |
| 1 Year | 12 months |
| 2 Years | 24 months |
| 3 Years | 36 months |
| 4 Years | 48 months |
| 5 Years | 60 months |
| All | Back to Jan 2020 |
| Custom | Any date range |
Set both boundaries of your analysis:
The table title automatically shows your selected date range (e.g., “Jan 15, 20 to Mar 31, 20”) so you always know what period you’re viewing.
If you accidentally set an end date before your start date, PRO automatically corrects it to prevent errors. The table displays the actual dates being used, so you always know what you’re seeing.
NVDA is approaching resistance at $140. You have PRO loaded with Date Range: Today.
At 10:47 AM, a fresh dark pool print appears: 2.1M shares at $139.85.
What this tells you: Institutions just committed $294M at this level. If price breaks above, they’re positioned for upside. If it fails, this becomes a reference level.
With Standard’s 5-minute delay, you might not see this print until the breakout has already happened or failed.
You want to understand where institutions sold during the crash.
PRO settings:
Now you see the 50 largest institutional dark pool prints during the crash. Where did smart money start selling? What levels did they accumulate? This historical intelligence informs how you might trade the next major correction.
The Standard indicator can’t look back this far.
AAPL reports earnings next week. You want to see how institutions have been positioning over the past month.
PRO settings:
You see heavy accumulation between $178-$180 over the past two weeks. Multiple prints, high conviction.
Interpretation: Institutions are building positions ahead of earnings. These levels likely become support if earnings disappoint, or a base for continuation if earnings beat.
You want to compare institutional positioning before and after a major Fed announcement.
Analysis 1 (Before):
Analysis 2 (After):
Compare the prints. Did institutions accumulate before the announcement? Did they distribute after? Where are the new levels vs. the old ones?
This kind of comparative analysis requires custom end dates — a PRO-only feature.
| Setting | Description | Default | Options |
|---|---|---|---|
| Start Date Range | How far back to begin | 30 Days | Today through All, or Custom |
| End Date Range | Where to end the range | Today | Today through All, or Custom |
| Custom Start | Specific start date (YYYYMMDD) | Today’s date | Jan 1, 2020 to today |
| Custom End | Specific end date (YYYYMMDD) | Today’s date | Jan 1, 2020 to today |
| Number of Prints | How many levels to display | 30 | 1 to 50 |
| Minimum Share Size | Filter threshold | 50,000 | 50,000 to 100,000,000 |
| Setting | Description | Default | Options |
|---|---|---|---|
| ◆ Show Table | Toggle table visibility | On | On/Off |
| ↳ Table Sort By | Row ordering | Shares (Largest) | Shares, Price, Date |
| ↳ Table Columns | Which columns to show | Standard | 9 presets |
| Setting | Description | Default | Options |
|---|---|---|---|
| ◆ Show Labels | Toggle label visibility | On | On/Off |
| ↳ Label Position | Where labels appear | Left | Left, Right |
| ↳ Label Format | Information displayed | Price + Size | 16 format options |
Every feature in PRO is designed to give you more information, faster.
| PRO Feature | Your Advantage |
|---|---|
| 60-second updates | See institutional trades before slower traders react |
| 50 levels | Complete picture of institutional positioning |
| 5-year history | Research any market period since 2020 |
| Custom end dates | Precise analysis of specific time windows |
For $20 more per month, you get:
One better trade per month pays for the upgrade many times over.
$59.95/month — Cancel anytime
Includes everything in Standard, plus:
Stop trading with partial information. Get the full picture of where smart money is positioned — in real time, with full historical context.
Start Your Free Trial on TrendSpider
Complete Indicator reference guide
New to Dark Pool Levels? Start with the Standard version or read the Quick Start Guide.
Have questions? Check the FAQ & Troubleshooting page.
Need help? Contact support@mobyticktrading.com
Dark Pool Levels PRO for TrendSpider by MobyTick Trading — Institutional Intelligence for Serious Traders
Learn more at MobyTickTrading.com