Physical Address
304 North Cardinal St.
Dorchester Center, MA 02124
Physical Address
304 North Cardinal St.
Dorchester Center, MA 02124

Mar 9-13 setups vs Mar 16-20 results
BULLISH: 4/13 triggered | 8 targets hit
BEARISH: 9/13 triggered | 28 targets hit
OVERALL: 13/26 setups triggered. Bearish side dominated.
| Ticker | Bull Trigger | Result | Bear Trigger | Result |
|---|---|---|---|---|
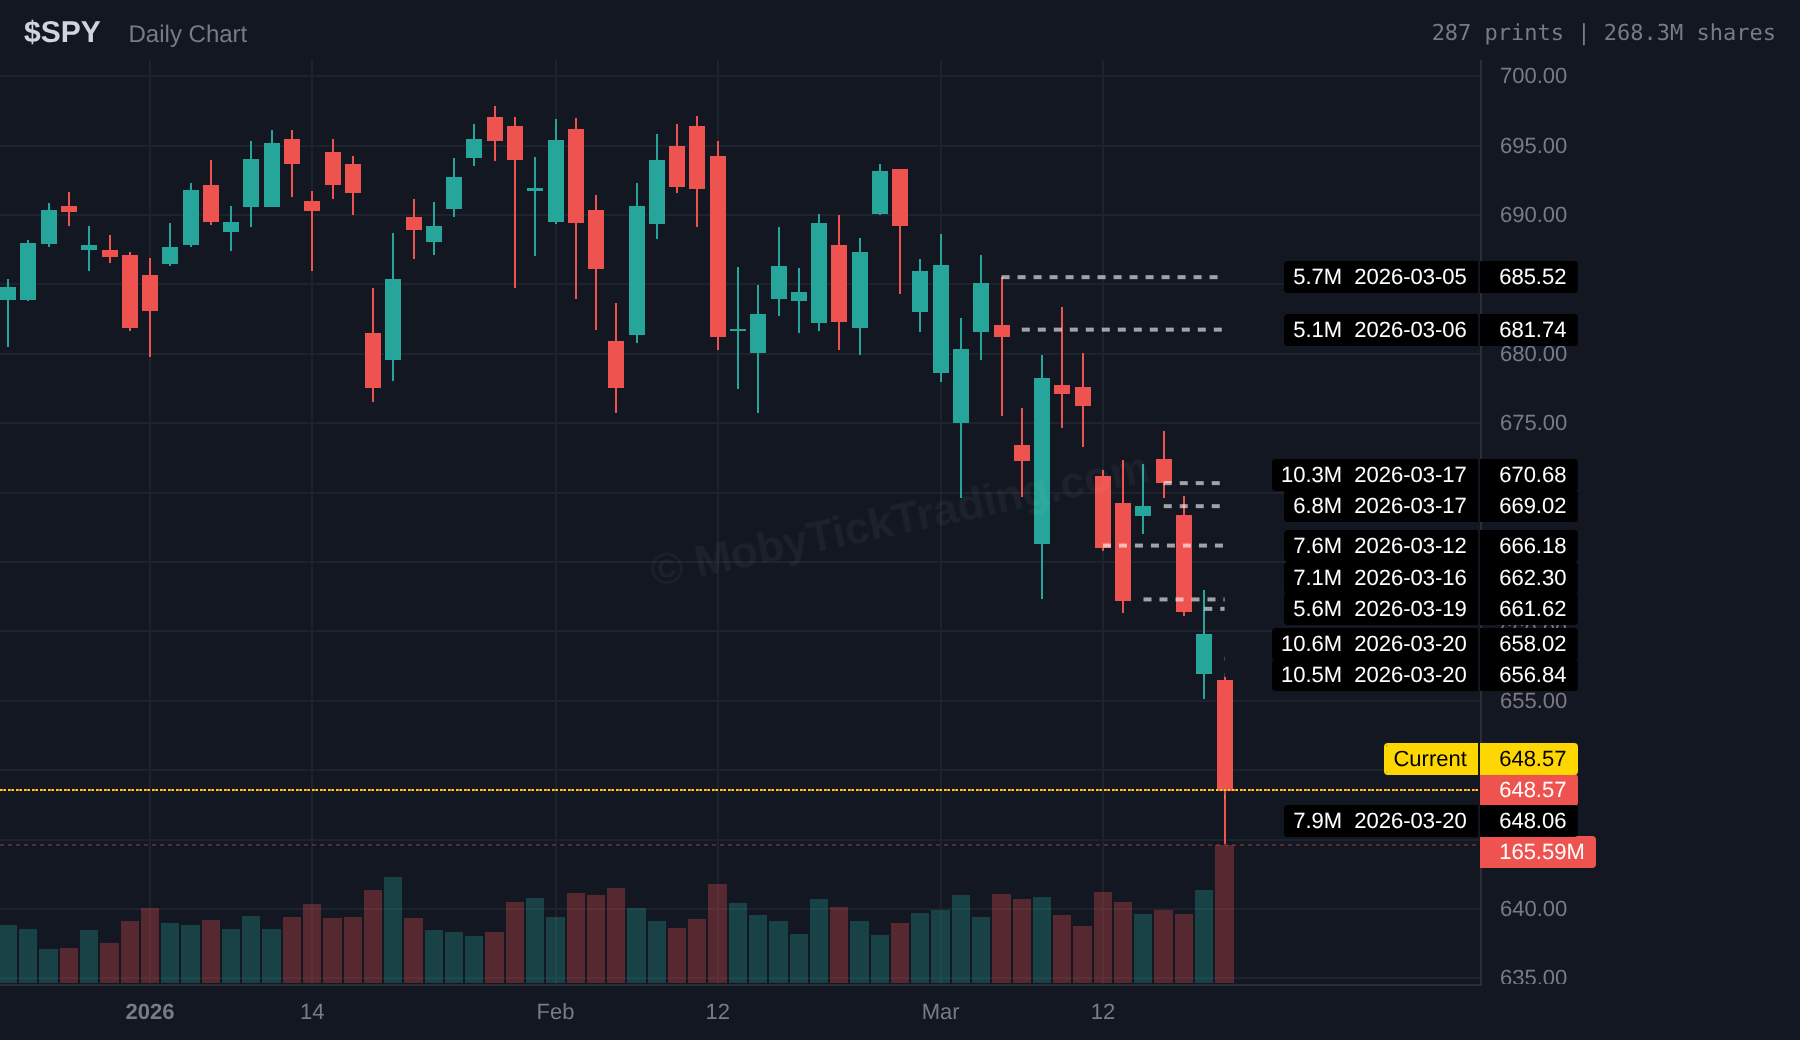
| SPY | $680 | No trigger | $670 | T5 – all targets to $657.50 |
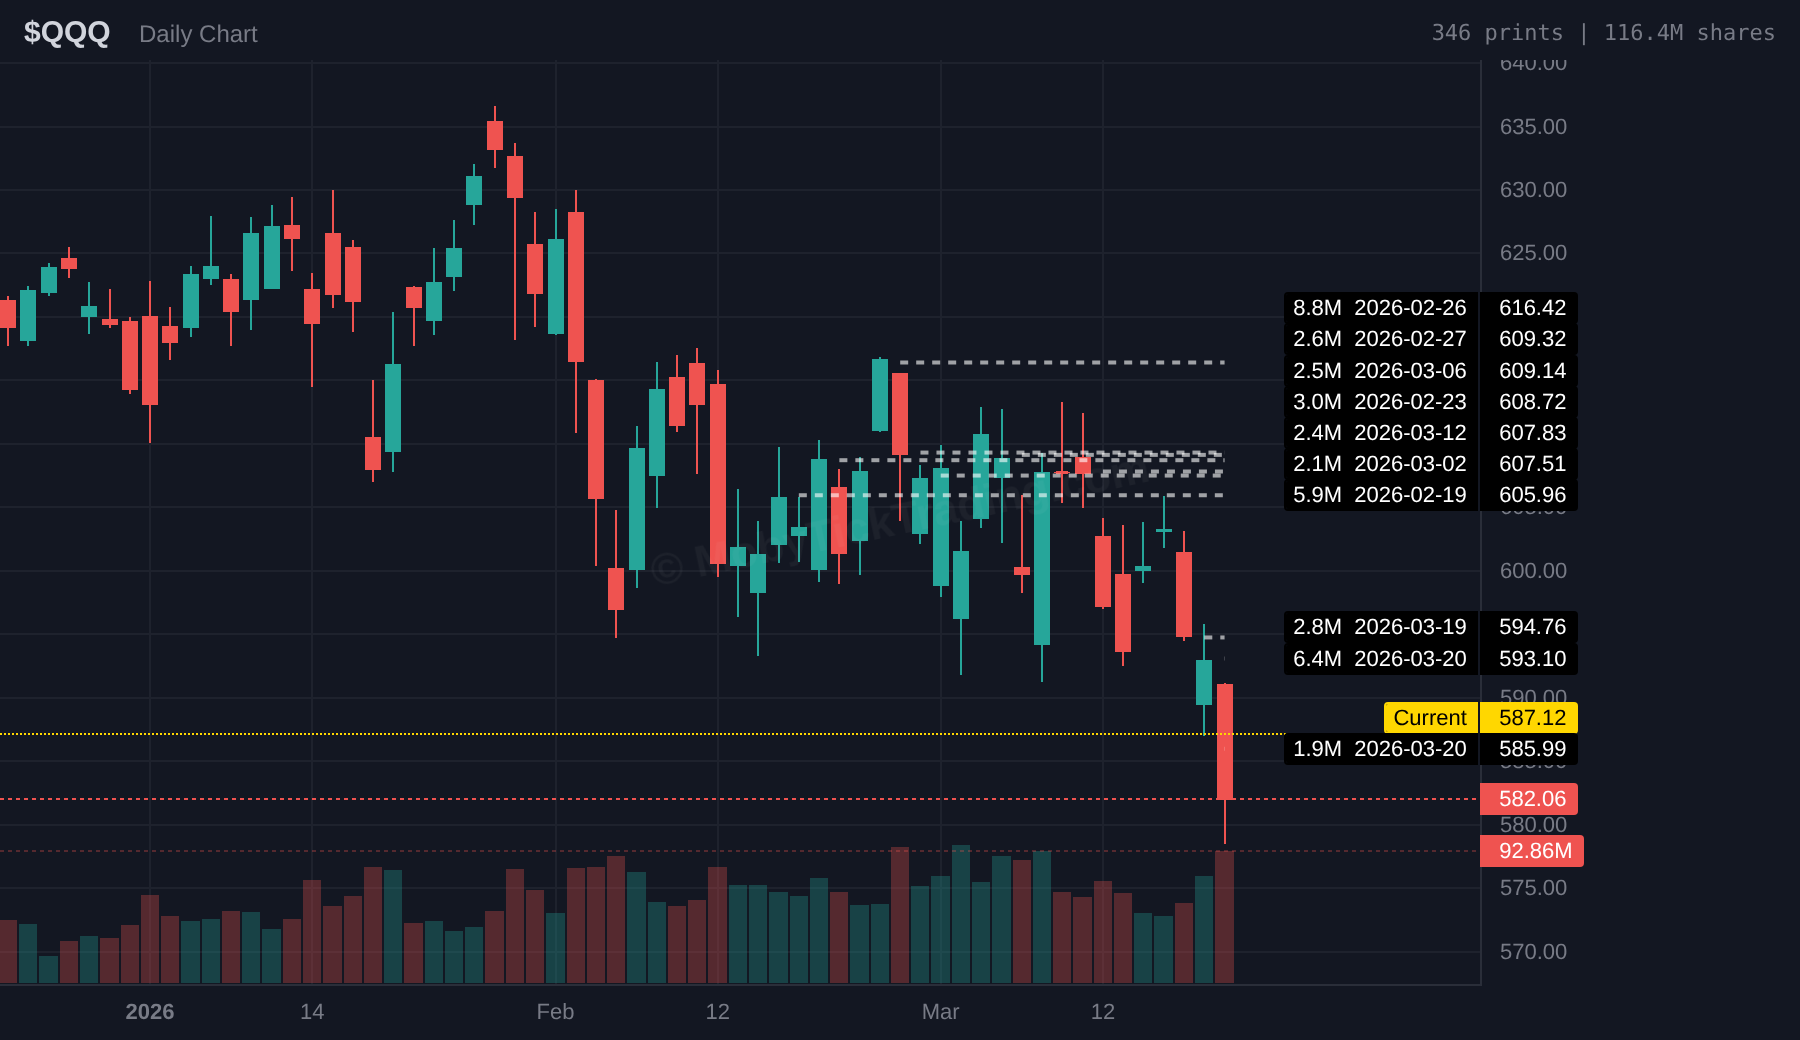
| QQQ | $610 | No trigger | $597.50 | T5 – all targets to $585 |
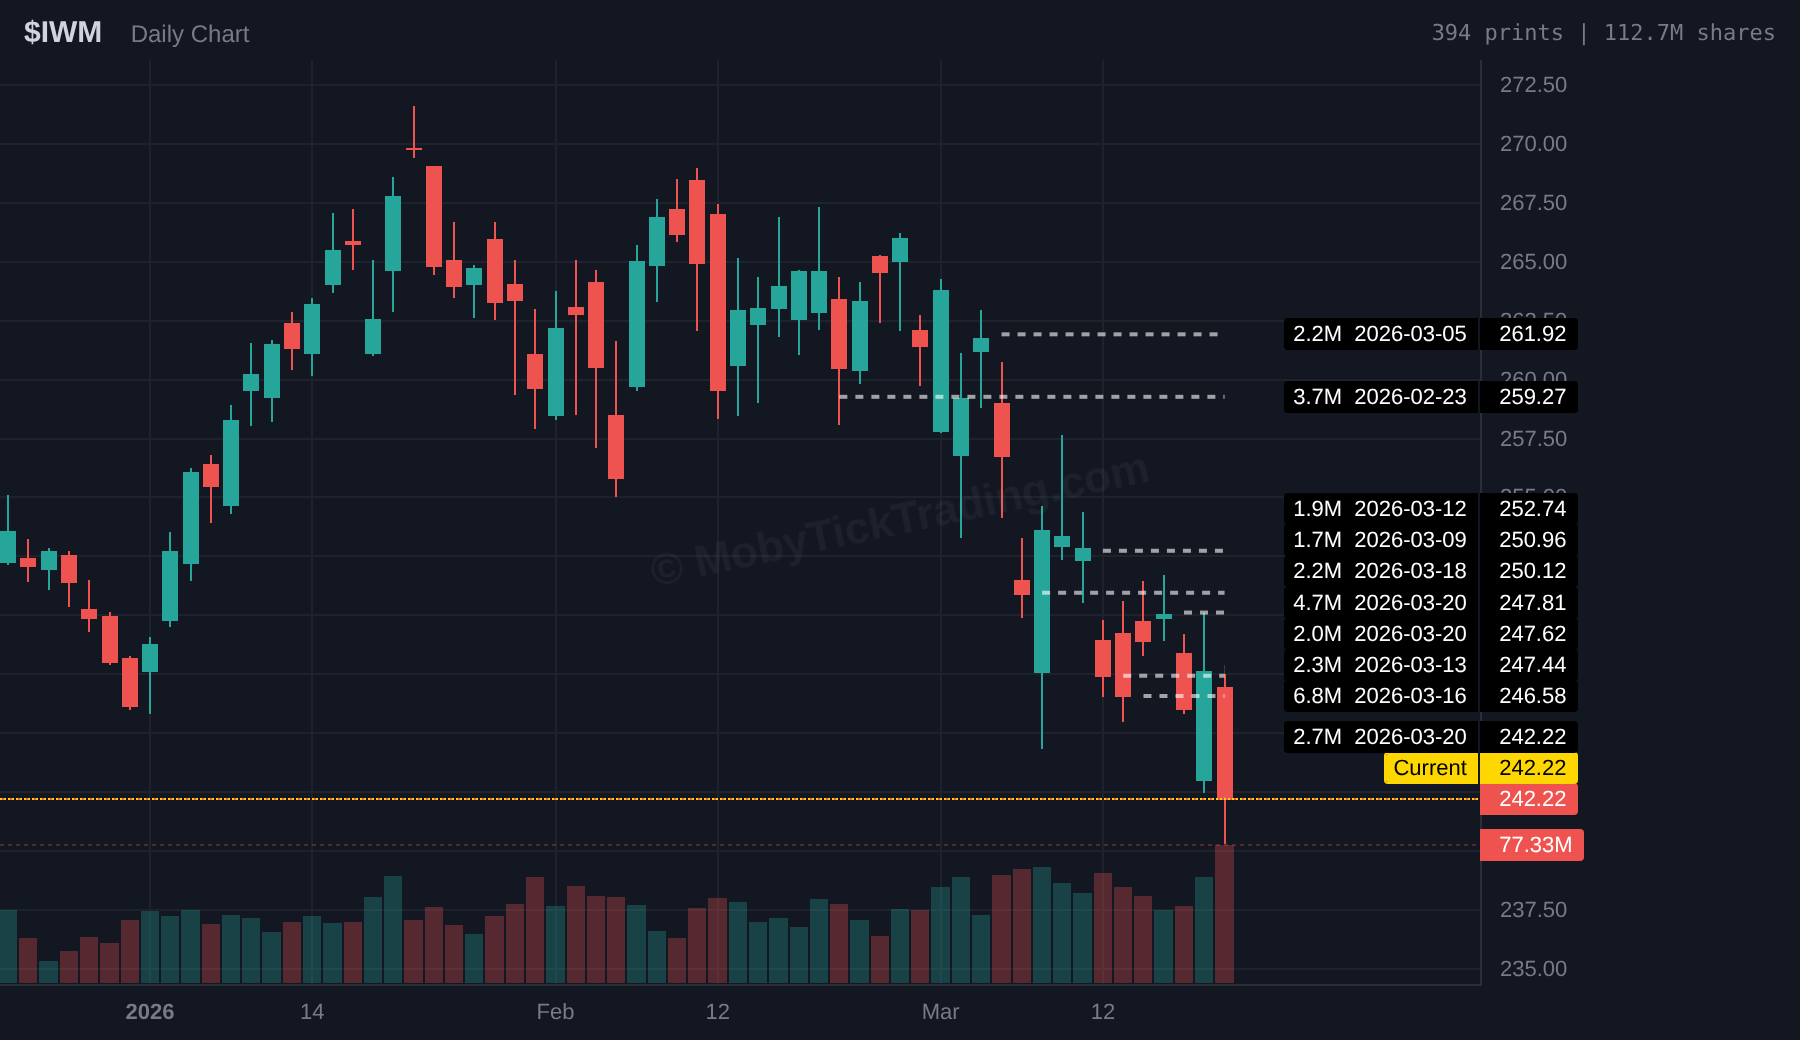
| IWM | $255 | No trigger | $250 | T4 – hit to $242 |
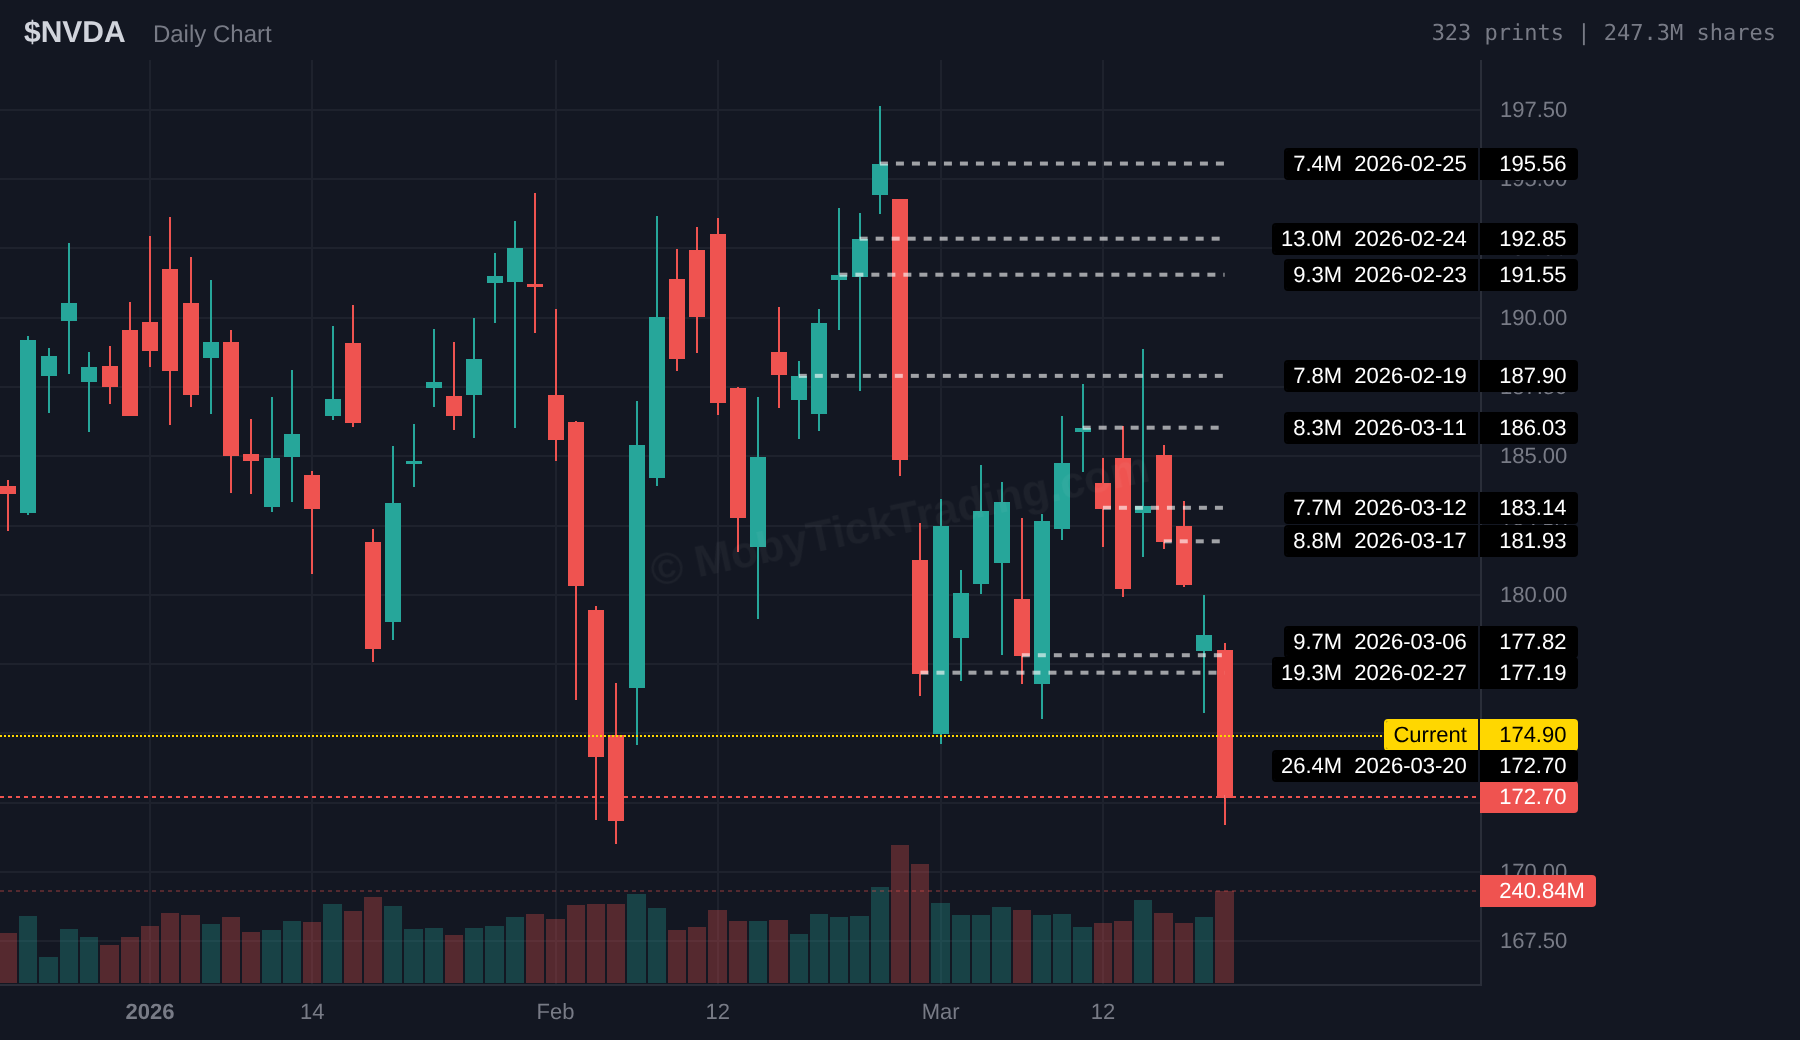
| NVDA | $180 | T5 – hit $187.50 | $177 | T2 – hit to $173 |
| RTX | $215 | No trigger | $209 | T5 – all targets to $197.50 |
| WDAY | $154 | No trigger | $140 | T4 – hit to $130 |
| NOW | $125 | No trigger | $114 | T2 – hit to $110 |
| PANW | $167.50 | T1 – hit $170 | $160 | No trigger |
| DDOG | $127.50 | T2 – hit $132.50 | $120 | No trigger |
| CRM | $201.25 | Triggered | $189 | No trigger |
| IOT | $36 | No trigger | $33 | T1 – hit $32 |
| PINS | $20.50 | No trigger | $18.50 | Triggered |
| ORCL | $160 | No trigger | $140 | No trigger |
HIGHLIGHT: NVDA was the only double trigger.
S&P 500 fell 1.5% Friday, fourth straight losing week.
| Ticker | Price | Trigger | T1 | T2 | T3 | T4 | T5 | T6 |
|---|---|---|---|---|---|---|---|---|
| SPY | $648.57 | $662.50 | $664 | $667.50 | $669 | $672.50 | $675 | |
| QQQ | $587.12 | $595 | $597.50 | $600 | $602.50 | $605 | $607.50 | $610 |
| IWM | $242.22 | $251.25 | $255 | $256.25 | $257.50 | $260 | $262.50 | $265 |
| NVDA | $174.90 | $180 | $181.25 | $182.50 | $185 | $187.50 | $190 | |
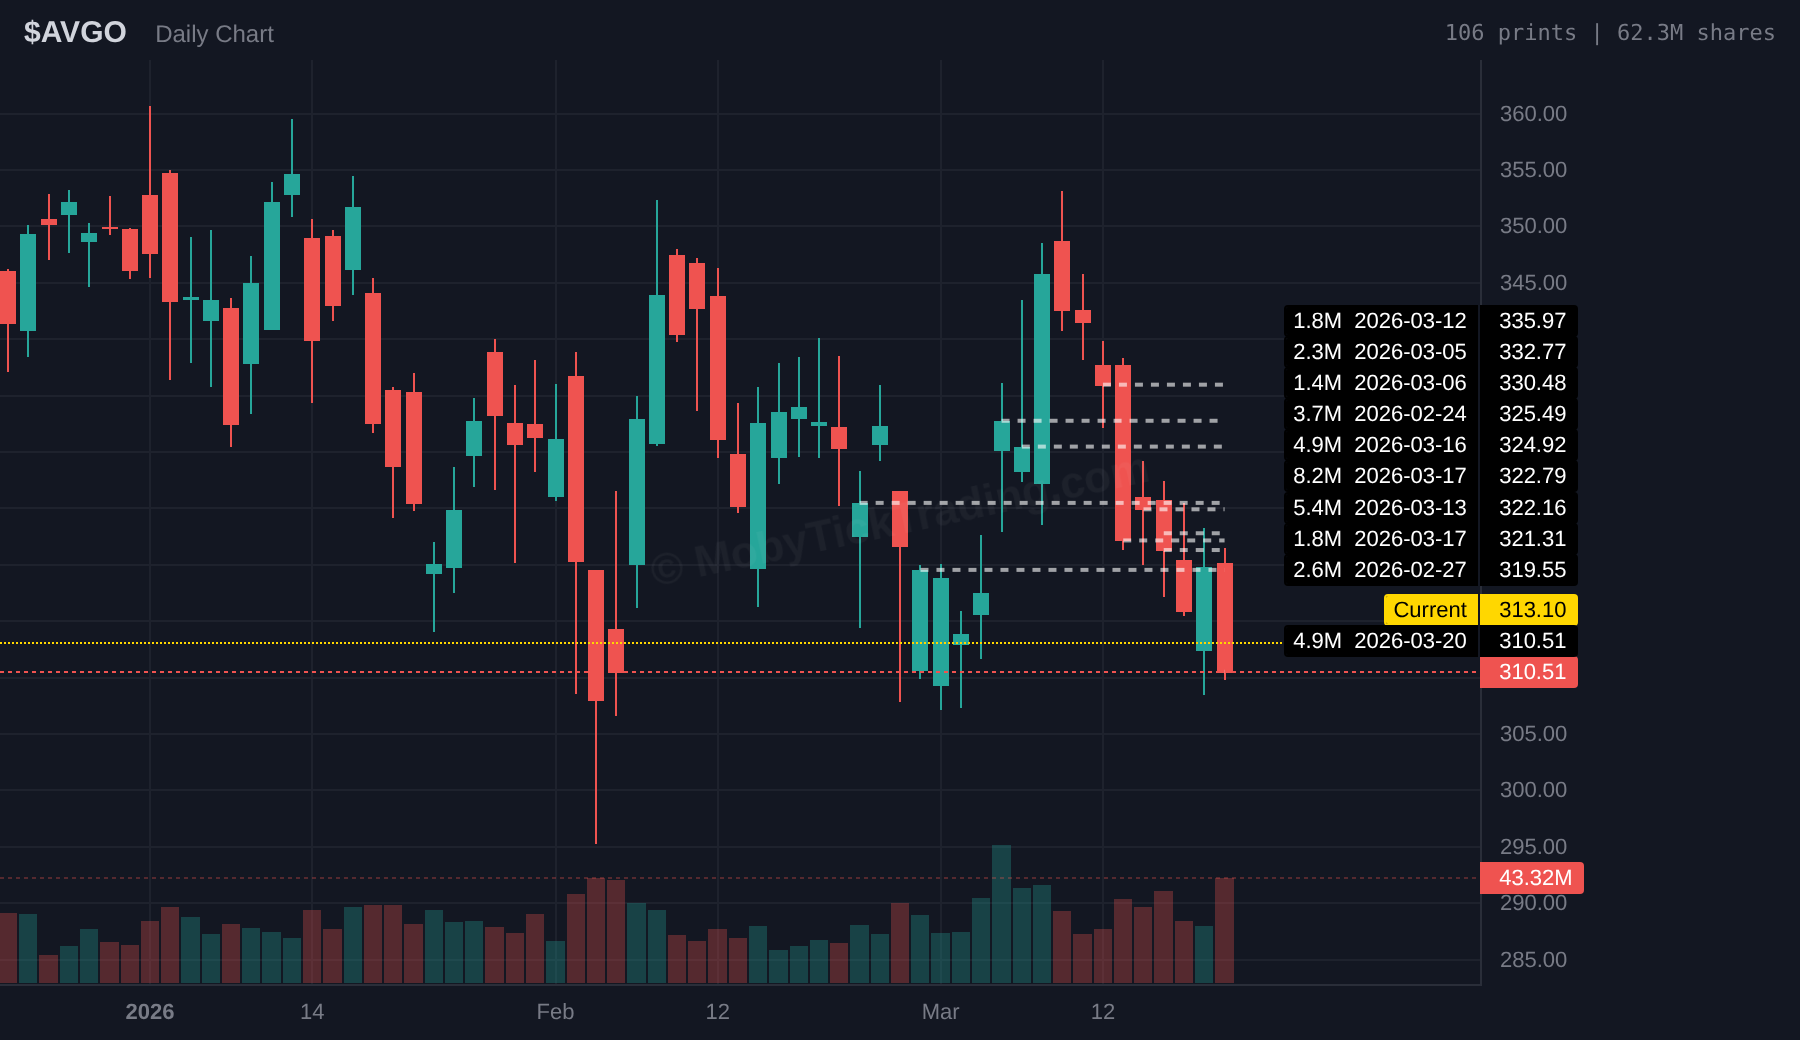
| AVGO | $313.10 | $325 | $330 | $335 | $340 | $347 | $350 | $360 |
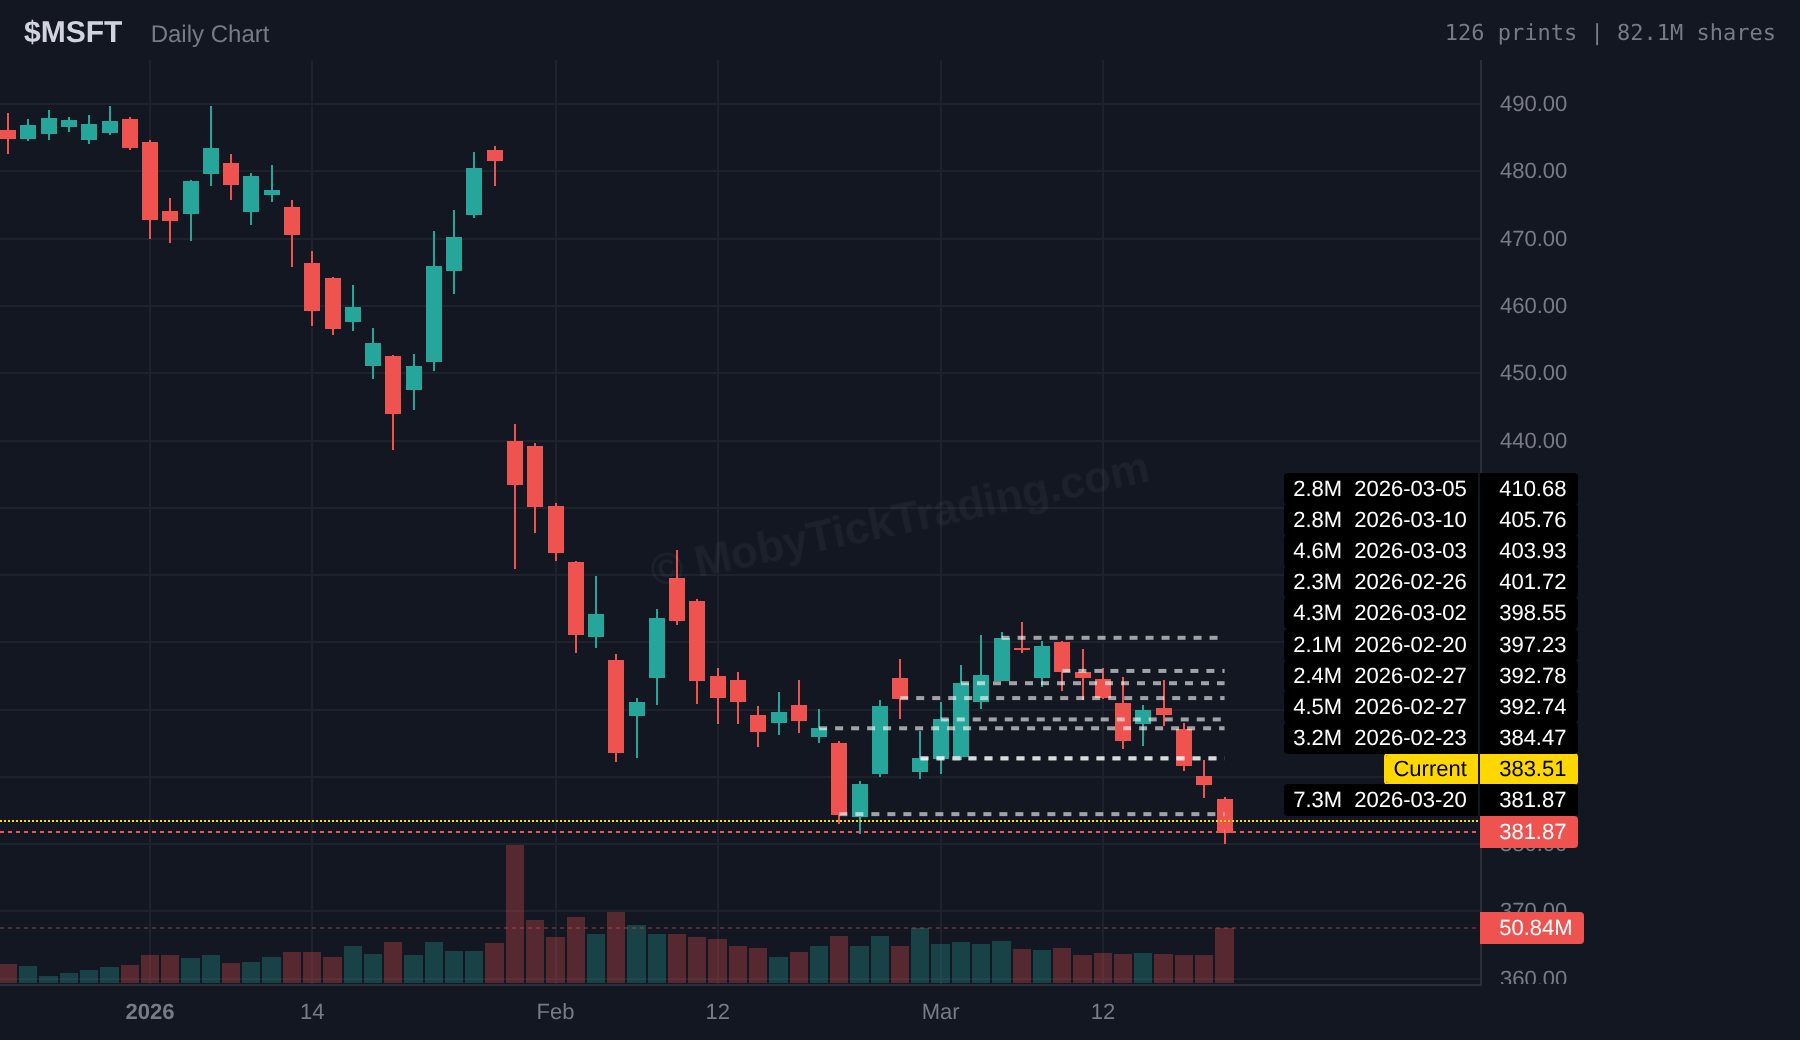
| MSFT | $383.51 | $390 | $392.50 | $395 | $396.75 | $400 | $405 | $410 |
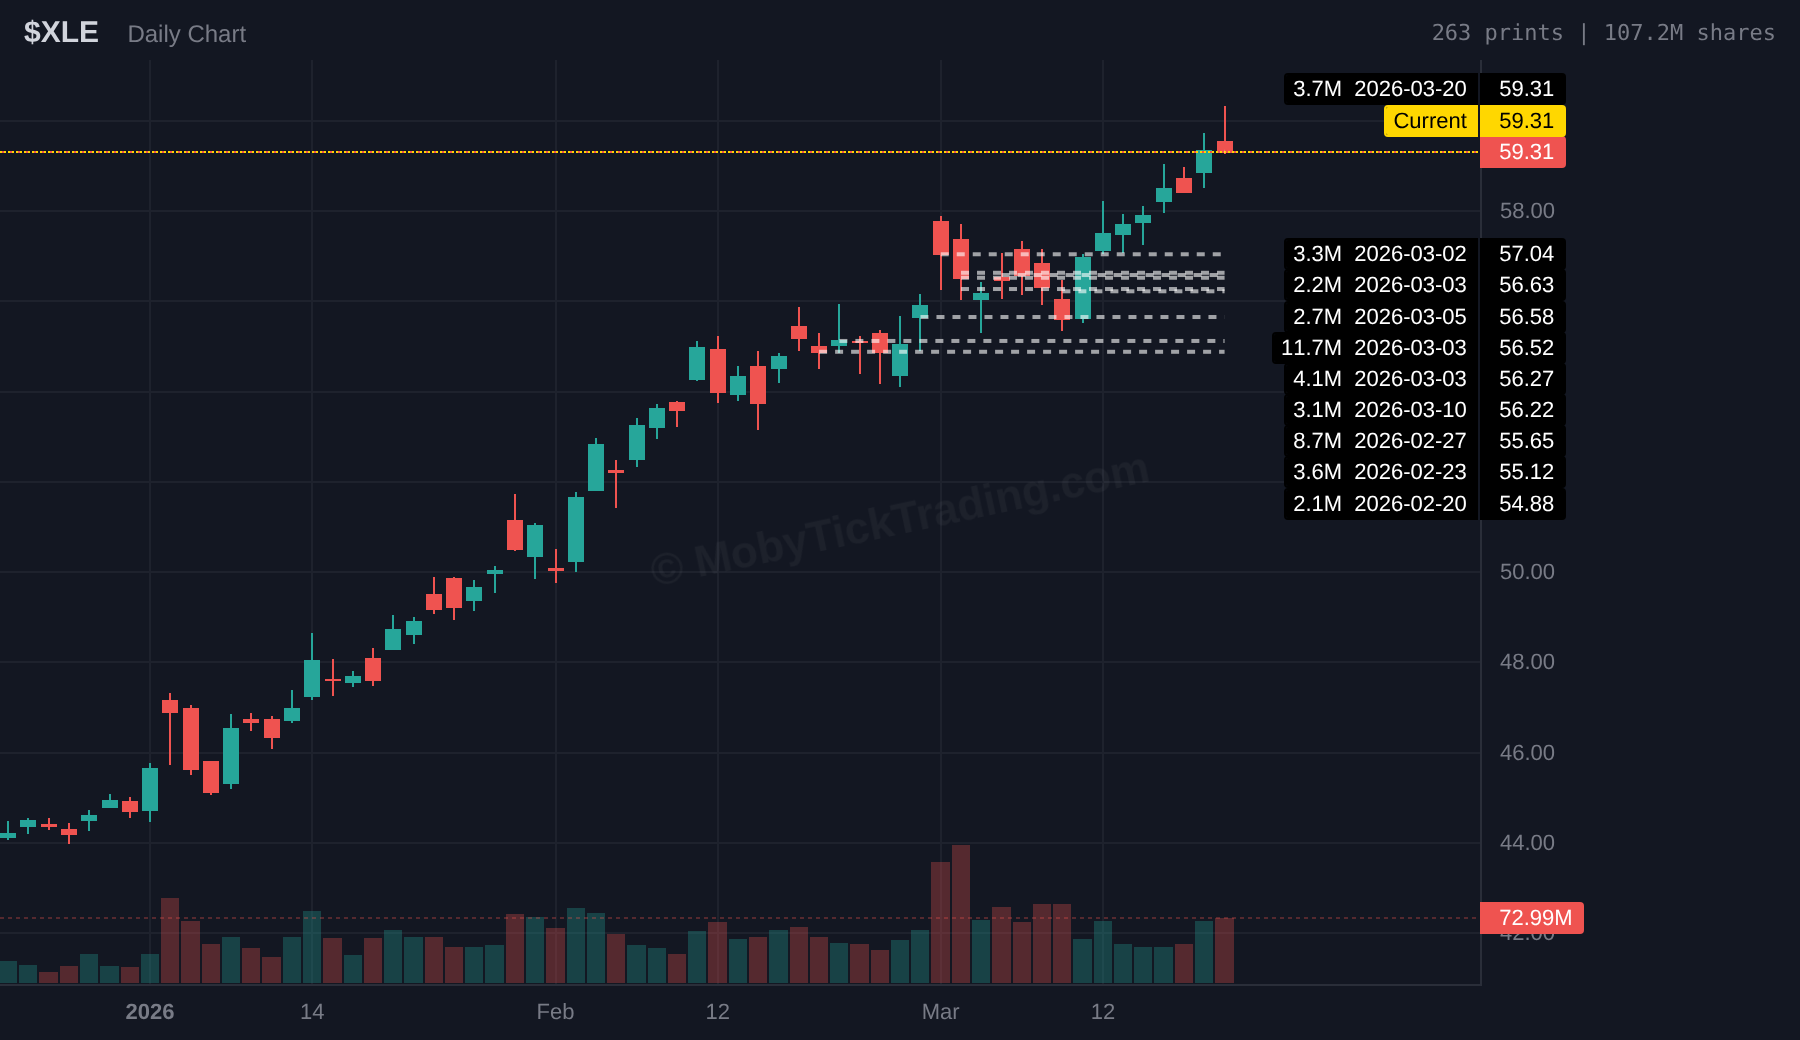
| XLE | $59.31 | $60.50 | $61.25 | $62.50 | $65 | $67.50 | $68.25 | |
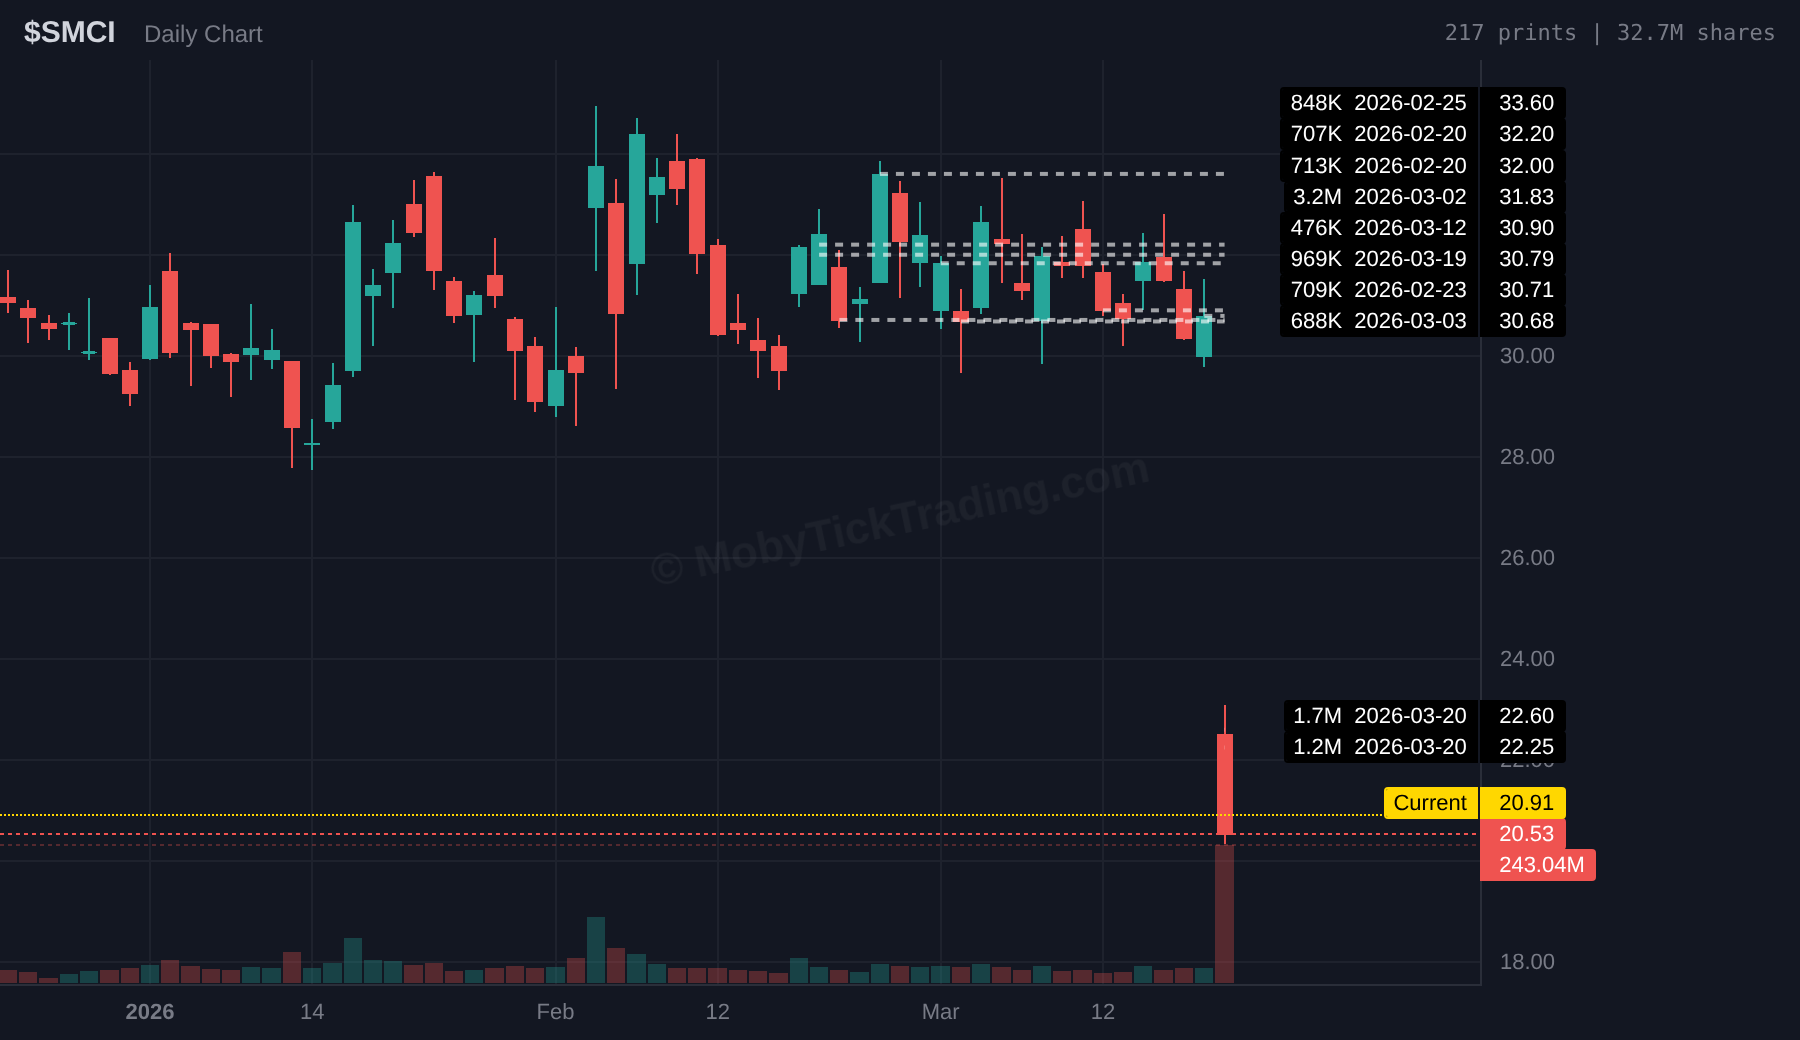
| SMCI | $20.91 | $24 | $25 | $26 | $27 | $28 | $29 | $30 |
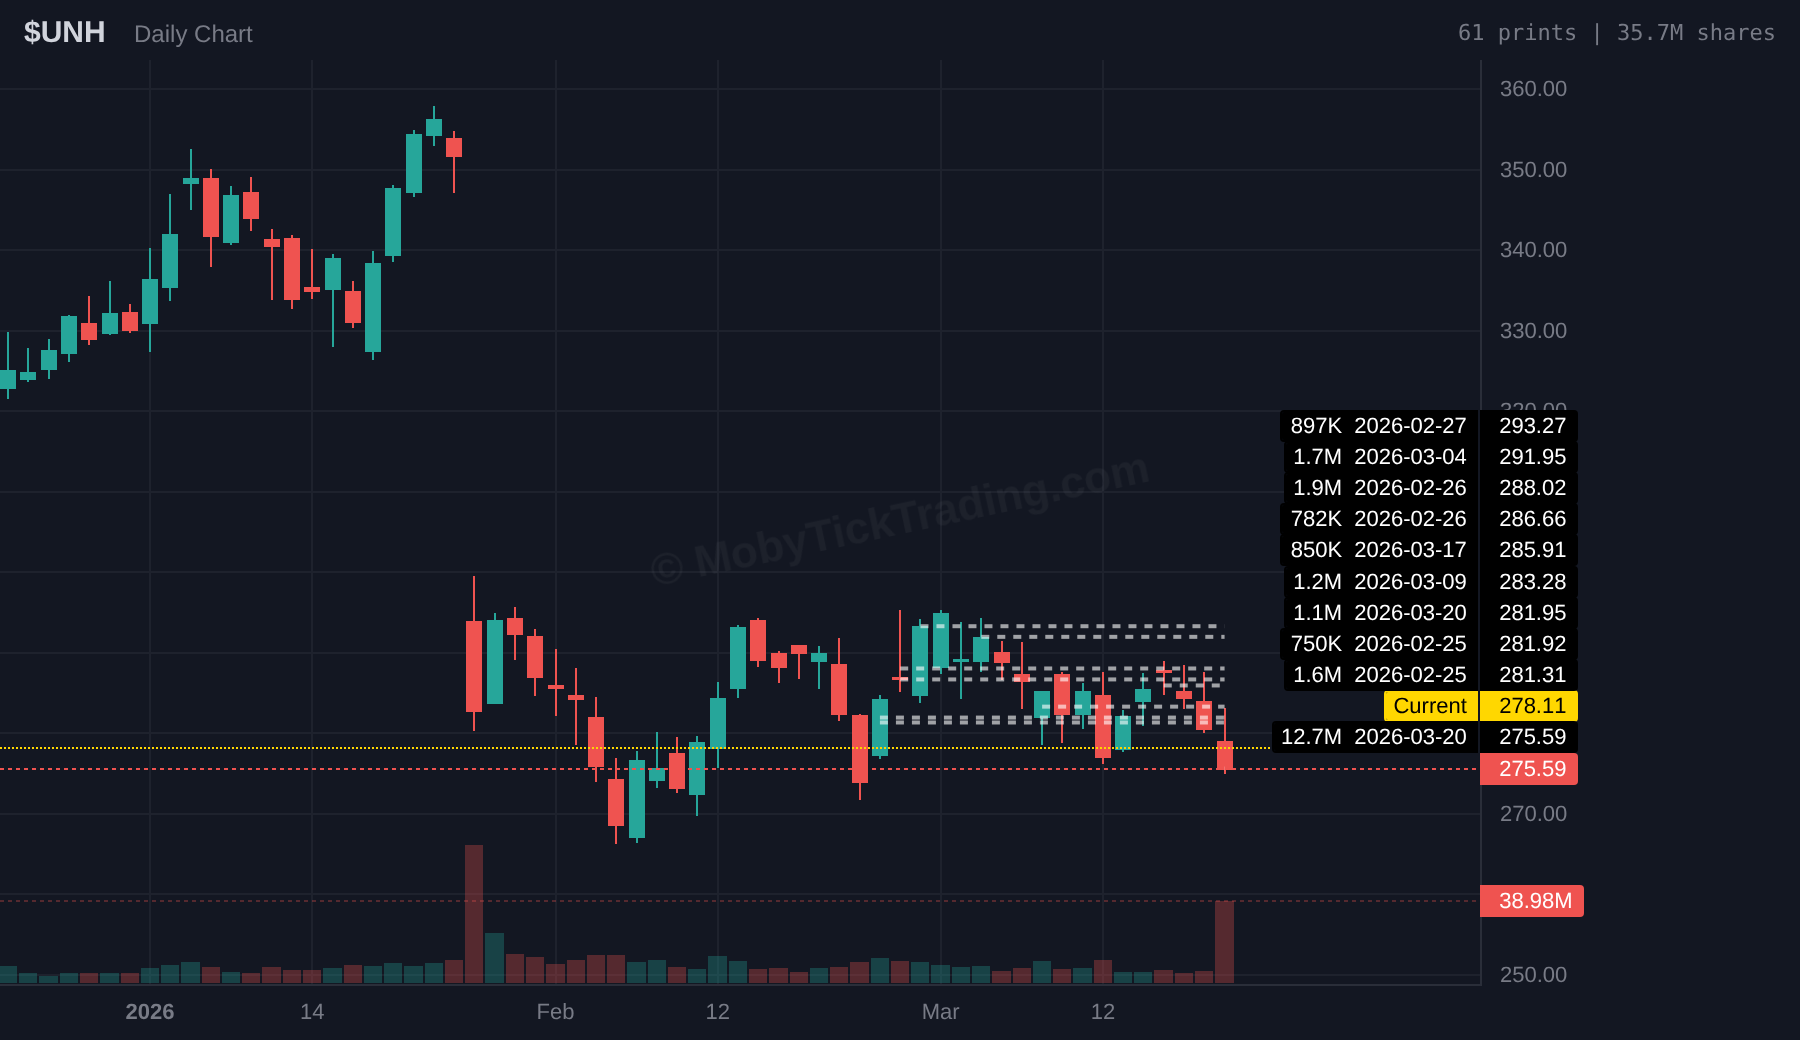
| UNH | $278.11 | $290 | $292.50 | $295 | $297.50 | $300 | $302.50 | $305 |
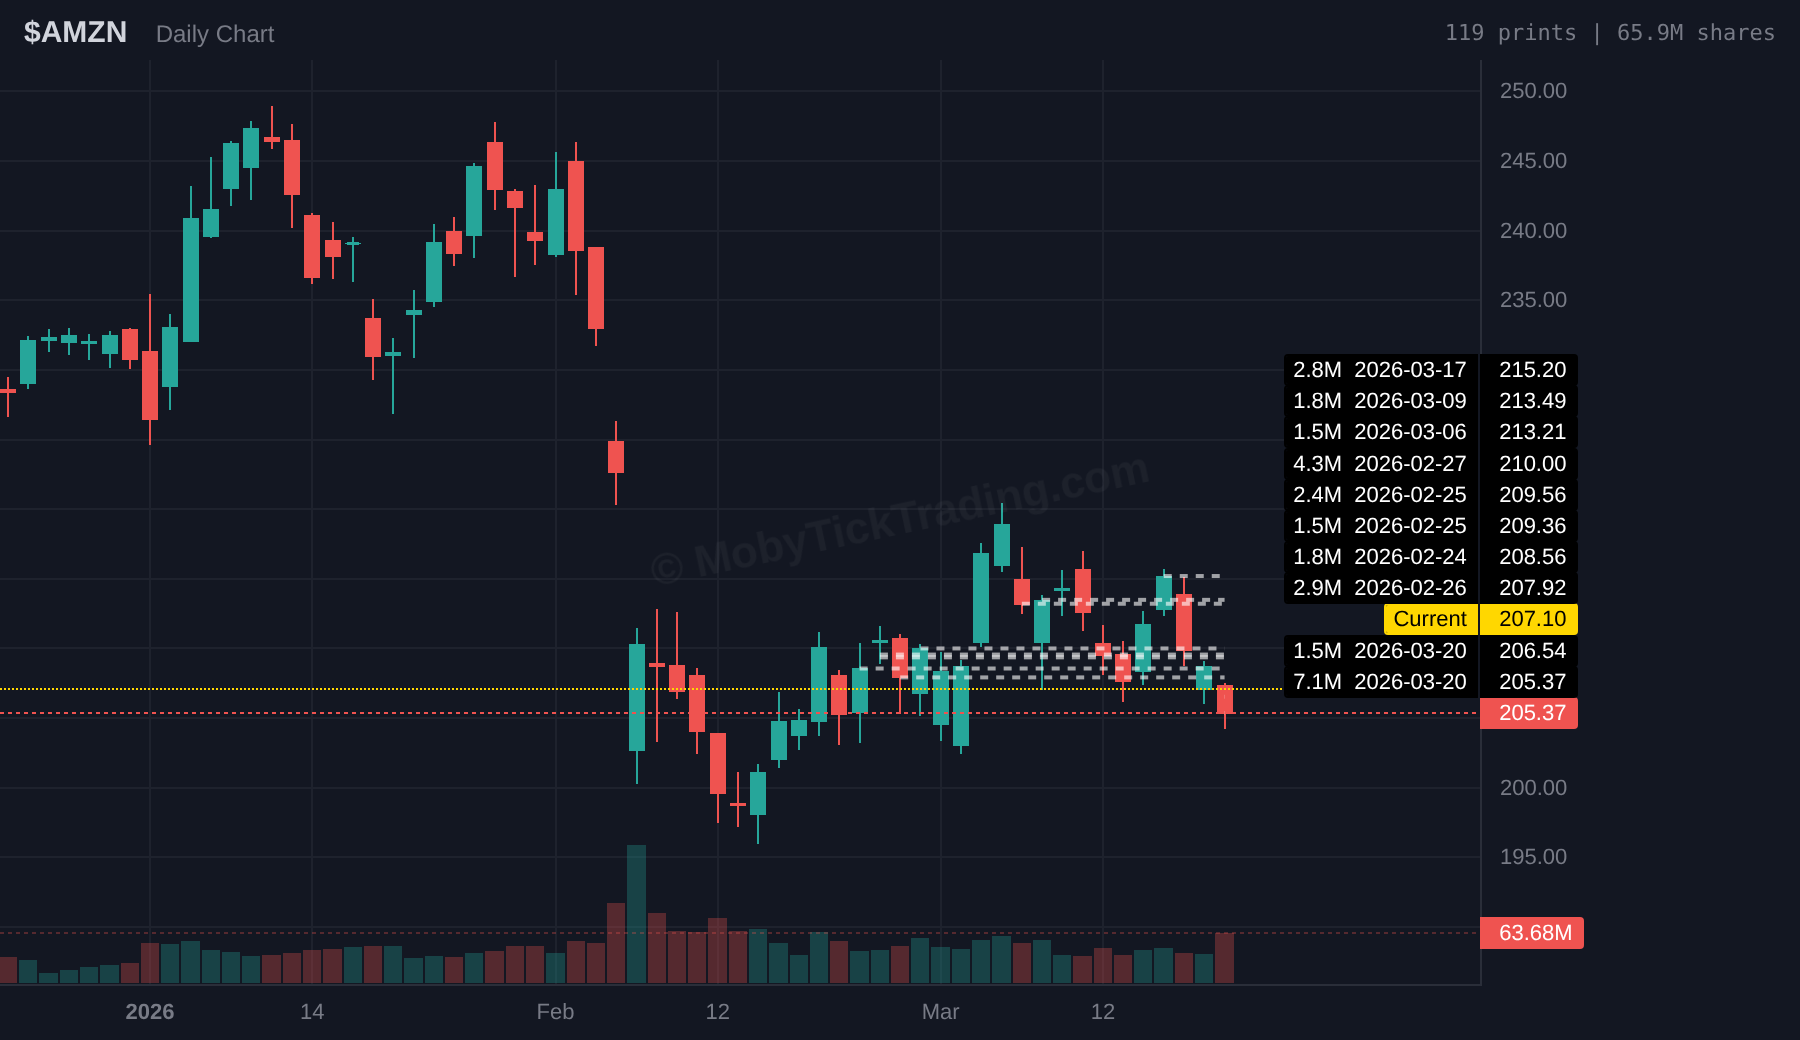
| AMZN | $207.10 | $210 | $212.50 | $213.25 | $215 | $217.50 | $220 | |
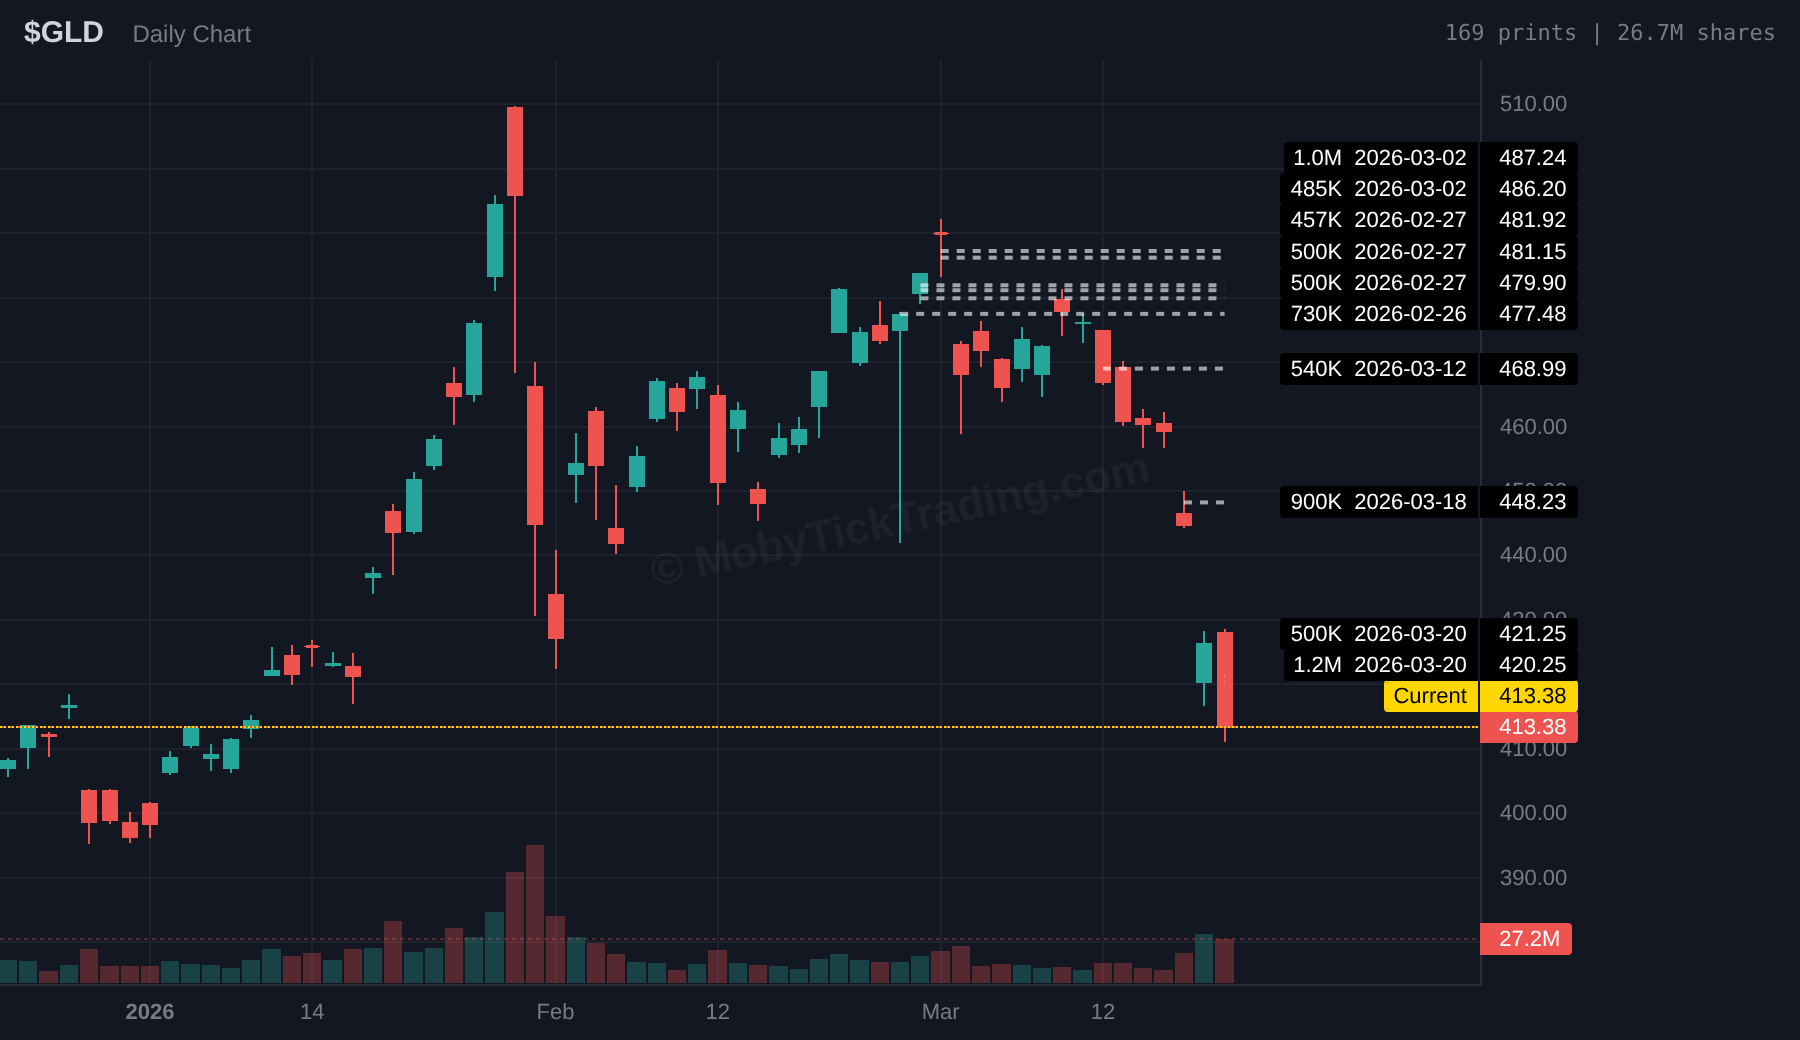
| GLD | $413.38 | $428 | $430 | $435 | $440 | $445 | $450 | $458.75 |
| Ticker | Price | Trigger | T1 | T2 | T3 | T4 | T5 | T6 |
|---|---|---|---|---|---|---|---|---|
| SPY | $648.57 | $642.50 | $640 | $635 | $632.50 | $630 | $620 | $612.50 |
| QQQ | $587.12 | $578.50 | $575 | $572.50 | $570 | $565 | $560 | $550 |
| IWM | $242.22 | $240 | $235 | $232.50 | $230 | $225 | $220 | |
| NVDA | $174.90 | $170 | $167.50 | $165 | $162.50 | $160 | $155.50 | $150 |
| AVGO | $313.10 | $307.50 | $300 | $295 | $285 | $275 | ||
| MSFT | $383.51 | $380 | $377.50 | $375 | $370 | $365 | $360 | |
| XLE | $59.31 | $58 | $57.50 | $57 | $56 | |||
| SMCI | $20.91 | $20 | $19 | $18 | $17 | $16 | $15 | $12.50 |
| UNH | $278.11 | $275 | $272.50 | $270 | $265 | $260 | $250 | |
| AMZN | $207.10 | $205 | $202.50 | $200 | $197.50 | $195 | $190 | |
| GLD | $413.38 | $411 | $407.50 | $402.50 | $400 | $392.50 | $387.50 | $380 |
All data verified against closing prices.
44.6M shares | $29.3B | 36 prints | Inst Avg $657.46
▲ Bullish above $662.50 → $664, $667.50, $669, $672.50, $675
▼ Bearish below $642.50 → $640, $635, $632.50, $630, $620, $612.50
16.8M shares | $9.9B | 42 prints | Inst Avg $591.87
▲ Bullish above $595 → $597.50, $600, $602.50, $605, $607.50, $610
▼ Bearish below $578.50 → $575, $572.50, $570, $565, $560, $550
29.4M shares | $7.3B | 66 prints | Inst Avg $246.65
▲ Bullish above $251.25 → $255, $256.25, $257.50, $260, $262.50, $265
▼ Bearish below $240 → $235, $232.50, $230, $225, $220
15.2M shares | $2.7B | 48 prints | Inst Avg $178.56
▲ Bullish above $180 → $181.25, $182.50, $185, $187.50, $190
▼ Bearish below $170 → $167.50, $165, $162.50, $160, $155.50, $150
10.8M shares | $3.5B | 13 prints | Inst Avg $321.60
▲ Bullish above $325 → $330, $335, $340, $347, $350, $360
▼ Bearish below $307.50 → $300, $295, $285, $275
2.9M shares | $1.1B | 10 prints | Inst Avg $387.36
▲ Bullish above $390 → $392.50, $395, $396.75, $400, $405, $410
▼ Bearish below $380 → $377.50, $375, $370, $365, $360
6.4M shares | $383M | 10 prints | Inst Avg $59.70
▲ Bullish above $60.50 → $61.25, $62.50, $65, $67.50, $68.25
▼ Bearish below $58 → $57.50, $57, $56
3.2M shares | $76M | 3 prints | Inst Avg $23.39
▲ Bullish above $24 → $25, $26, $27, $28, $29, $30
▼ Bearish below $20 → $19, $18, $17, $16, $15, $12.50
3.6M shares | $1.0B | 11 prints | Inst Avg $282.20
▲ Bullish above $290 → $292.50, $295, $297.50, $300, $302.50, $305
▼ Bearish below $275 → $272.50, $270, $265, $260, $250
7.3M shares | $1.5B | 18 prints | Inst Avg $208.12
▲ Bullish above $210 → $212.50, $213.25, $215, $217.50, $220
▼ Bearish below $205 → $202.50, $200, $197.50, $195, $190
6.0M shares | $2.6B | 25 prints | Inst Avg $430.45
▲ Bullish above $428 → $430, $435, $440, $445, $450, $458.75
▼ Bearish below $411 → $407.50, $402.50, $400, $392.50, $387.50, $380
36 prints | 44.6M shares | $29.3B | Bullish above $662.50 | Bearish below $642.50
10 prints | 6.4M shares | $383M | Bullish above $60.50 | Bearish below $58.00
One of two sectors positive Friday. Historical prints at $55-57 including 11.56M at $56.52 Mar 3.
48 prints | 15.2M shares | $2.7B | Bullish above $180.00 | Bearish below $170.00
Only double trigger last week. Largest: 2.21M at $178.26 Friday.
3 prints | 3.2M shares | $76M | Bullish above $24.00 | Bearish below $20.00
Co-founder charged with smuggling $2.5B Nvidia chips to China. Prints collapsed from $30-33 to $22.
Late prints are trades that legally can be reported up to 24 hours late. We track these separately in Moby due to how important they are. They show where institutions are truly positioning.
Friday’s late prints (reported from Thursday) totaled 10.5 million shares at $658.02, valued at $7 billion.
Tracking these as lines in the sand is paramount. Late prints exist on SPY, QQQ, IWM, and DIA.
How do we know when the selloff is done? It is when we see massive prints at the bottom and we close above them.
This report is for educational purposes only. Not financial advice. All trading involves risk.