Physical Address
304 North Cardinal St.
Dorchester Center, MA 02124
Physical Address
304 North Cardinal St.
Dorchester Center, MA 02124
The Best Dark Pool Scanner in 2026: How to Track Institutional Flow Like a Pro
Dark pools account for approximately 30-40% of all U.S. equity trading volume. A dark pool scanner captures that hidden activity and puts it in front of you. Here’s how to find the best one, what features matter, and how to use institutional flow data in your trading.
A dark pool scanner is a software tool that captures, filters, and displays trades executed on Alternative Trading Systems (ATS) — private venues where large institutions execute orders away from public exchanges.
These platforms let institutions trade large blocks without immediately revealing their intentions. The trades are eventually reported to FINRA — but without a scanner, you’re manually parsing thousands of rows of regulatory data. A good scanner turns that into actionable institutional flow tracking.
Speed matters. The most valuable dark pool alerts reach you while the information is still actionable. Look for:
A scanner showing every dark pool trade is useless. The best dark pool scanner lets you narrow the signal:
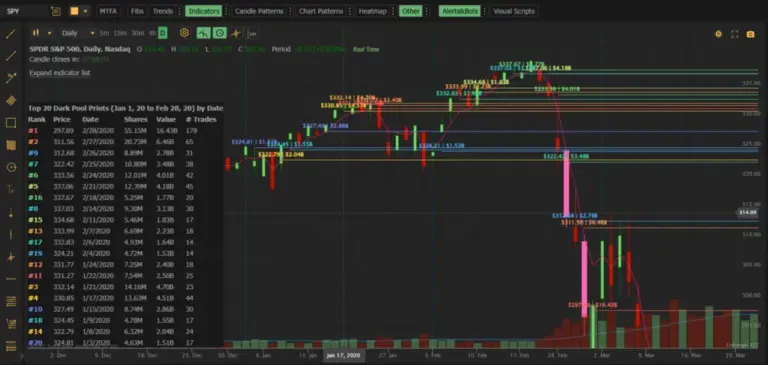
One dark pool print is interesting. A pattern of prints at the same price level is a signal. Historical dark pool data reveals:
A 2 million share print means different things in SPY versus a mid-cap stock. The best dark pool scanner provides context:
The best data doesn’t help if you can’t find what you need. Look for:
Here’s actual dark pool data from MobyTick’s scanning system for the period of March 16-24, 2026 — showing the largest verified institutional prints:
| Ticker | Shares | Price | Dollar Value | Date |
|---|---|---|---|---|
| NVDA | 26,400,000 | $172.70 | $4.55 billion | March 20 |
| SPY | 10,600,000 | $658.02 | $6.96 billion | March 20 |
| AAPL | 15,800,000 | $251.64 | $3.98 billion | March 24 |
| MSFT | 7,300,000 | $381.87 | $2.77 billion | March 20 |
| AVGO | 8,200,000 | $322.79 | $2.64 billion | March 17 |
| MU | 4,500,000 | $422.90 | $1.92 billion | March 20 |
| AMZN | 7,100,000 | $205.37 | $1.45 billion | March 20 |
| JPM | 3,900,000 | $286.56 | $1.12 billion | March 20 |
These figures represent individual dark pool prints — verified through the MobyTick API. Each one is a concrete data point: at what price, on what date, an institution committed that level of capital. A $4.55 billion NVDA print on March 20 tells you exactly where institutional money was positioned during that period of market weakness.
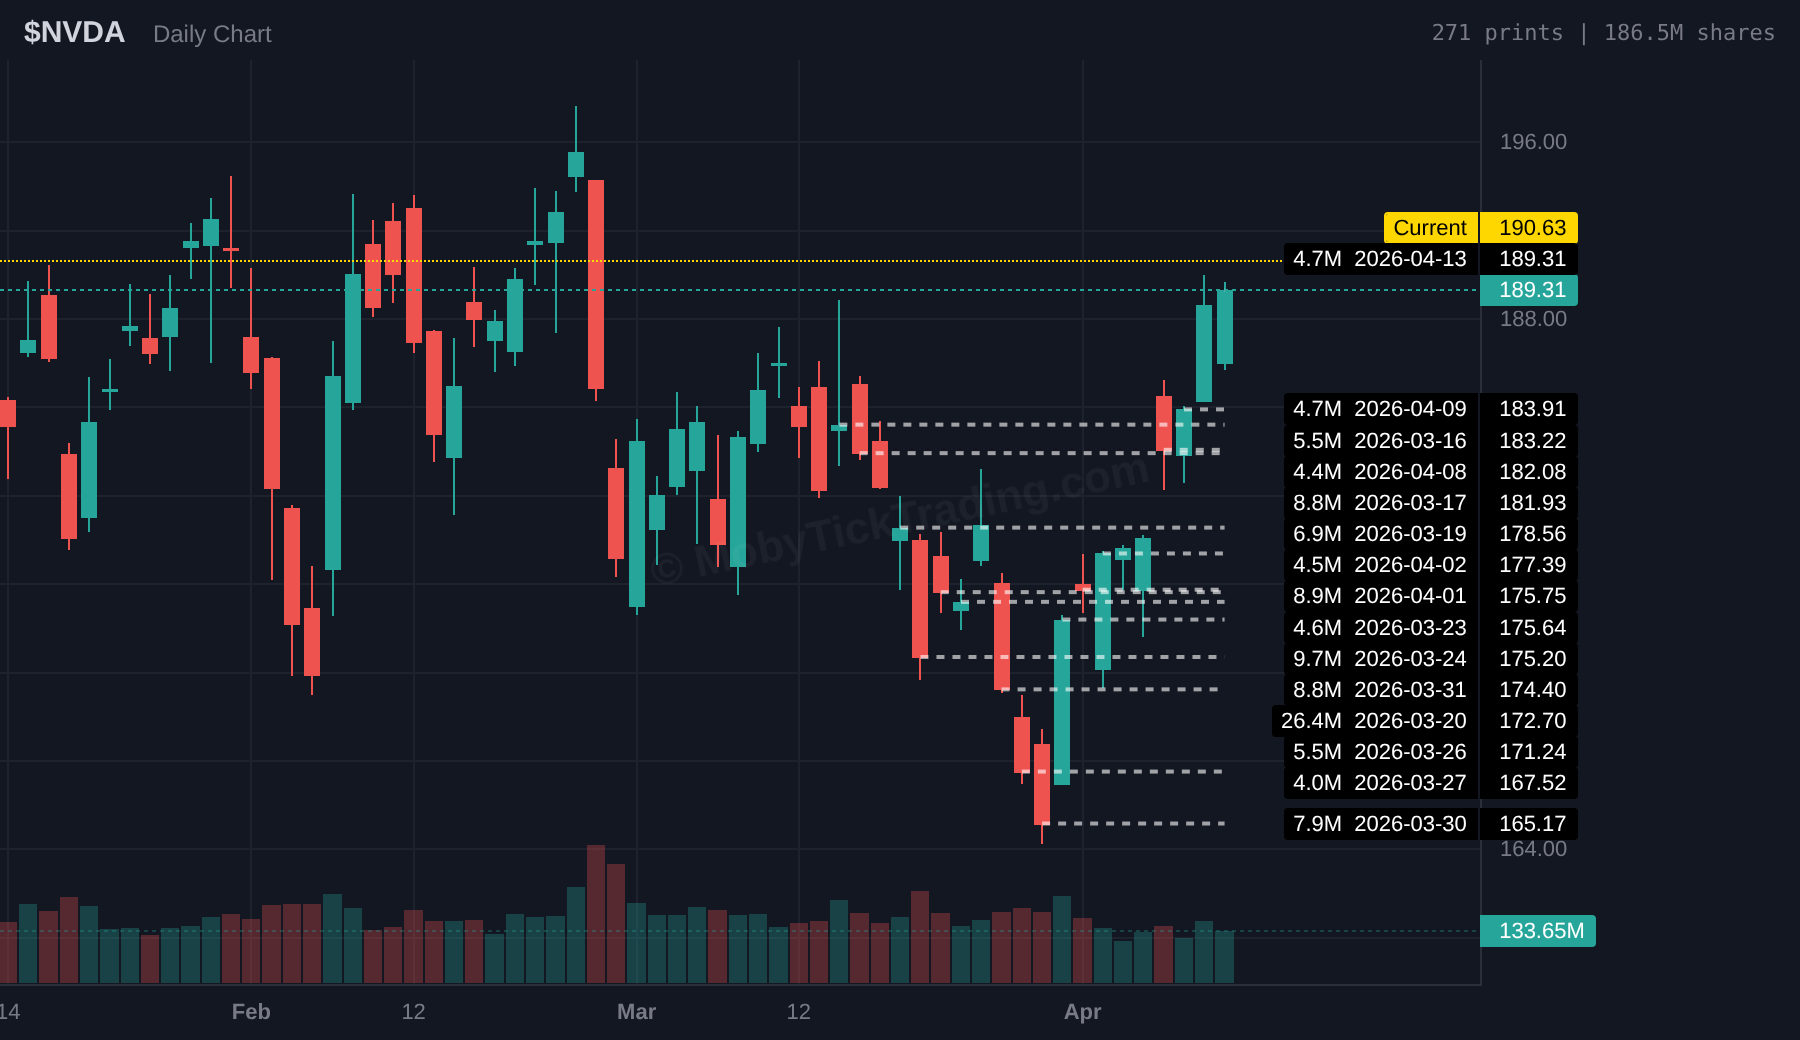
The foundation of any scanner is its data pipeline. Ask:
Some scanners focus on a handful of popular stocks. The best dark pool scanner covers the full market. MobyTick tracks 10,000+ stocks with 6+ years of historical data — more coverage than any competitor at any price point.
Dark pool data tools range from free (limited, delayed data) to $150+/month for premium platforms. Consider what’s included in each tier, and look for free trials so you can validate the data before committing.
MobyTick was built to bring institutional-grade dark pool data to retail traders:
1. Check yesterday’s top prints — scan the largest dark pool prints in your watchlist
2. Identify key price levels — note where large prints clustered, these become reference zones
3. Set today’s watchlist — flag securities showing unusual dark pool volume over the past week
1. Monitor real-time alerts — let the scanner notify you when criteria are met
2. Cross-reference dark pool levels with current market structure
3. Track accumulation patterns — are institutions repeatedly hitting the same price levels?
1. Review all prints — look at the full day’s activity for your watchlist
2. Update your levels — add new dark pool price levels to your charts
3. Note patterns — which securities showed repeated institutional activity?
Not every tool labeled a dark pool scanner is built for the same job. Some are dark-pool-first, others are options-flow-first platforms that include dark pool data as one feature, and a few are broad market-intelligence dashboards. Here is how the main options break down by workflow.
Moby Tick’s clearest strength is focus: it is built around dark pool and block trade intelligence rather than bolting it onto a broader platform. If your main question is where institutions have been active, which price levels matter historically, and how activity clusters in a ticker over time, a specialized tool is usually easier to work with than a platform where dark pool data is one tab among many. It pairs with a free discovery surface at darkpoolheatmap.com.
Cheddar Flow positions around options order flow with dark pool data included. If your process starts with unusual options activity and you want dark pool context in the same environment, this is the category fit. It is less specialized for deep historical dark-pool level research.
Unusual Whales is a broader market-data platform covering options flow, dark pool data, stock activity, news, and congressional-trading tracking. If you want one place for many categories of market data and value breadth over specialization, it is a compelling choice — at the cost of a noisier, less dark-pool-centered workflow.
FlowAlgo is commonly mentioned alongside Moby Tick, Cheddar Flow, and Unusual Whales in the flow-data category. It belongs on the shortlist for anyone shopping broadly, but verify current feature and pricing details directly before weighing it against more specialized options.
If you want to explore dark pool activity without friction before committing to a paid workflow, darkpoolheatmap.com is the natural first stop. It surfaces sector and ticker-level activity for free and is a good bridge into a deeper Moby Tick workflow.
Choose a dark-pool-first platform if you care about institutional prints as a primary research input and want historical context by ticker. Choose an options-flow-first platform if your process starts with unusual options activity. Choose a broad market-intelligence platform if you want many categories of data in one place. Start with a free discovery tool if you are still learning how dark pool activity fits your workflow.
Are dark pool scans legal?
Yes. Dark pool trades are legal and regulated. All dark pool trades must eventually be reported to FINRA and included in consolidated tape data.
How quickly are dark pool reports available?
Under current FINRA rules, dark pool trades must be reported within 10 seconds of execution. MobyTick’s system processes and delivers these prints in near real-time.
Can retail traders use dark pool data effectively?
Absolutely. The data is publicly reported — the edge comes from knowing what to look for and how to contextualize it.
What’s the minimum dark pool print size to track?
For large-cap stocks and major ETFs, prints under 100,000 shares are often routine order flow. Prints of 500,000+ shares typically indicate institutional participation. Volume ratio (print size vs. ADV) is more meaningful than absolute size.
Ready to start scanning dark pool activity? Visit MobyTick Trading — institutional-grade dark pool data starting at $19.99/month. Track 10,000+ stocks with 6+ years of historical data and real-time alerts.