Physical Address
304 North Cardinal St.
Dorchester Center, MA 02124
Physical Address
304 North Cardinal St.
Dorchester Center, MA 02124

MobyTick's Weekly Dark Pool Report for June 8–12, 2026 with scorecard results, SPY/QQQ/NVDA institutional levels, dark pool flow highlights, and this week's setup tables.
The S&P 500’s nine-week winning streak ended in dramatic fashion Friday, with a jobs report shock triggering a broad selloff. The Nasdaq suffered its worst single-day drop since April 2025.
Catalyst 1: Non-Farm Payrolls came in at 172K versus 80K expected, forcing a sharp repricing in rate expectations.
Catalyst 2: The 10-year Treasury yield jumped from 4.47% to 4.54% while DXY surged from 99.16 to 100.06.
Catalyst 3: Broadcom did not raise its AI outlook, adding pressure across the semiconductor complex. MU fell 13.9% Friday, NVDA 6.7%, INTC 13.3%, and AVGO 8.1%.
Strong payroll data, a sharp move in yields, a stronger dollar, and semiconductor weakness combined to break the market’s nine-week streak. For next week’s setups, the key question is whether price stabilizes around the published levels or extends the same volatility that defined the June 1–5 tape.
| Ticker | Above | Below | Wk High | Wk Low | Wk Close | Result |
|---|---|---|---|---|---|---|
| SPY | $758.00 | $745.00 | $761.38 | $736.50 | $737.55 | 🔄 Both — Above +1T, Below +3T |
| QQQ | $742.50 | $729.00 | $746.25 | $705.83 | $705.06 | 🔄 Both — Above +1T, Below +6T |
| IWM | $293.00 | $285 | $292.61 | $277.98 | $281.65 | 🔴 Below — +2 targets |
| NVDA | $218 | $210 | $228.02 | $197.87 | $205.10 | 🔄 Both — Above +4T, Below +4T |
| AAPL | $315 | $305 | $315.20 | $306.25 | $307.34 | 🟢 Above — +0 targets |
| MSFT | $452.50 | $412.5 | $461.30 | $417.46 | $416.67 | 🟢 Above — +3 targets |
| DELL | $430 | $415 | $458.58 | $421.24 | $394.39 | 🟢 Above — +4 targets |
| IBM | $300 | $250 | $329.23 | $284.00 | $284.84 | 🟢 Above — +5 targets |
| F | $18 | $14.5 | $17.18 | $14.73 | $14.90 | ⚪ No trigger |
| INTC | $130 | $108 | $114.06 | $100.29 | $99.17 | 🔴 Below — +2 targets |
| MU | $985 | $887.5 | $1081.27 | $875.30 | $864.01 | 🔄 Both — Above +4T, Below +0T |
| IONQ | $72.50 | $62.50 | $71.40 | $60.50 | $56.78 | 🔴 Below — +0 targets |
| GOOGL | $392.50 | $380 | $376.37 | $358.70 | $368.53 | 🔴 Below — +4 targets |
Primary levels and first targets.
| Ticker | Above | T1 | T2 | T3 | T4 | T5 | T6 | T7 |
|---|---|---|---|---|---|---|---|---|
| SPY | $760.00 | $762.50 | $765.00 | $760.00 | $765.00 | $770.00 | — | — |
| QQQ | $747.50 | $750.00 | $755.00 | $760.00 | $765.00 | $770.00 | — | — |
| IWM | $293.00 | $295.00 | $297.50 | $300.00 | $302.50 | $305.00 | — | — |
| GOOGL | $390 | $395 | $400 | $405 | $410 | $415 | $420 | — |
| MU | $1100 | $1125 | $1150 | $1175 | $1200 | — | — | — |
| MSFT | $440 | $445 | $450 | $455 | $460 | $465 | $470 | — |
| UNH | $405 | $410 | $412.5 | $415 | $417.5 | $420 | $425 | $430 |
| META | $630 | $635 | $640 | $642.50 | $645 | $650 | $660 | — |
| AVGO | $440 | $450 | $470 | $480 | $490 | $500 | — | — |
| WMT | $122.5 | $125 | $126.25 | $127.5 | $130 | — | — | — |
| BAC | $54.5 | $55 | $56.25 | $57.5 | $58.25 | $60 | — | — |
| AAPL | $317.5 | $320 | $322.5 | $325 | $327.5 | $330 | — | — |
| NVDA | $227.5 | $230 | $232.5 | $235 | $237.50 | $240 | — | — |
Primary levels and first targets.
| Ticker | Below | T1 | T2 | T3 | T4 | T5 | T6 | T7 |
|---|---|---|---|---|---|---|---|---|
| SPY | $735.00 | $732.50 | $730.00 | $720.00 | $715.00 | $711.27 | $705.00 | $702.50 |
| QQQ | $700.00 | $695.00 | $690.00 | $680.00 | $675.00 | $672.70 | $670.00 | $660.00 |
| IWM | $280.00 | $275.00 | $273.00 | $270.00 | $265.00 | $260.00 | $255.00 | $250.00 |
| GOOGL | $360 | $355 | $350 | $340 | $330 | $325 | $320 | — |
| MU | $850 | $825 | $800 | $790 | $775 | $750 | $725 | $700 |
| MSFT | $405 | $400 | $395 | $390 | $385 | $380 | $370 | $366 |
| UNH | $378 | $375 | $370 | $365 | $360 | $355 | $350 | — |
| META | $587.5 | $585 | $580 | $570 | $560 | $555 | — | — |
| AVGO | $380 | $370 | $360 | $355 | $350 | — | — | — |
| WMT | $113 | $110 | $107.5 | $105 | $102.5 | $100 | $97.5 | — |
| BAC | $50 | $48.75 | $47.50 | $47 | $45 | $42.50 | — | — |
| AAPL | $305 | $302.5 | $300 | $297.5 | $295 | $292.50 | $290 | — |
| NVDA | $202.5 | $200 | $198 | $195 | $190 | $186.25 | $180 | $170 |
Dark pool flow: $14.15B across 18.97M shares and 19 prints. Average reported print price: $746.07.
Weekly range: $761.38 – $736.50 | Friday close: $737.55 (-2.58%) | Status: BETWEEN triggers
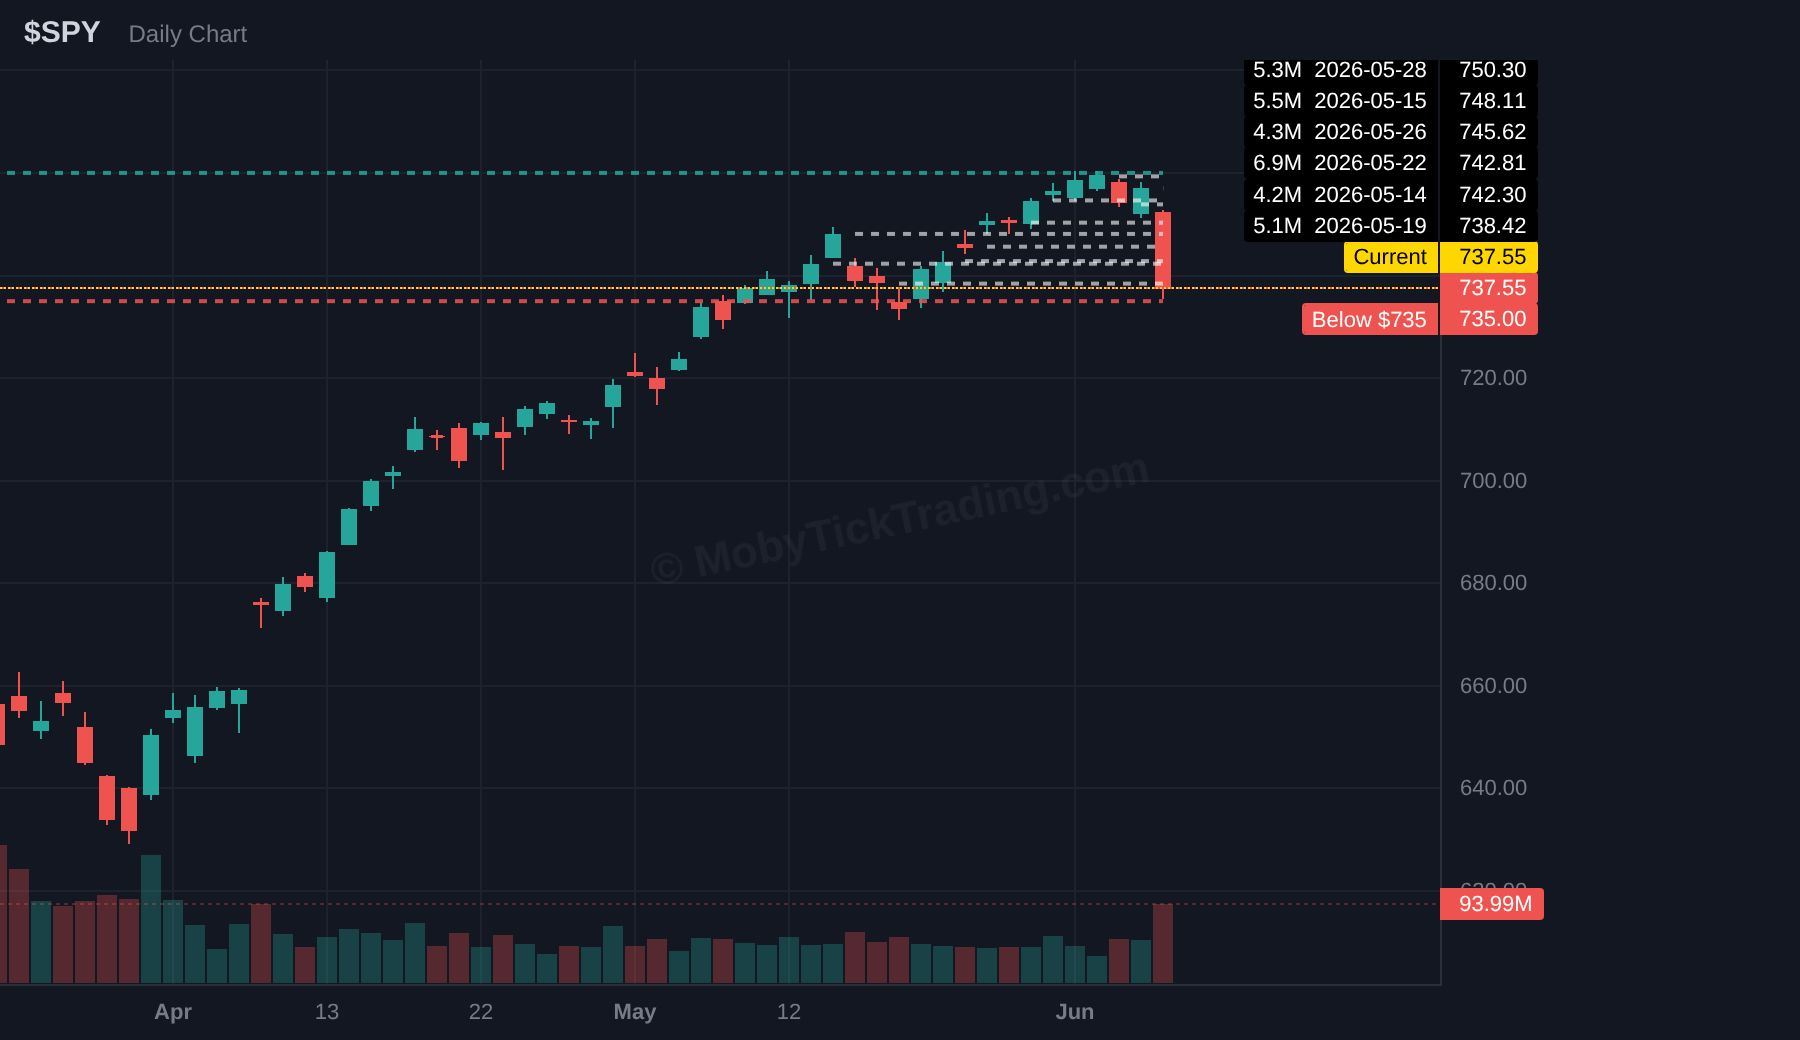
Above $760.00 | Targets: $762.50, $765.00, $760.00, $765.00, $770.00
Below $735.00 | Targets: $732.50, $730.00, $720.00, $715.00, $711.27, $705.00, $702.50
Dark pool flow: $6.16B across 8.46M shares and 7 prints. Average reported print price: $728.31.
Weekly range: $746.25 – $705.83 | Friday close: $705.06 (-5.44%) | Status: BETWEEN triggers
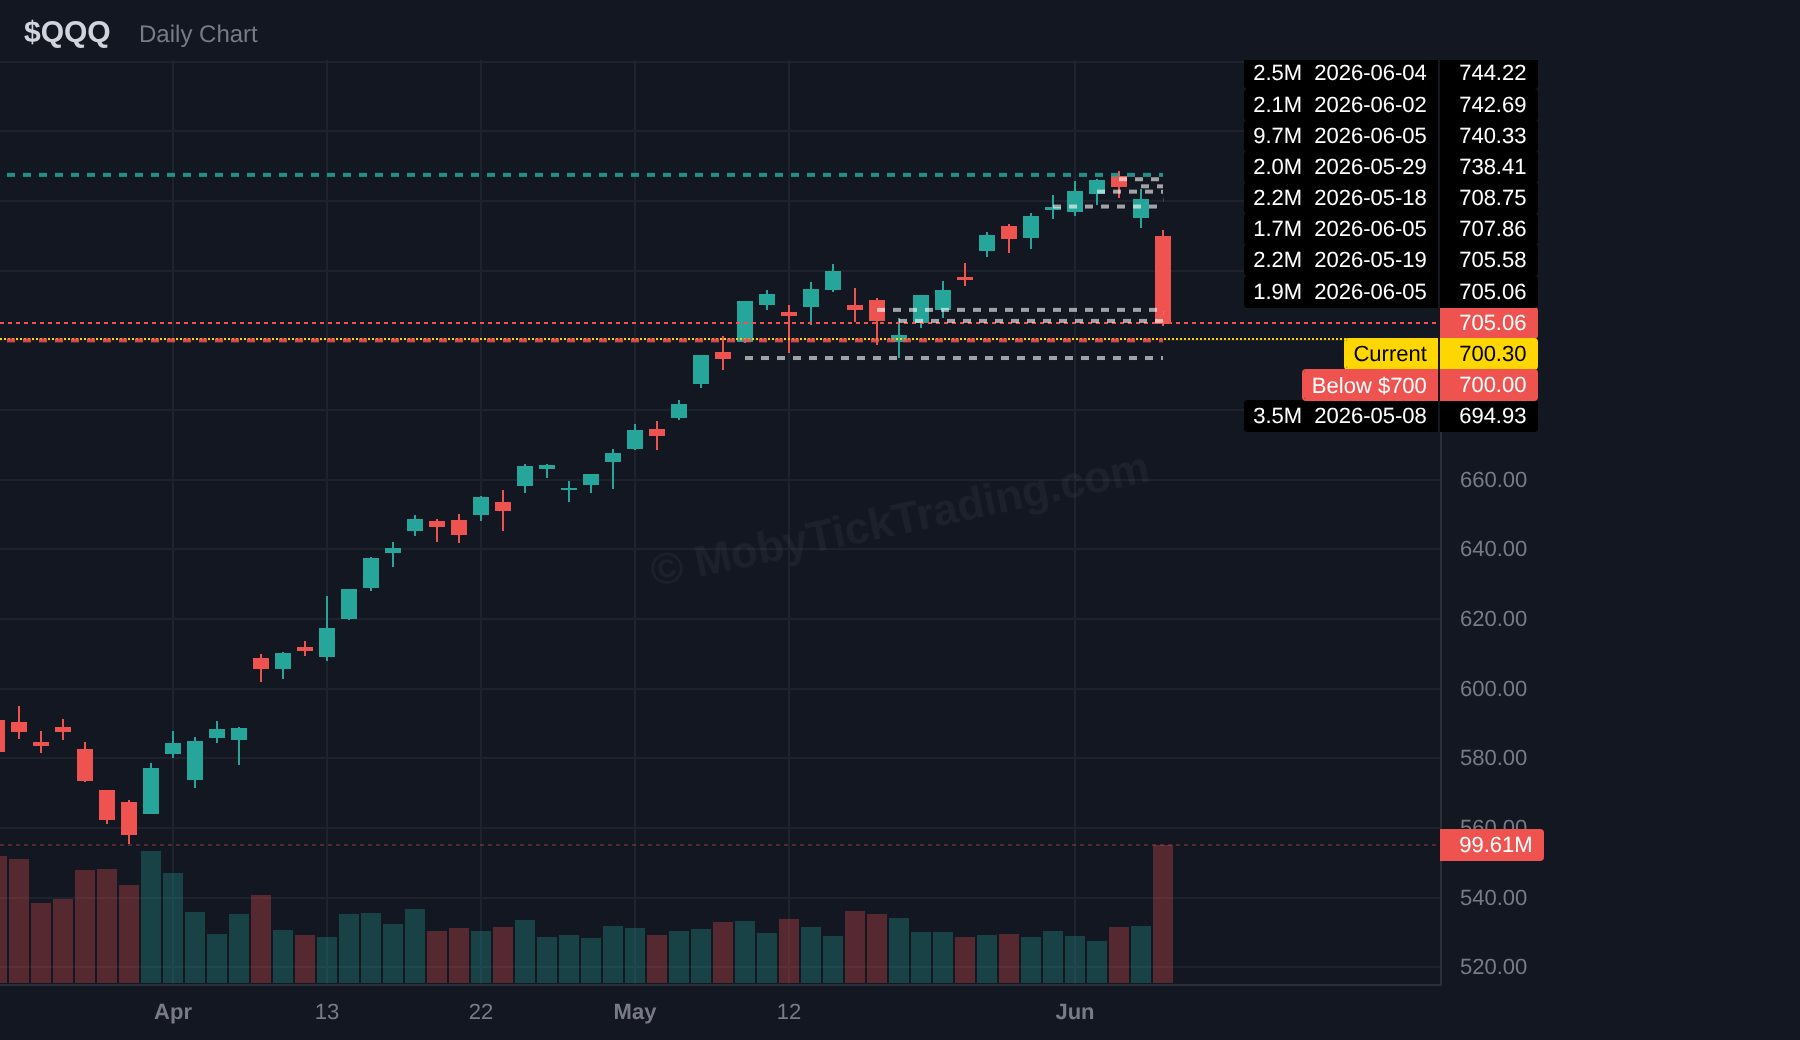
Above $747.50 | Targets: $750.00, $755.00, $760.00, $765.00, $770.00
Below $700.00 | Targets: $695.00, $690.00, $680.00, $675.00, $672.70, $670.00, $660.00
Dark pool flow: $935.6M across 3.22M shares and 5 prints. Average reported print price: $290.64.
Weekly range: $292.61 – $277.98 | Friday close: $281.65 (-3.55%) | Status: BETWEEN triggers
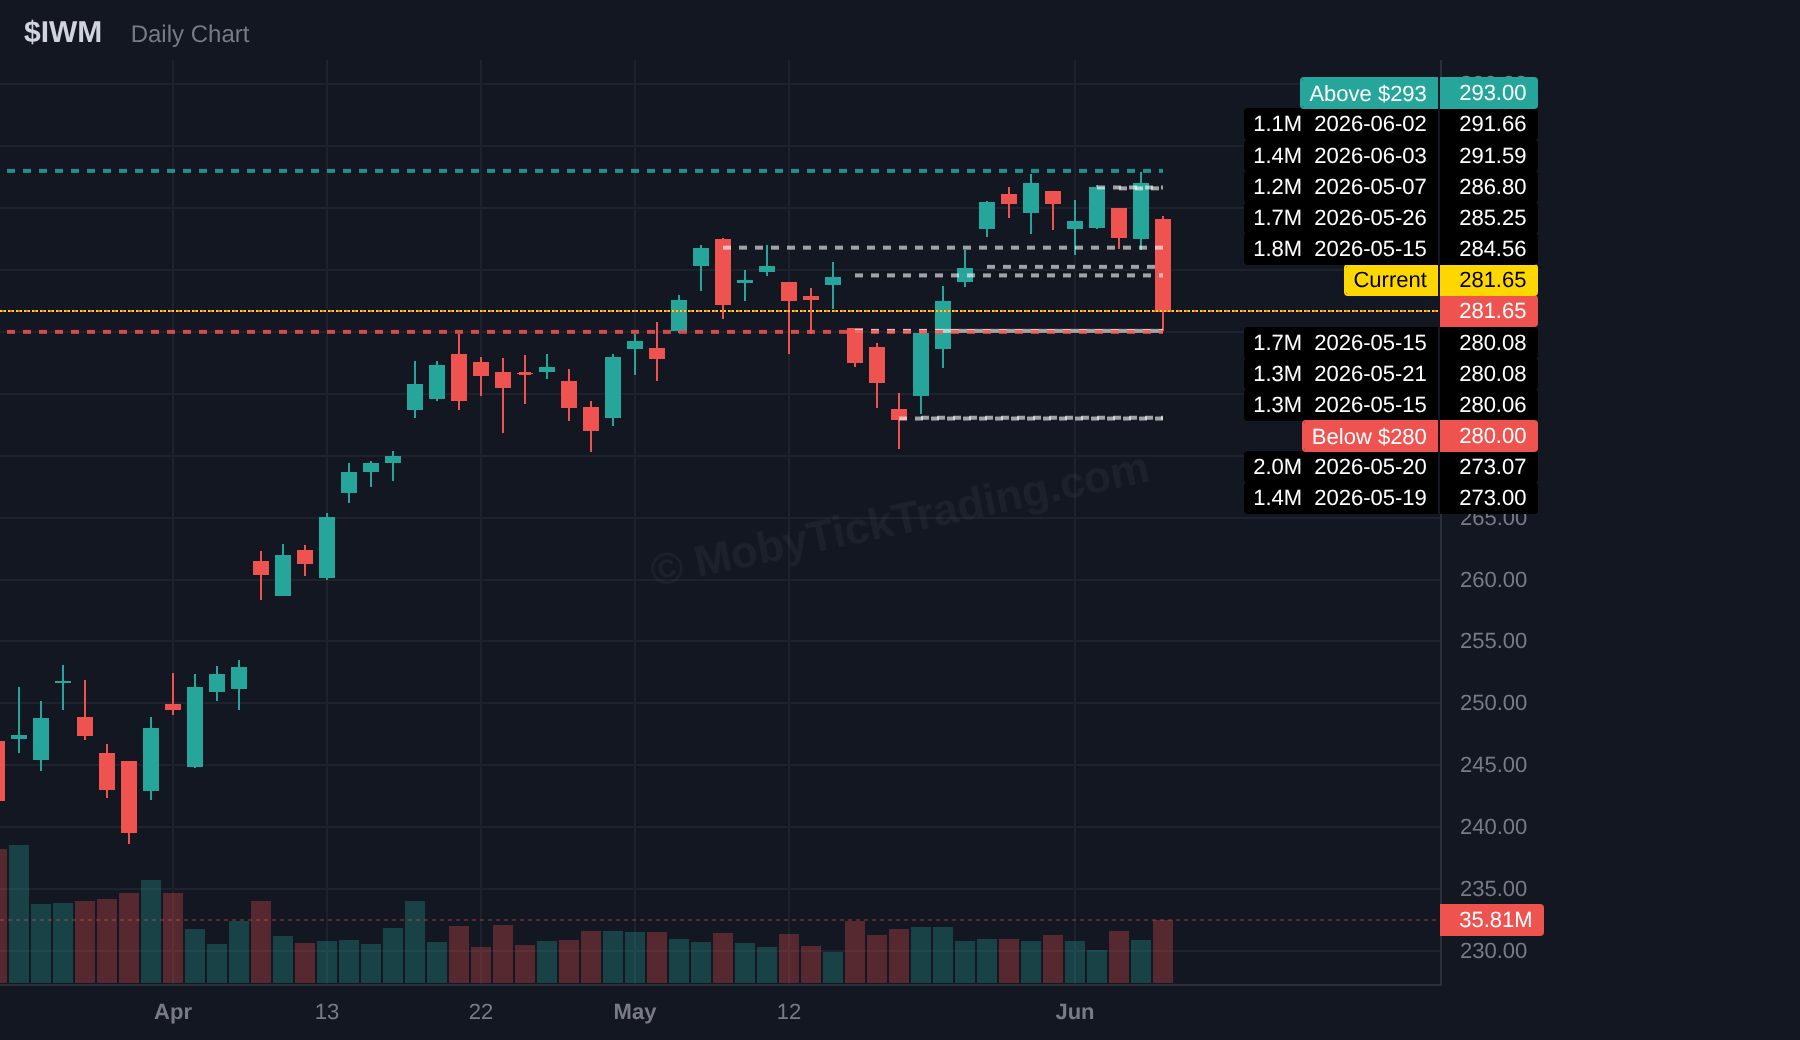
Above $293.00 | Targets: $295.00, $297.50, $300.00, $302.50, $305.00
Below $280.00 | Targets: $275.00, $273.00, $270.00, $265.00, $260.00, $255.00, $250.00
Dark pool flow: $5.44B across 14.79M shares and 6 prints. Average reported print price: $367.53.
Weekly range: $376.37 – $358.70 | Friday close: $368.53 (-2.11%) | Status: BETWEEN triggers
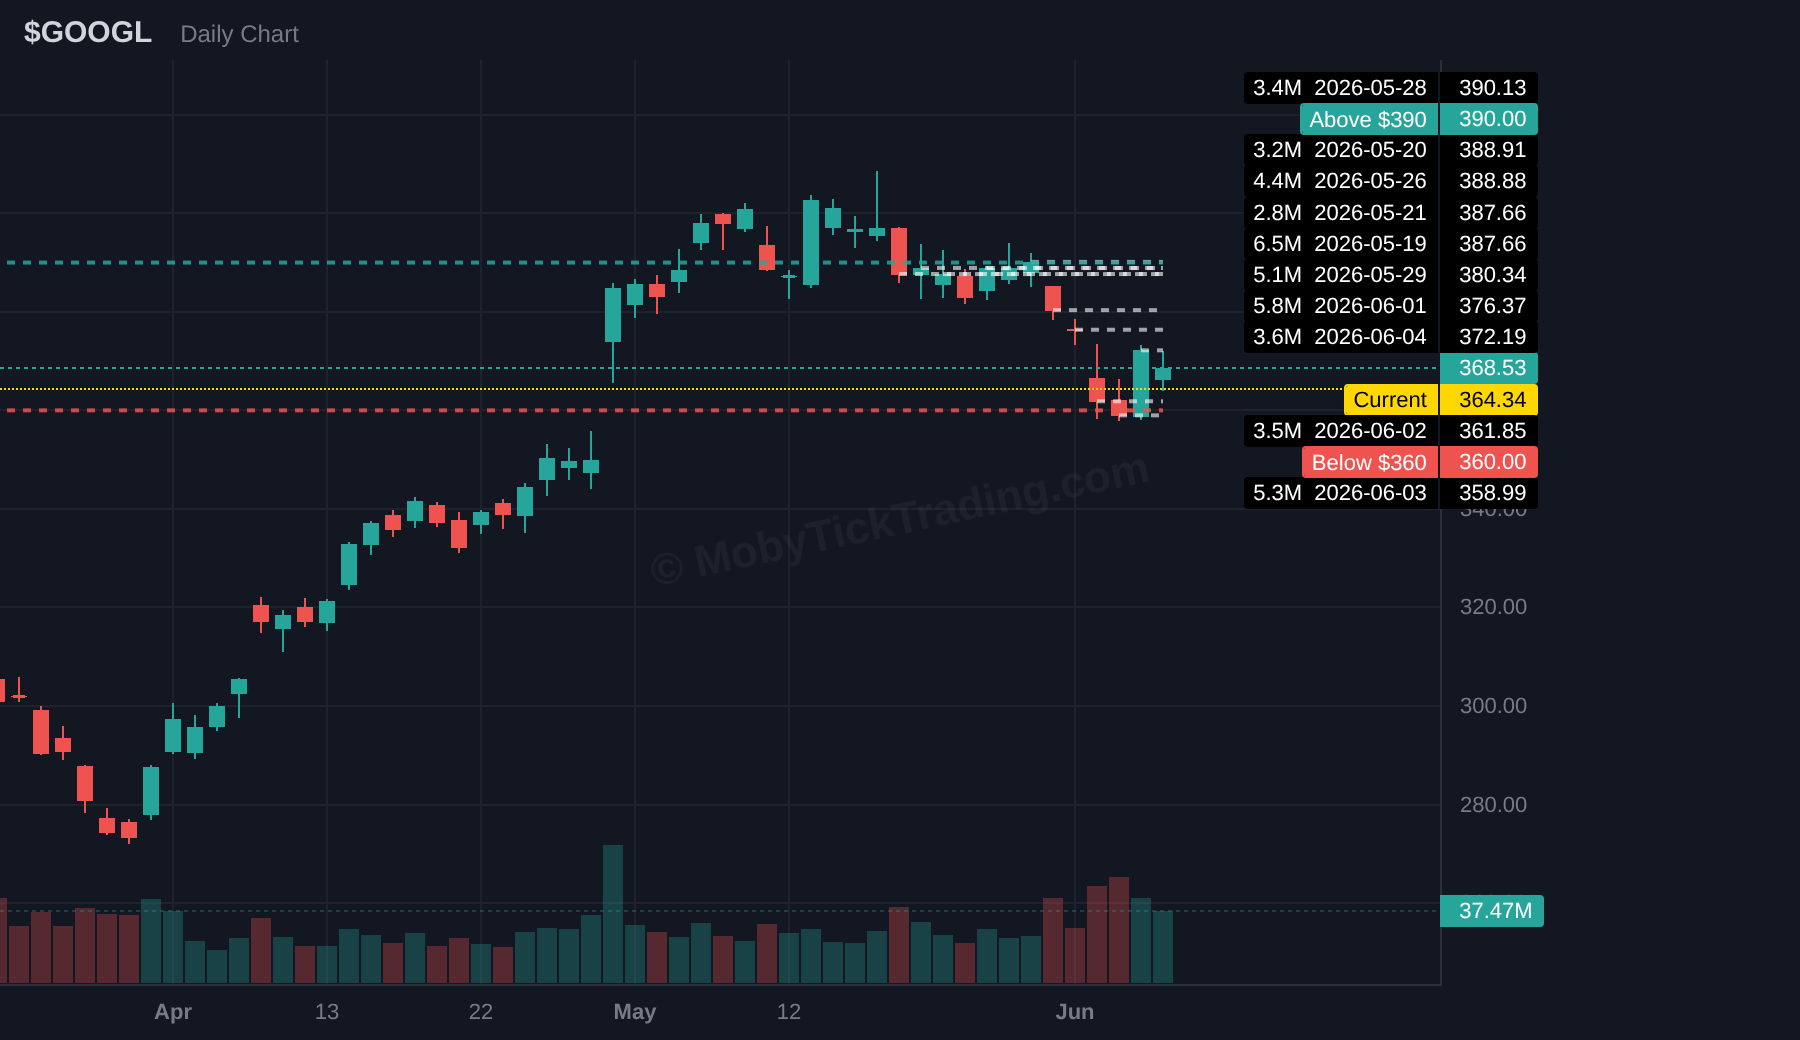
Above $390 | Targets: $395, $400, $405, $410, $415, $420
Below $360 | Targets: $355, $350, $340, $330, $325, $320
Dark pool flow: $3.57B across 3.66M shares and 7 prints. Average reported print price: $976.87.
Weekly range: $1081.27 – $875.30 | Friday close: $864.01 (-13.86%) | Status: BETWEEN triggers
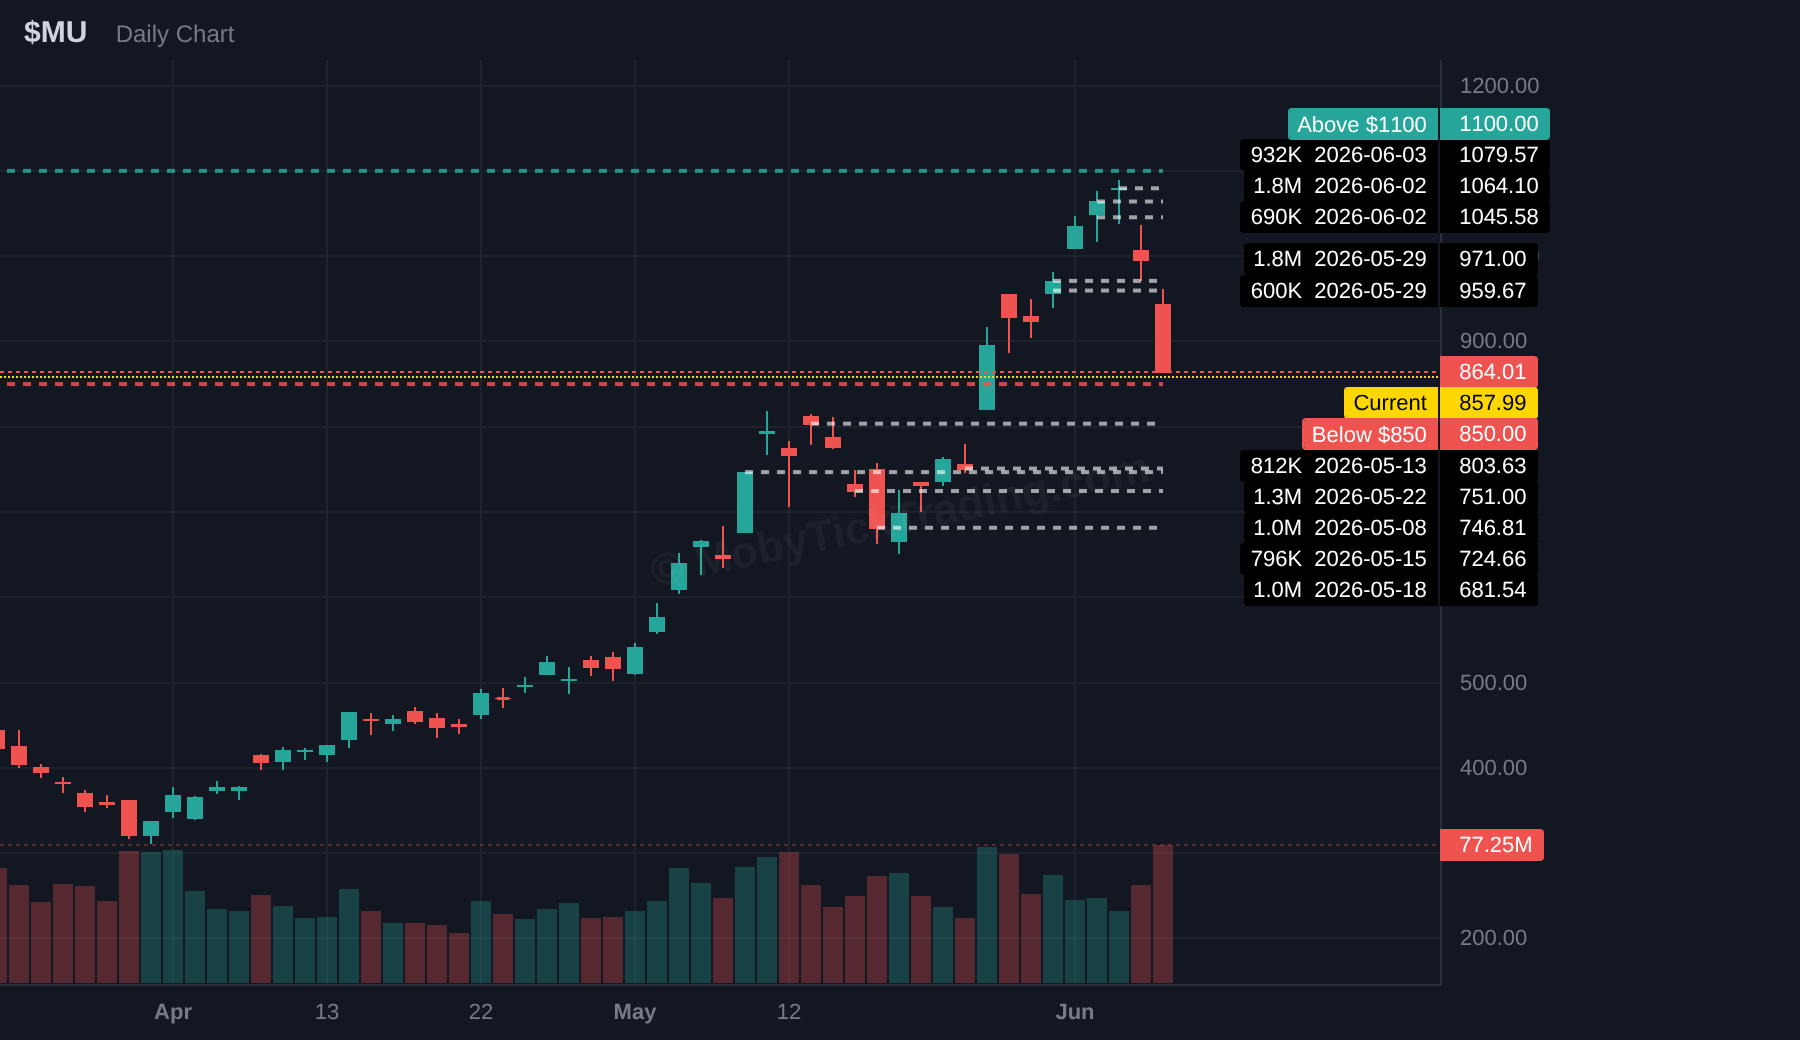
Above $1100 | Targets: $1125, $1150, $1175, $1200
Below $850 | Targets: $825, $800, $790, $775, $750, $725, $700
Dark pool flow: $2.97B across 6.64M shares and 7 prints. Average reported print price: $446.61.
Weekly range: $461.30 – $417.46 | Friday close: $416.67 (-3.63%) | Status: ABOVE trigger price
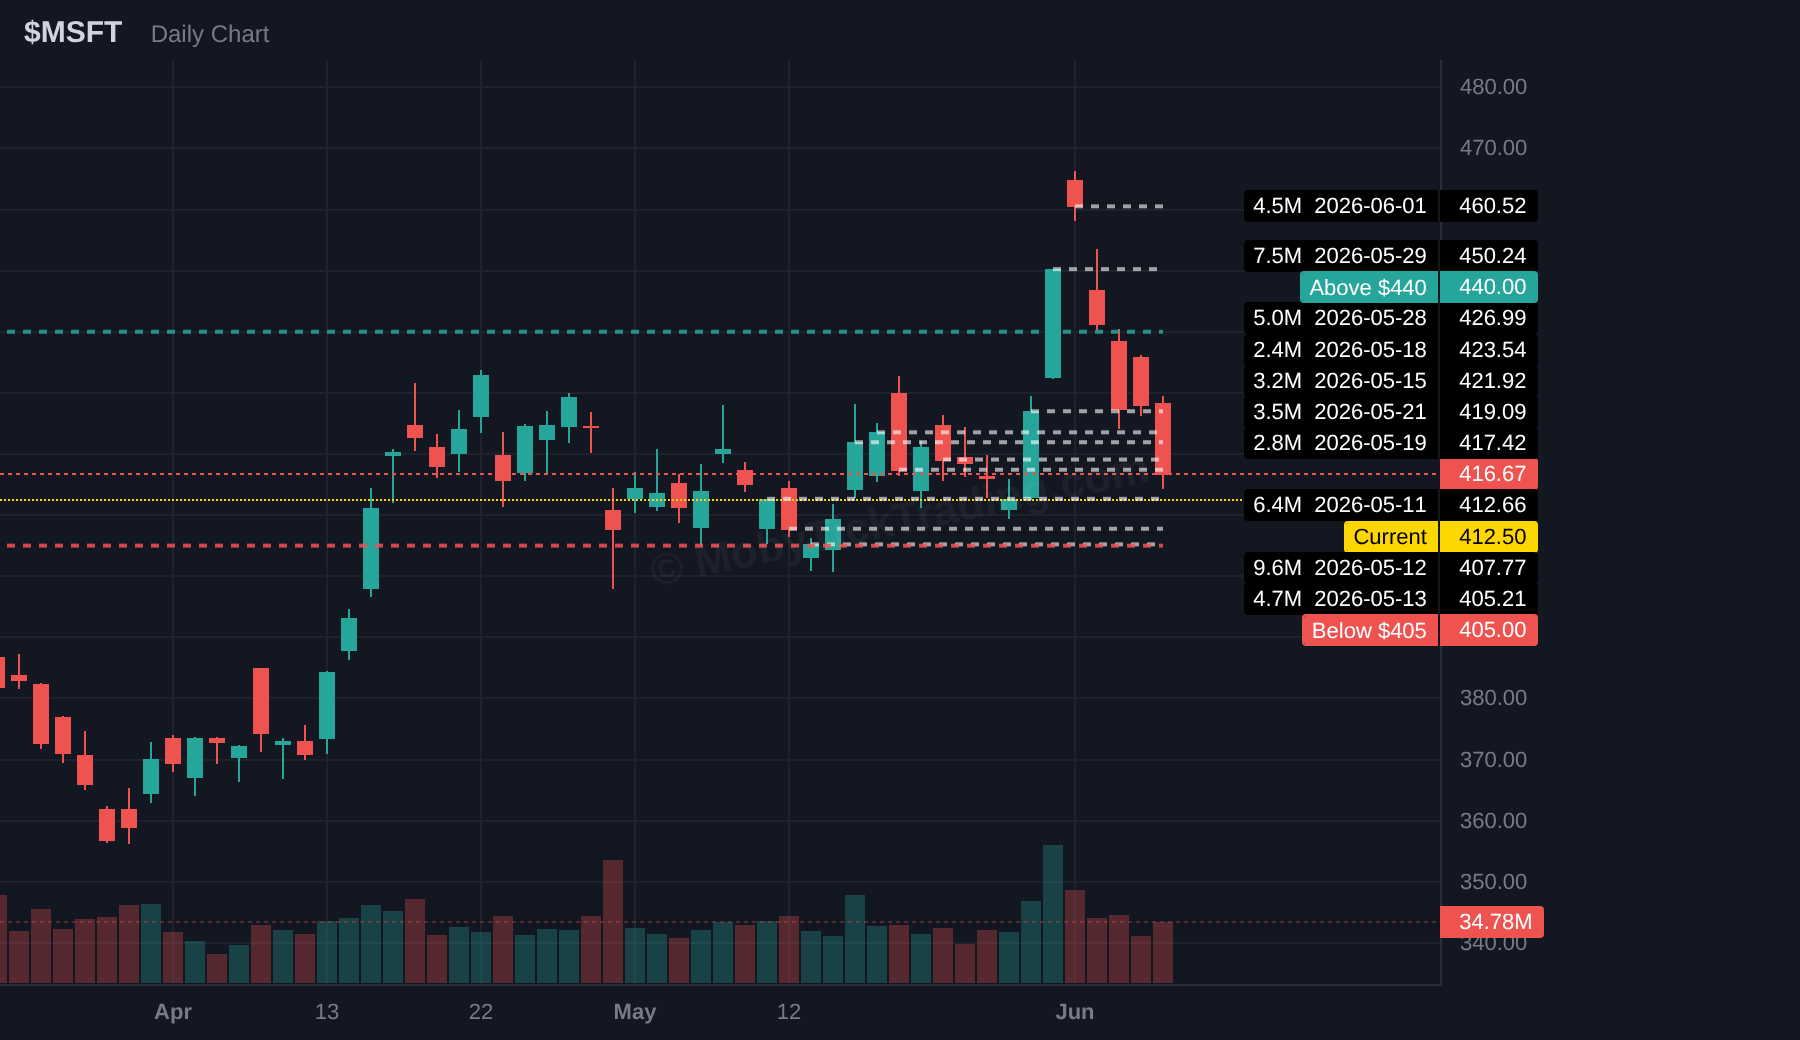
Above $440 | Targets: $445, $450, $455, $460, $465, $470
Below $405 | Targets: $400, $395, $390, $385, $380, $370, $366
Dark pool flow: $1.80B across 4.54M shares and 2 prints. Average reported print price: $396.90.
Weekly range: $401.30 – $375.95 | Friday close: $399.47 (+0.03%) | Status: BETWEEN triggers
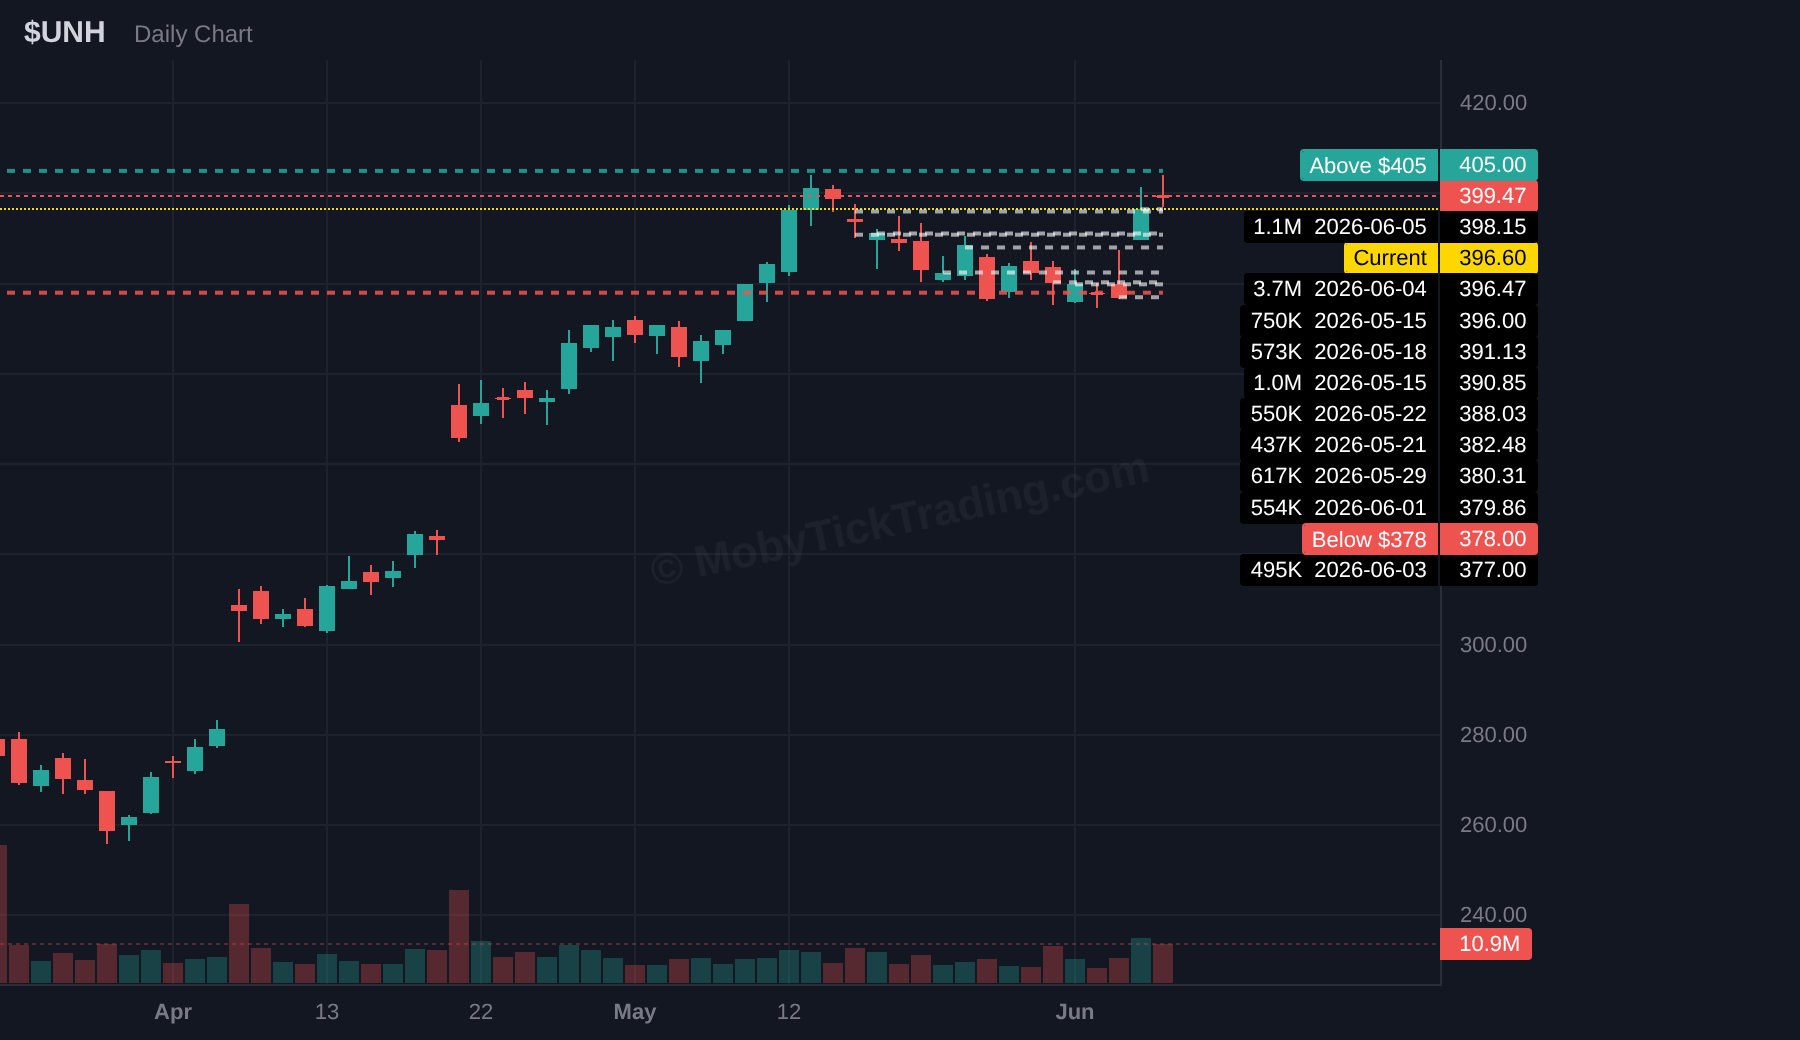
Above $405 | Targets: $410, $412.5, $415, $417.5, $420, $425, $430
Below $378 | Targets: $375, $370, $365, $360, $355, $350
Dark pool flow: $4.71B across 7.65M shares and 6 prints. Average reported print price: $615.63.
Weekly range: $636.26 – $589.74 | Friday close: $593.00 (-6.02%) | Status: BETWEEN triggers
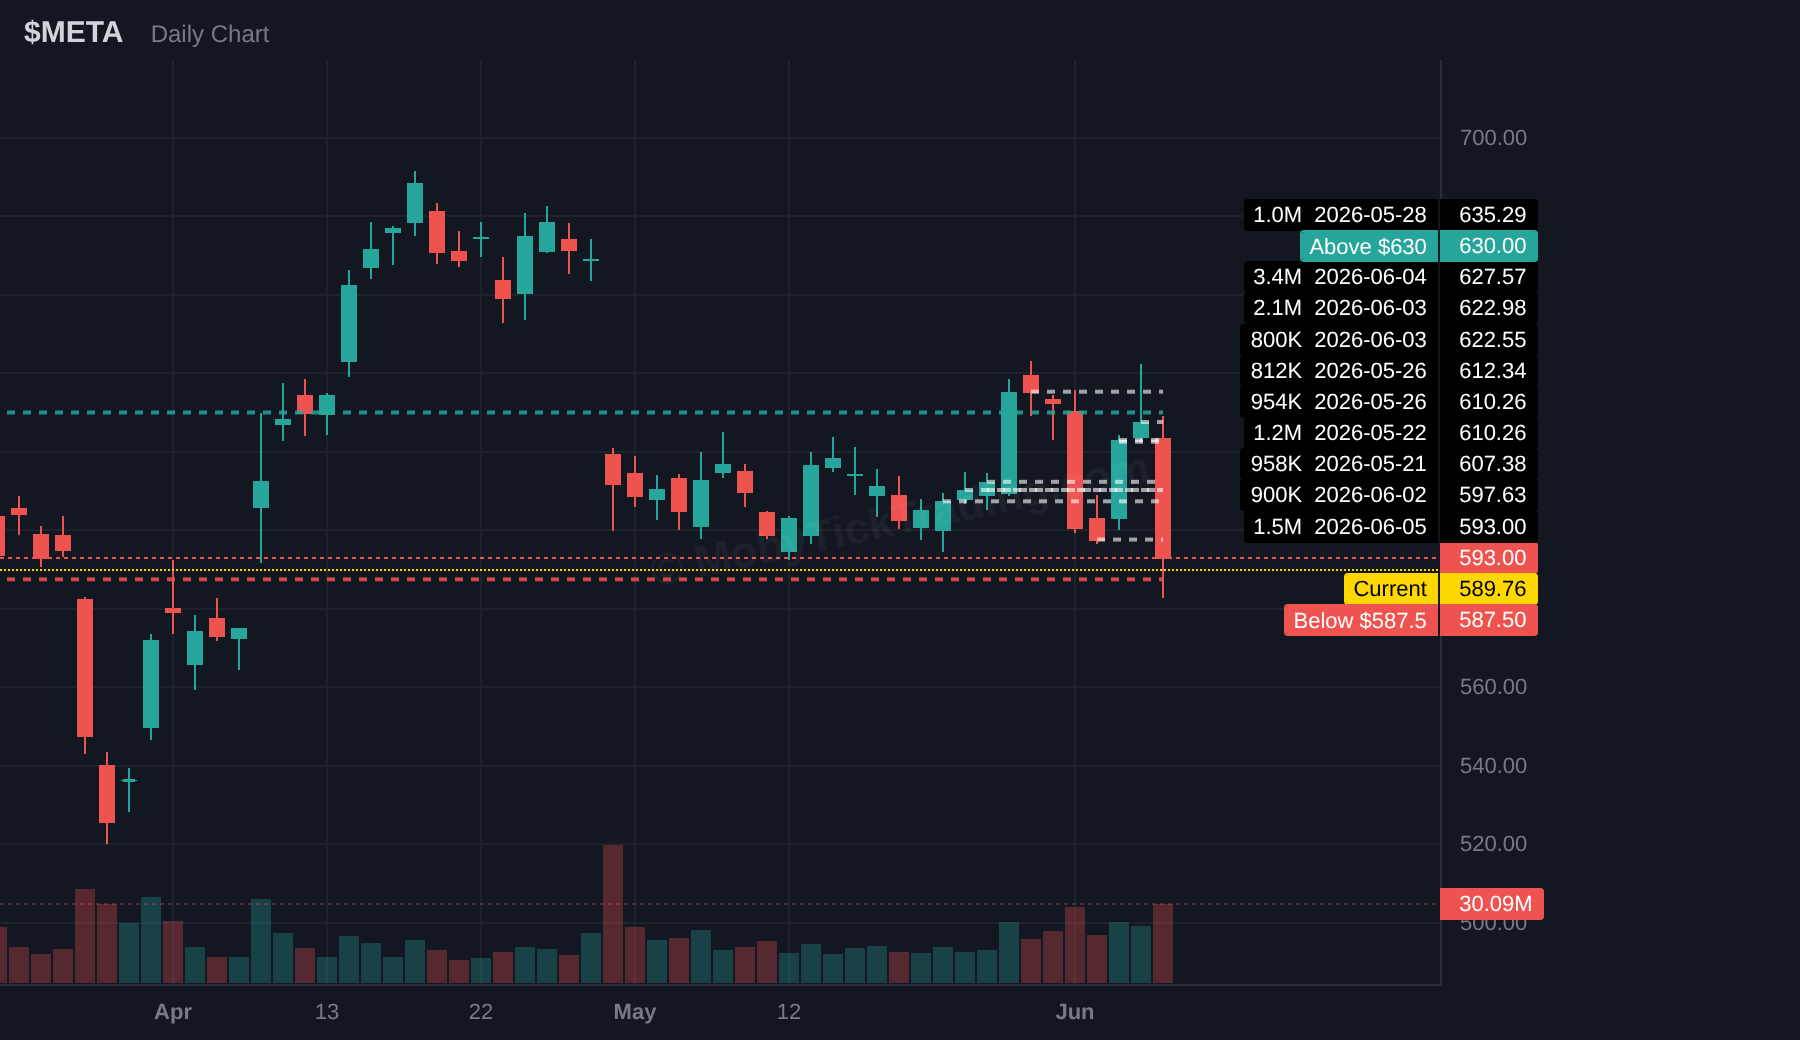
Above $630 | Targets: $635, $640, $642.50, $645, $650, $660
Below $587.5 | Targets: $585, $580, $570, $560, $555
Dark pool flow: $2.29B across 5.10M shares and 7 prints. Average reported print price: $448.80.
Weekly range: $487.07 – $388.00 | Friday close: $385.73 (-8.09%) | Status: ABOVE trigger price
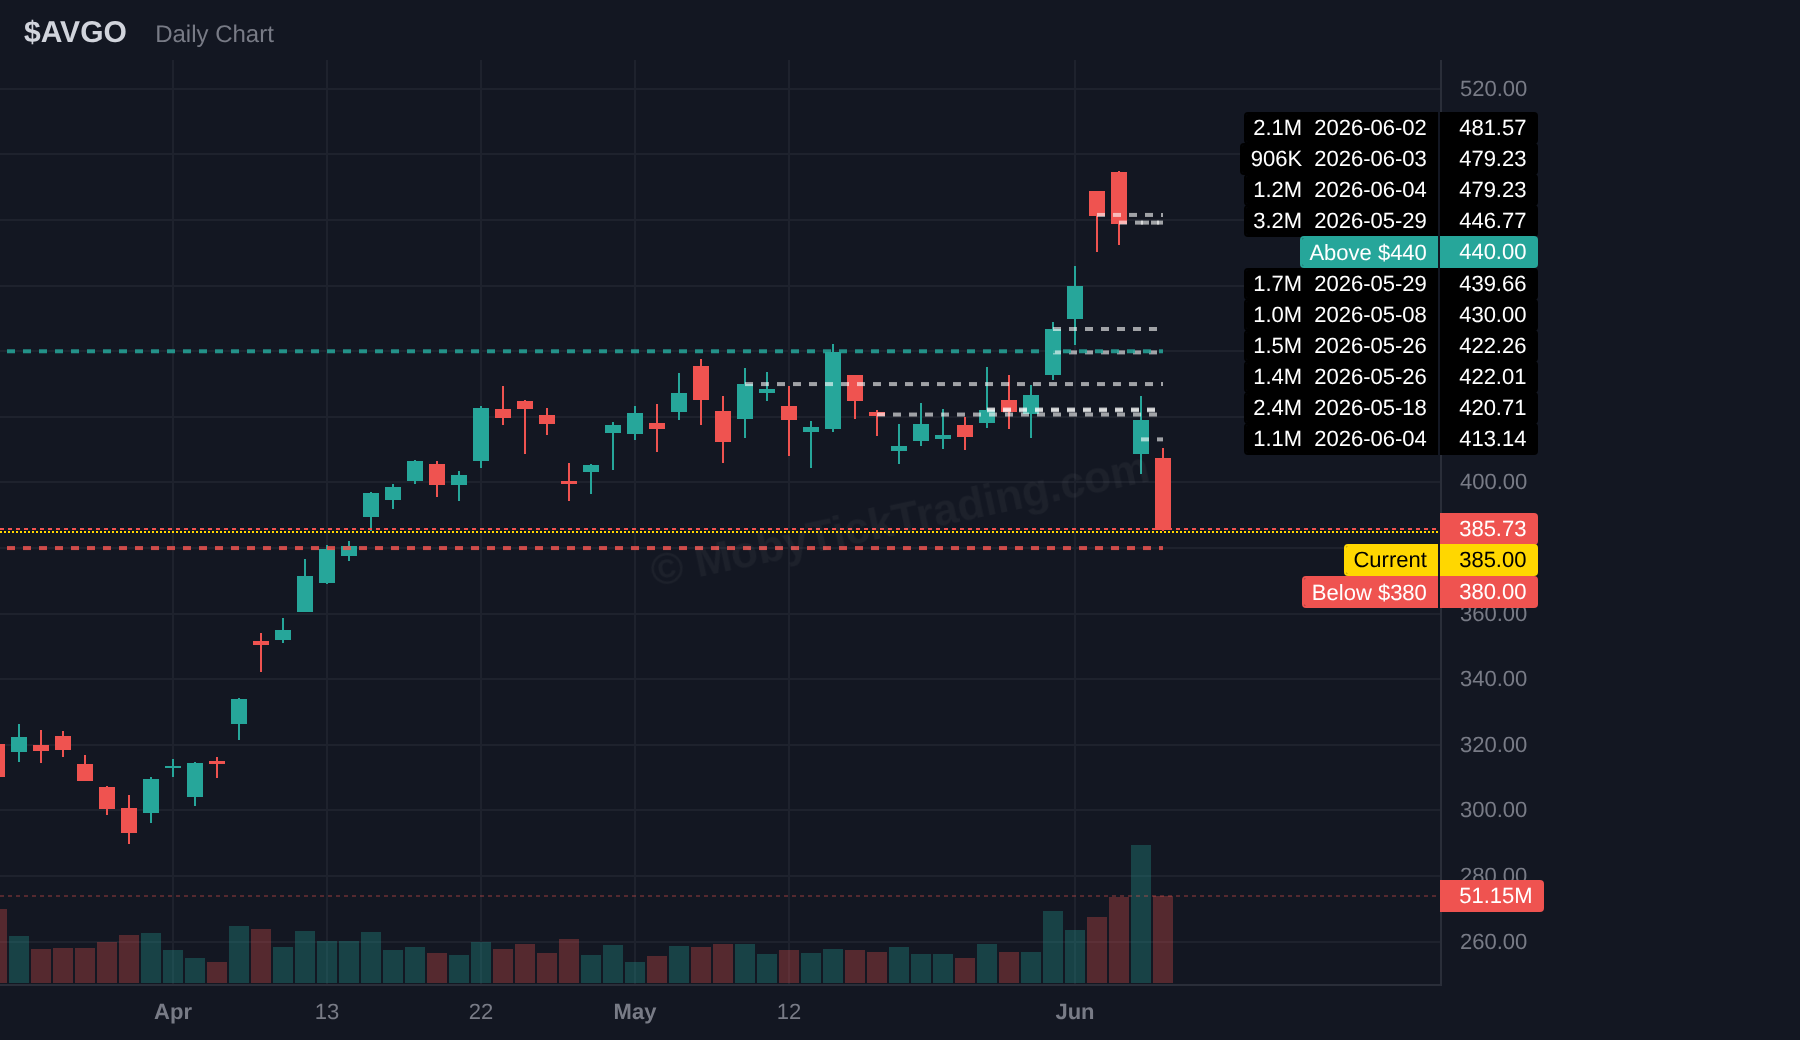
Above $440 | Targets: $450, $470, $480, $490, $500
Below $380 | Targets: $370, $360, $355, $350
Dark pool flow: $1.76B across 15.25M shares and 7 prints. Average reported print price: $115.23.
Weekly range: $120.79 – $112.85 | Friday close: $118.88 (+0.56%) | Status: BETWEEN triggers
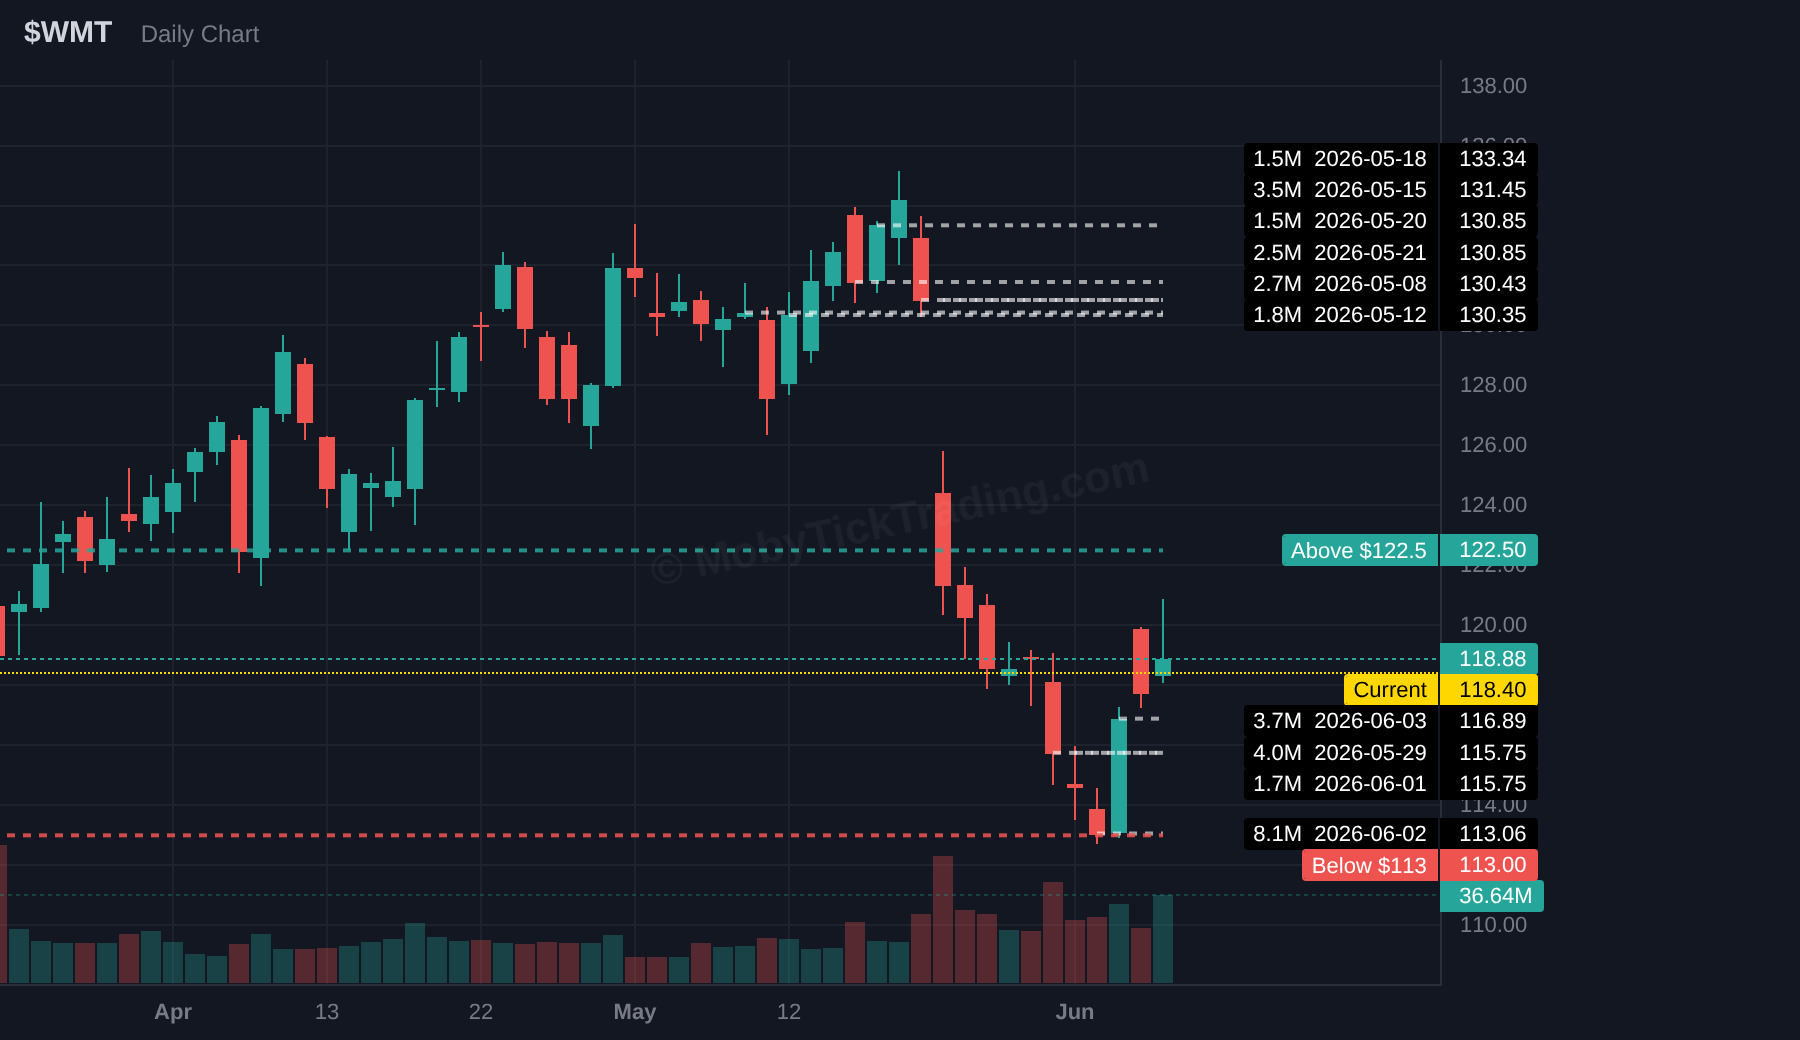
Above $122.5 | Targets: $125, $126.25, $127.5, $130
Below $113 | Targets: $110, $107.5, $105, $102.5, $100, $97.5
Dark pool flow: $736.1M across 13.93M shares and 8 prints. Average reported print price: $52.84.
Weekly range: $54.26 – $51.31 | Friday close: $53.83 (-0.86%) | Status: BETWEEN triggers
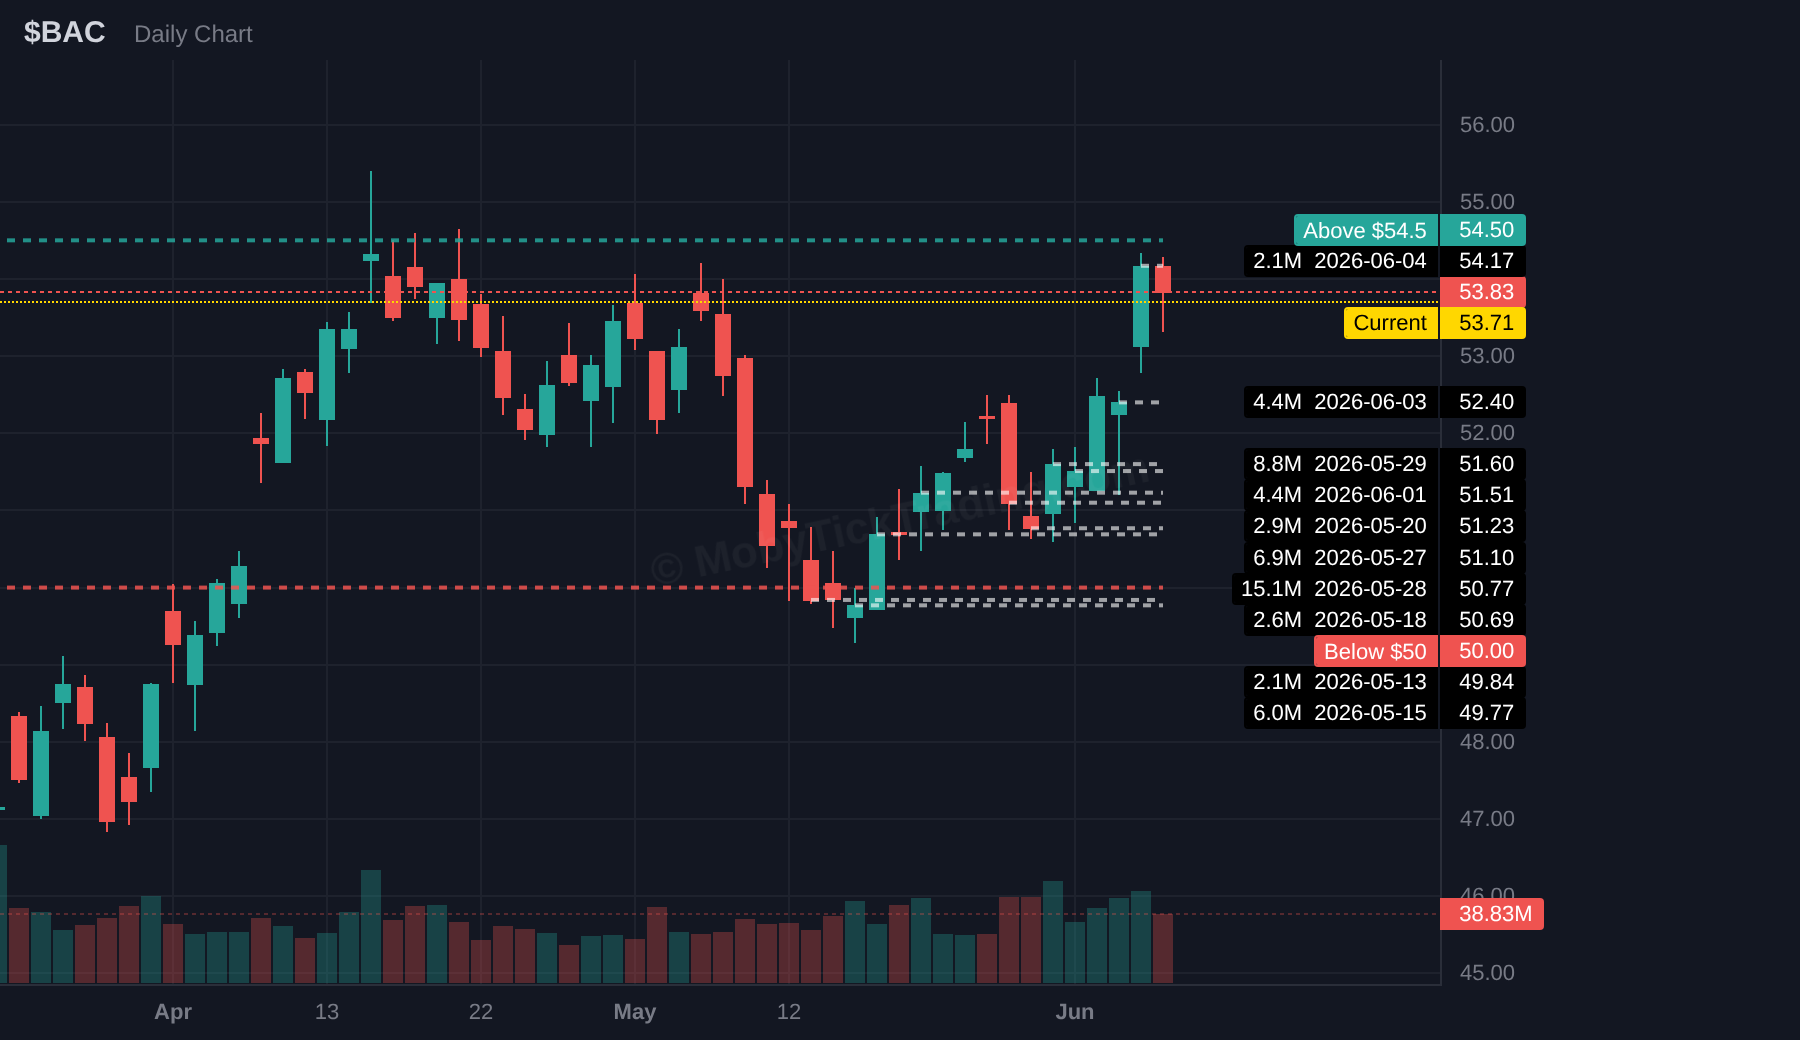
Above $54.5 | Targets: $55, $56.25, $57.5, $58.25, $60
Below $50 | Targets: $48.75, $47.50, $47, $45, $42.50
Dark pool flow: $5.81B across 18.75M shares and 12 prints. Average reported print price: $310.03.
Weekly range: $315.20 – $306.25 | Friday close: $307.34 (-1.11%) | Status: BETWEEN triggers
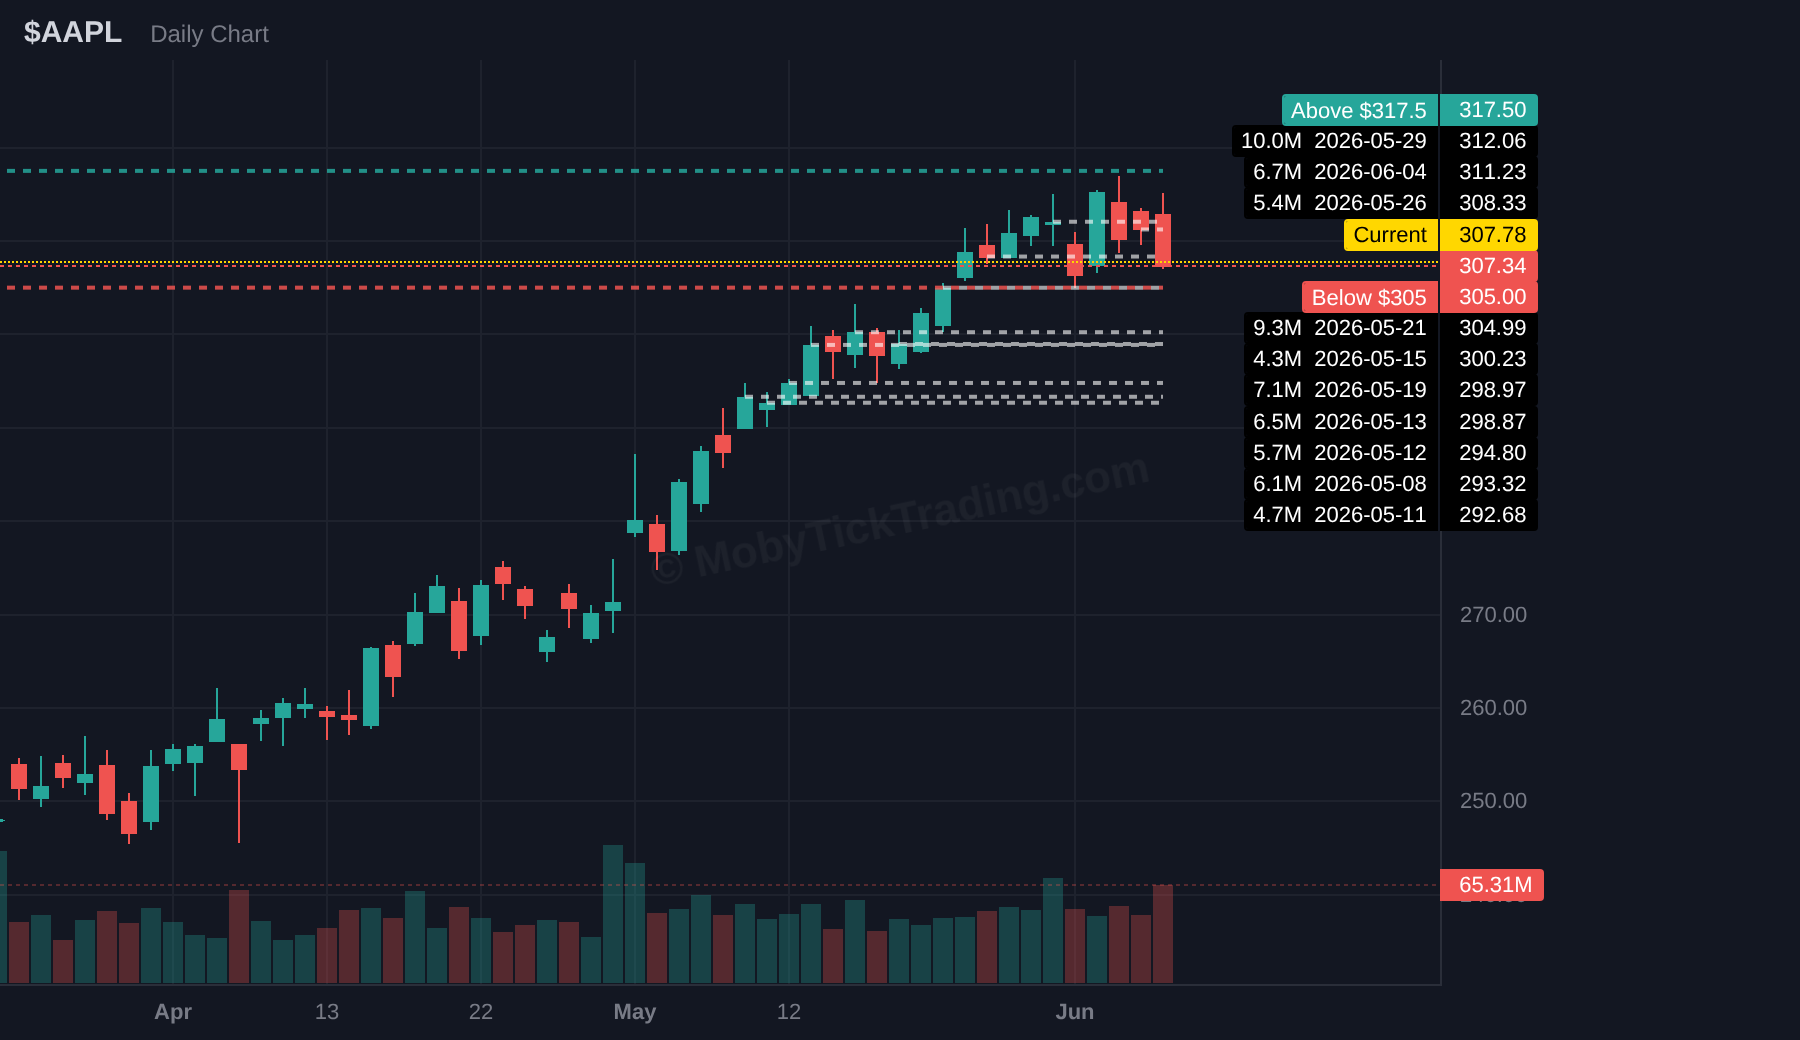
Above $317.5 | Targets: $320, $322.5, $325, $327.5, $330
Below $305 | Targets: $302.5, $300, $297.5, $295, $292.50, $290
Dark pool flow: $9.67B across 44.16M shares and 27 prints. Average reported print price: $219.02.
Weekly range: $228.02 – $197.87 | Friday close: $205.10 (-6.69%) | Status: BETWEEN triggers
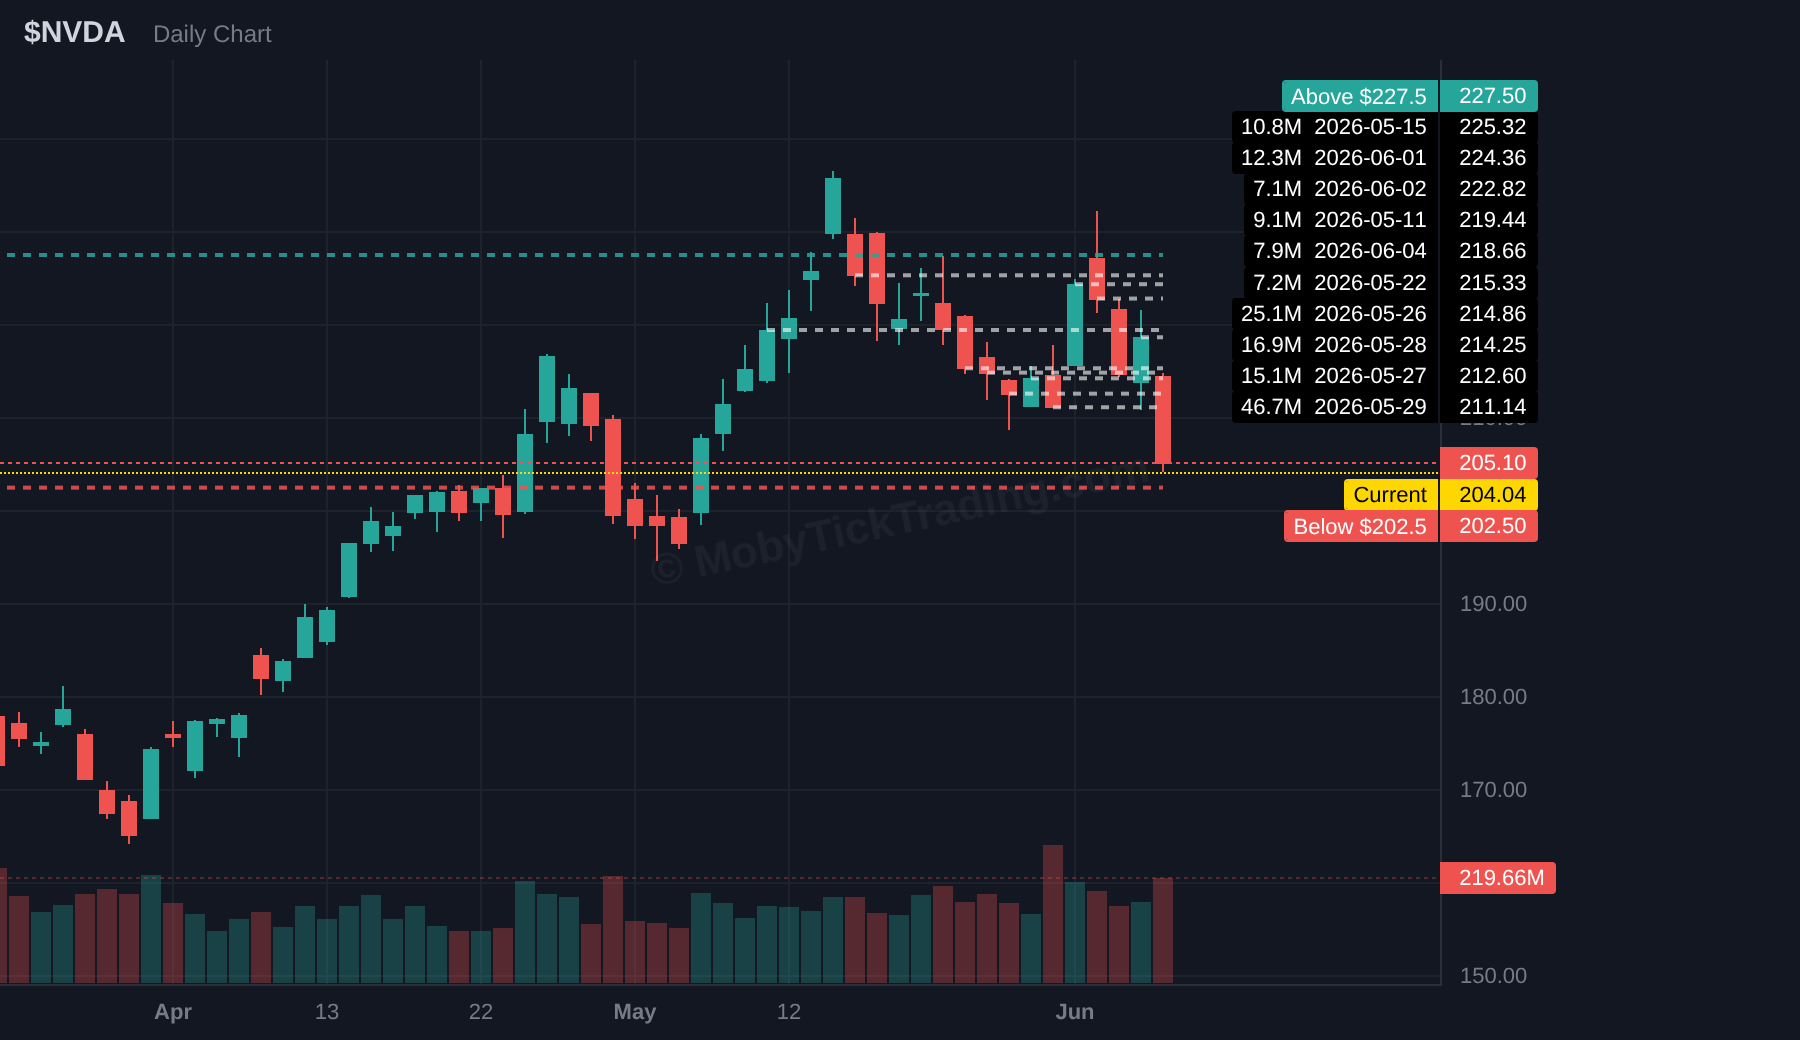
Above $227.5 | Targets: $230, $232.5, $235, $237.50, $240
Below $202.5 | Targets: $200, $198, $195, $190, $186.25, $180, $170
Closing prints are large batches of trades that get matched right at the end of the day, usually around the market close. They are real trades, but they often serve a different purpose than regular trading during the session.
A lot of funds, ETFs, and large money managers use closing prints because they want execution at the official closing price. That can happen for portfolio rebalancing, index tracking, ETF flows, mutual fund activity, or simply getting large size done all at once.
That matters because a closing print does not always mean someone was actively choosing that exact price as an important level for the week. Sometimes it simply means a large order needed to be completed at the close.
For level analysis, closing prints can muddy the picture in three ways:
That is why we exclude closing prints in this report. We want the cleaner picture of where meaningful size traded during the week, not just where large end-of-day orders were matched.
MobyTick gives retail traders institutional-grade dark pool and block trade intelligence across 10,000+ stocks.
You can also get the weekly report free at mobyticktrading.com/weekly-report.
MobyTick Trading provides institutional-grade dark pool and block trade intelligence to retail traders.
10,000+ stocks tracked • 5+ years of historical dark pool data • Real-time dark pool trade surveillance • 7-day free trial available
This report is for educational and informational purposes only. It is not financial advice, investment advice, or a recommendation to buy or sell any security. Past performance does not guarantee future results. Trading involves risk.