Physical Address
304 North Cardinal St.
Dorchester Center, MA 02124
Physical Address
304 North Cardinal St.
Dorchester Center, MA 02124
Understanding what dark pool data is and actually using it in a trading workflow are two different things. Many traders grasp institutional prints at a conceptual level but struggle to integrate them into a practical daily process that survives contact with a live market.
This guide covers a structured workflow for using dark pool data — from initial scans through ticker selection, level analysis, watchlist ranking, and post-trade review. The goal is a repeatable process that turns institutional data into cleaner decision-making, not more noise.
A trader can understand what dark pool data is and still use it badly. Workflow means deciding when to check it, what qualifies as meaningful, how it changes your watchlist, and where it fits relative to charts, sector context, and catalysts.
Without a workflow, dark pool data becomes random confirmation bias — you look at it when you already have a view and cherry-pick the prints that support it. With a workflow, it becomes a structured filter that improves how you prepare, prioritize, and review. The difference is consistency: a process you run the same way every session is what eventually builds pattern recognition.
Most of the time, dark pool activity is best used to prioritize attention. It can tell you which names deserve deeper work, which sectors are seeing unusual participation, and where price levels may matter more than they appear on a simple chart.
The most effective traders treat dark pool data as a context layer, not a trading signal. It improves existing decisions rather than generating new ones out of thin air. A print does not tell you to buy or sell — it tells you where large participants were willing to transact size, which is a very different and more durable kind of information.
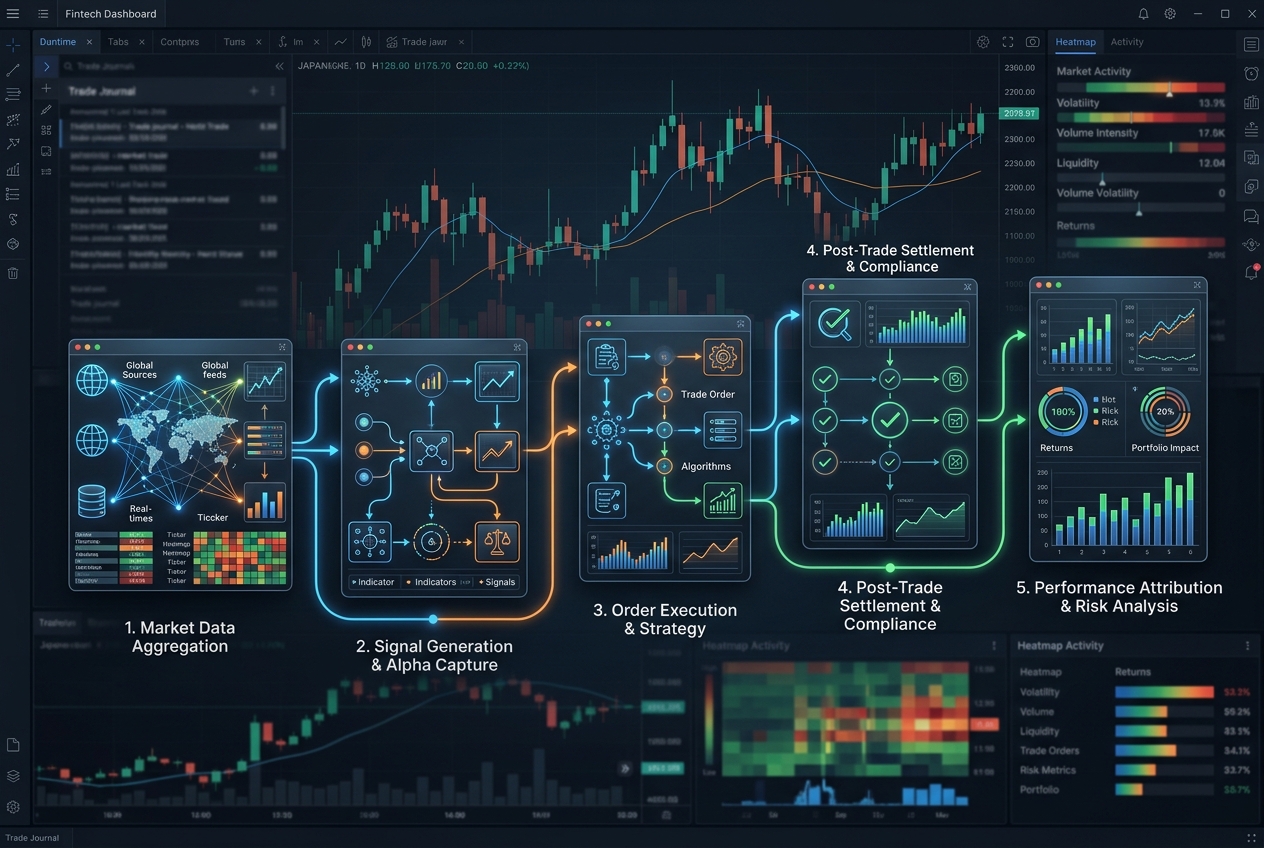
Begin each session by checking which sectors and tickers show elevated dark pool activity. This creates a shortlist. You are not trying to analyze everything in the market. You are trying to identify where institutional participation is unusually active right now.
In MobyTick, you start with the sector-level heatmap to quickly see which industries have elevated institutional activity. On DarkPoolHeatmap.com, the free sector view serves the same purpose — a visual overview of where flow is concentrated before you drill into individual names.
What to look for in a daily scan:
If technology and financials are quiet but one sector lights up, that sector deserves deeper work before you start browsing isolated charts. Persistence matters more than a single spike — a name that appears three sessions in a row is usually more interesting than one that flashed once and disappeared.
Once a sector stands out, drill into the specific names showing the strongest unusual activity or repeated print behavior. This keeps your process top-down rather than reactive. It also reduces the chance that you overinterpret one stock with no broader context behind it.
At the ticker level, focus on:
If the sector ETF is active and two related stocks also show repeated prints, those names belong near the top of your watchlist. Sector confirmation is one of the most underrated filters in dark pool analysis — institutional themes rarely play out in a single isolated name.
This is where most platforms make you do the busywork — manually noting print prices and drawing your own horizontal lines. MobyTick removes that step. Every ticker chart automatically plots the top 10 dark pool prints directly on the price chart by default, so the institutional levels are already there the moment you open the name. You are reading the data, not transcribing it.
Because the prints are mapped onto the chart for you, your job shifts from data entry to interpretation:
That last point matters: the default top 10 is a starting point, not a ceiling. You have full control over what the chart displays, so you can widen the view to see a longer history of prints, narrow it to focus on the largest blocks, or strip it back to a clean price chart when you want to check the technical picture on its own. A cluster zone near a prior breakout or consolidation base is far more useful than a level that exists only because it looks visually neat.
Institutional context is not static. New prints can reinforce a zone or make the setup less interesting. Use each new session to ask whether the activity is still building, rotating elsewhere, or losing its relative significance. Because new prints are plotted on the chart automatically, you can see this evolution at a glance rather than rebuilding your annotations each day.
Signs the setup is improving:
Signs the setup is weakening:
A name that keeps attracting prints while peers remain active is usually stronger workflow material than one that flashed once and went quiet.
When several names look similar technically, dark pool context can help rank them. Prefer the setups with cleaner cluster zones, stronger relative activity, and better sector confirmation instead of treating all chart setups as equal.
Ranking criteria:
Two stocks may both be near support, but the one with recent repeated institutional activity usually deserves higher priority in your preparation. Ranking forces you to commit your attention to the strongest handful of names rather than spreading it thin across everything that looks vaguely interesting.
A good workflow includes feedback. After a move, check whether the dark pool activity helped identify the right zone, the right name, or the right sector theme. This is how dark pool data becomes part of a disciplined process rather than a collection of anecdotes.
Post-trade review framework — ask these four questions after every trade that involved dark pool context:
If a trade worked because price respected an institutional cluster, save that example and compare it with similar setups later. Because the prints stay plotted on every chart, building a personal library of “what a good setup looked like” is just a matter of revisiting the name. Over time, you will develop a sense for which dark pool patterns actually fit your approach.
Here is a condensed workflow you can follow each session:
| Step | Action | Time |
|---|---|---|
| 1 | Sector scan — identify which sectors show elevated institutional activity | ~5 min |
| 2 | Ticker drill-down — find names with repeated prints and high relative activity | ~10 min |
| 3 | Read the chart — review the top prints already plotted, adjust what’s visible | ~10 min |
| 4 | Watchlist ranking — prioritize names with strong institutional context | ~5 min |
| 5 | Session monitoring — check whether activity is building or fading | Ongoing |
Total preparation time: about 30 minutes once you are familiar with the tooling — and noticeably less once you are not hand-charting levels, because the prints are already on the chart. Allow longer when starting out; expect 45–60 minutes for the first few sessions as you build the habit and learn the platform’s interface.
Usually between scanning and execution. It works best as a filter and context layer before you decide which setups deserve your actual risk.
No. It should improve how you read the chart, not replace your chart, timing, or risk management framework. In MobyTick the two live together — the prints are plotted on the price chart, so you read institutional levels and technical structure in the same view.
No. MobyTick automatically plots the top 10 dark pool prints on each ticker’s chart by default, and you control what’s shown from there. There is no manual line-drawing step.
Check the heatmap for elevated sectors, open the most active ticker pages, read the prints already plotted on each chart, and compare those levels with the stock’s technical structure.
MobyTick is designed to support exactly this kind of structured workflow. From sector-level scans and ticker-level historical data to charts that automatically plot the top dark pool prints with full control over what’s displayed, it provides the full toolkit for integrating dark pool data into your trading process — without the manual charting busywork.
The platform tracks 10,000+ stocks with six-plus years of historical data, making it easier to identify clusters, track relative activity, and build watchlists with real institutional context behind them.
From daily scans to charts with the top prints already plotted to post-trade review — MobyTick gives you the tools to make dark pool data a real part of your process.
Plans from $19.99/month • 7-day free trial • 10,000+ stocks tracked