Physical Address
304 North Cardinal St.
Dorchester Center, MA 02124
Physical Address
304 North Cardinal St.
Dorchester Center, MA 02124

Dark pool data is not exclusive to expensive platforms. Several legitimate free sources exist for retail traders who want to explore institutional activity without immediately subscribing to a paid service.
But “free” comes with trade-offs — limited history, fewer features, and less structured workflows. This roundup covers the best free dark pool data sources, what each one provides, where the limitations hit, and how to decide when a paid upgrade makes sense.
Price: Free
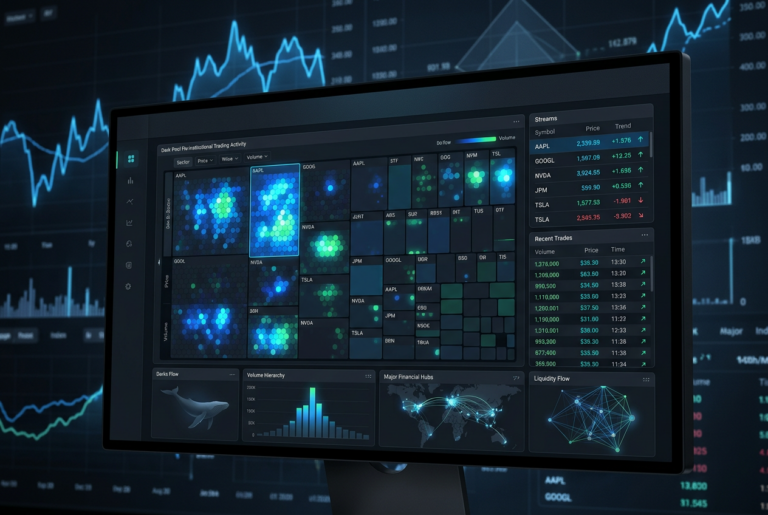
DarkPoolHeatmap.com is the strongest free option for retail traders exploring dark pool data. It provides a live visual heatmap of sector and ticker-level institutional activity without requiring a subscription or account.
What you get for free:
Limitations:
Best for: Initial exploration, quick sector checks, and casual monitoring of institutional activity without financial commitment.
Price: Free
The Financial Industry Regulatory Authority (FINRA) publishes Trade Reporting and Compliance Engine (TRACE) data that includes over-the-counter transactions in equities. This is the raw regulatory source for dark pool data.
What you get for free:
Limitations:
Best for: Advanced users with data processing skills who want raw, unprocessed regulatory data and are willing to build their own analysis pipeline.
Several paid dark pool platforms offer limited free tiers that give you a taste of what the full product offers.
MobyTick offers a 7-day free trial of its full platform. The trial provides complete access to all features — 10,000+ stocks, six-plus years of historical dark pool data, sector scans, ticker-level analysis, watchlists, and built-in charts that automatically plot the top 10 dark pool prints on every ticker with full control over what’s displayed. There are no feature restrictions during the trial period, so you get the full experience — including all historical data — to evaluate whether the platform fits your workflow before committing.
Some broader market intelligence platforms may include dark pool data in free tiers or limited previews, but generally the most useful dark pool features — historical depth, alerts, sector breakdowns — are reserved for paid subscriptions.
A growing number of brokers and trading platforms include dark pool data as part of their premium or pro-tier subscriptions. While not free in the strict sense, this data is sometimes included in a package you may already be paying for.
Platforms to check:
If you already have a brokerage account with one of these providers, check whether dark pool data is included in your current subscription tier. The main trade-off is that broker-integrated data is raw and unprocessed — you see the prints but must build your own aggregation, filtering, and historical analysis layer manually.
Some traders share dark pool data screenshots, observations, and analysis on platforms like X (Twitter), Reddit (r/darkpool, r/stocks), and Discord communities.
How to use it: Treat social media as a lead generation source, not as data analysis. A trader posting “massive $50M AAPL block at $304” is not providing you with actionable data — they are giving you a potential starting point to investigate yourself. Check the name on a proper platform, verify the print, and look for cluster context before acting on anything.
Limitations:
Social media is useful for discovering names to investigate. It is not a substitute for running your own analysis on a proper platform.
Free dark pool data sources are excellent for exploration and learning. But they come with practical limits that eventually constrain how useful the data can be in a real trading workflow.
Consider upgrading to a paid tool when:
| Feature | Free Sources | Paid Tools (e.g., MobyTick) |
|---|---|---|
| Live sector heatmap | ✓ (limited) | ✓ |
| Historical data | Minimal | 6+ years |
| Stock coverage | Variable | 10,000+ |
| Cluster analysis | ✗ | ✓ |
| Prints plotted on chart | ✗ | ✓ (top 10 auto-plotted, user-controlled) |
| Watchlists and alerts | ✗ | ✓ |
| Sector-level analysis | Basic | ✓ |
| Price | Free | From $19.99/mo |
For pure free access with no strings attached, DarkPoolHeatmap.com is the best starting point. It provides immediate, visual access to sector and ticker-level dark pool activity without requiring an account or payment.
If you have data-processing skills, FINRA’s OTC Transparency data provides the raw regulatory source material, though you will need to build your own analysis layer.
For a complete, structured workflow with historical depth, alerts, and charts that plot the prints for you, the 7-day free trial of MobyTick gives you full access to all features and all historical data — no feature restrictions during the trial — so you can properly evaluate whether a paid tool fits your needs.
Get full access to 10,000+ stocks, 6+ years of historical dark pool data, sector scans, charts with the top dark pool prints auto-plotted, and a complete institutional research workflow.
No credit card required for trial • Plans from $19.99/month after trial