Physical Address
304 North Cardinal St.
Dorchester Center, MA 02124
Physical Address
304 North Cardinal St.
Dorchester Center, MA 02124

Every day, billions of dollars trade through private exchanges called dark pools—invisible to standard charting platforms. This institutional trading activity represents approximately 30-40% of all U.S. equity volume, and it’s where the largest market participants move capital. Dark pool analysis gives retail traders visibility into that hidden layer.
Key Insight: When you see a stock price on your broker app, you’re only seeing 60-70% of actual trading. The other 30-40% happens in dark pools—and that’s where institutional money leaves its footprint.
Dark pool analysis is the practice of tracking and interpreting large institutional trades that occur on private exchanges. These Alternative Trading Systems (ATS) allow pension funds, hedge funds, and mutual funds to execute large orders without publicly displaying their intentions. When they trade, the details are reported to FINRA—typically within seconds—and that data is what dark pool analysis tools surface.
Imagine a pension fund needs to buy $500 million of Apple stock. On a public exchange, that order would move the price against them as other traders notice the large buy pressure. Dark pools solve this by matching large orders privately. The trade only becomes public through FINRA’s Trade Reporting Facility—after execution.
The power of dark pool analysis becomes clearest when you see what institutions were doing on specific days. March 20, 2026 was one of those days. The broad market was under pressure, but dark pool data told a different story.
On that single day, multiple major stocks saw their largest dark pool prints of the 90-day period tracked:
| Ticker | Print Size | Price | Dollar Value | Context |
|---|---|---|---|---|
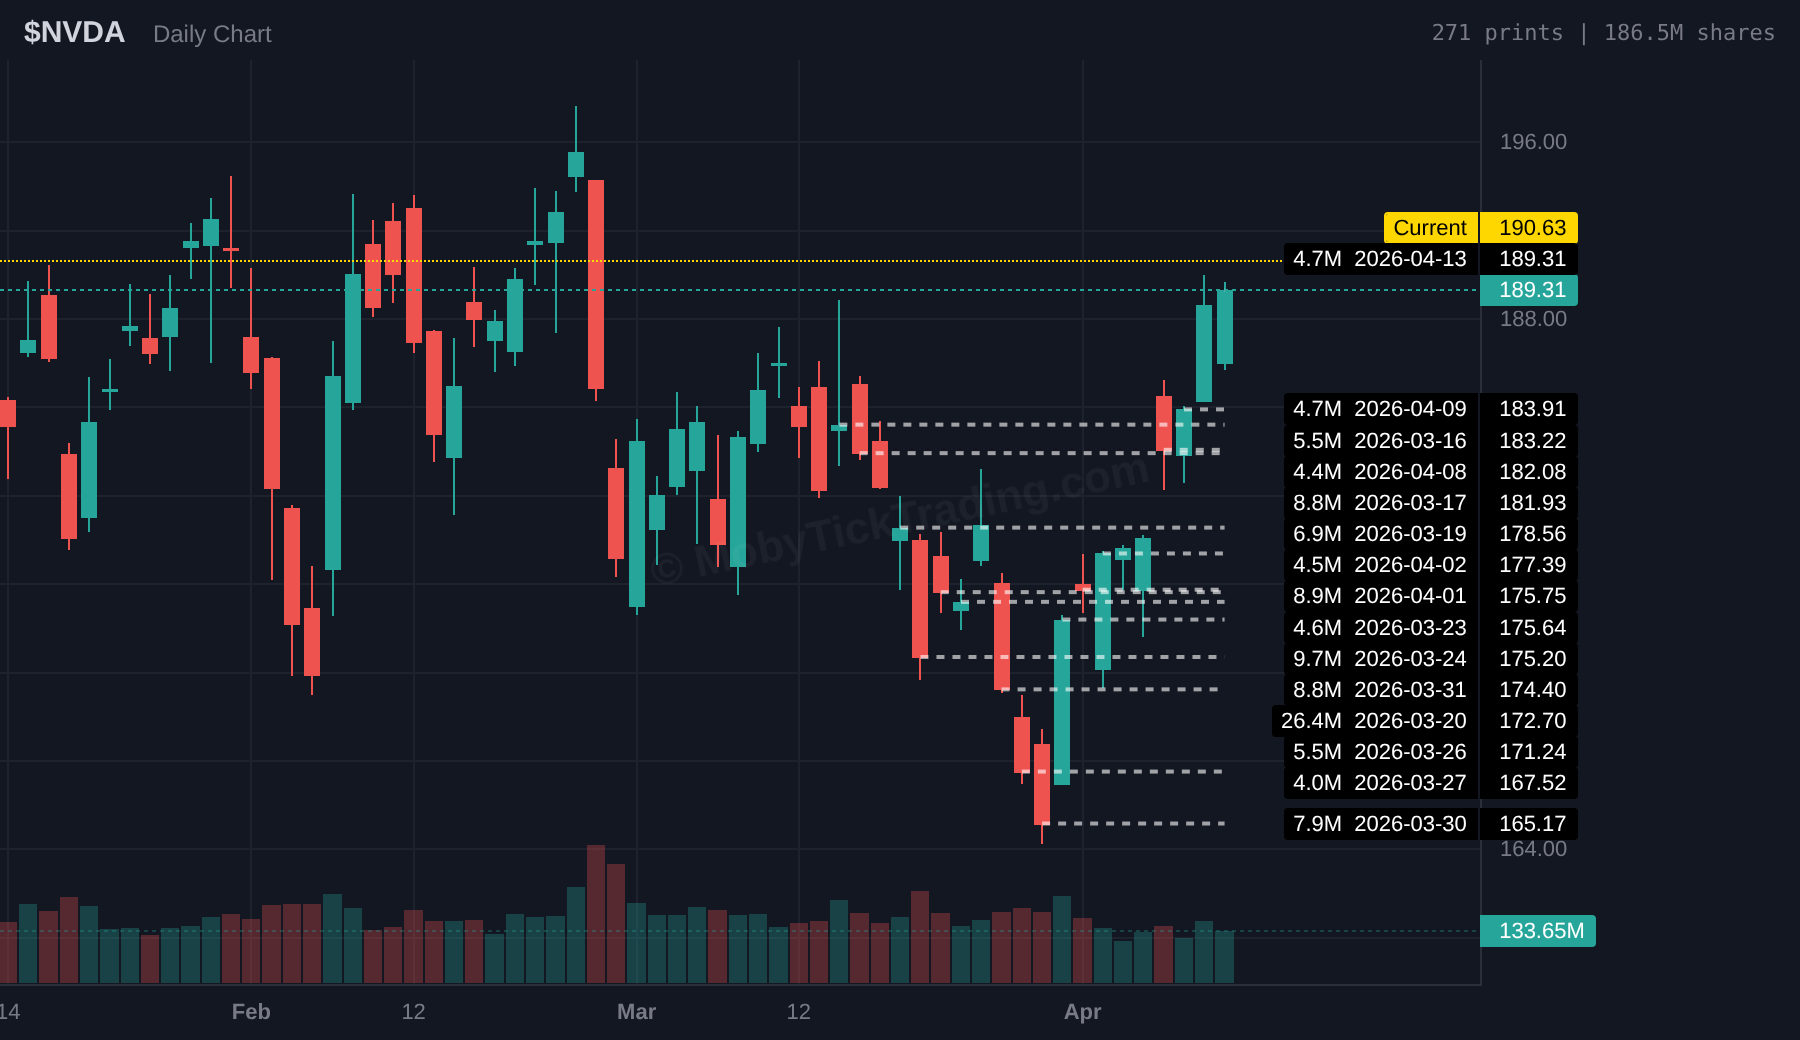
| NVDA | 26.4M shares | $172.70 | $4.55 billion | Largest print in 90 days |
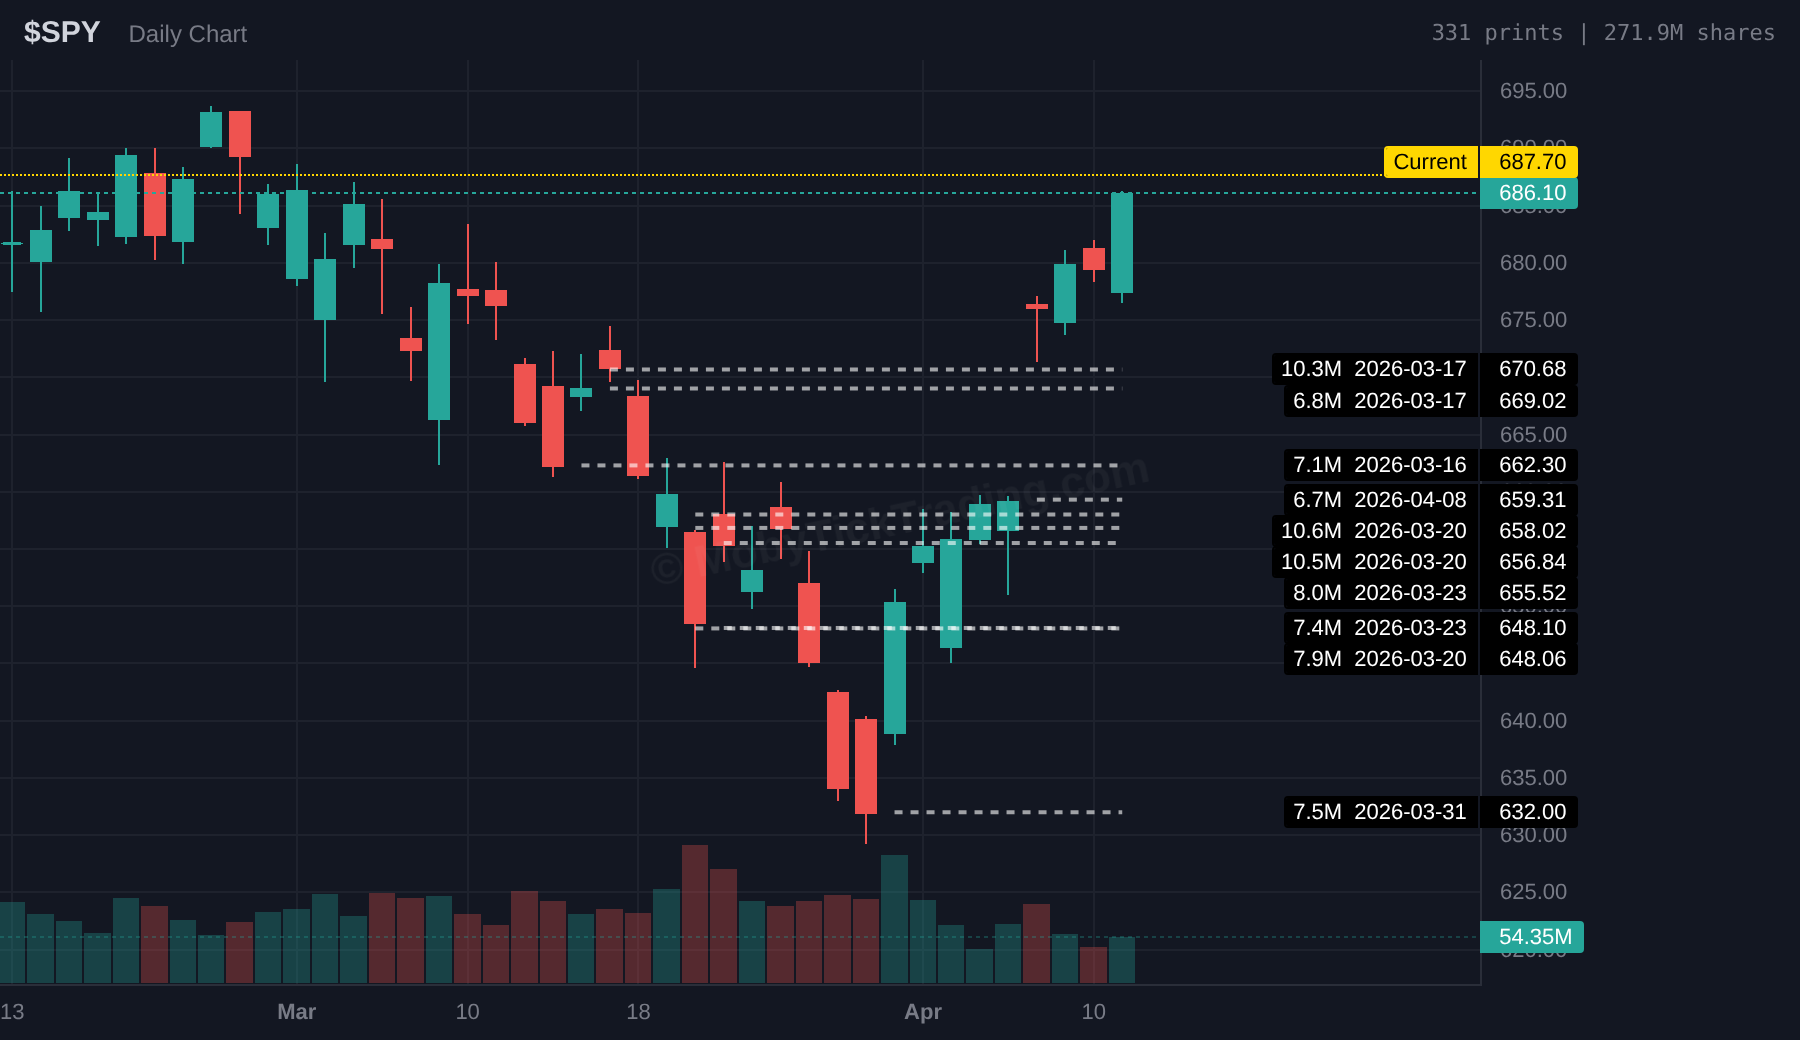
| SPY | 10.6M shares | $658.02 | $6.96 billion | Largest print in 90 days |
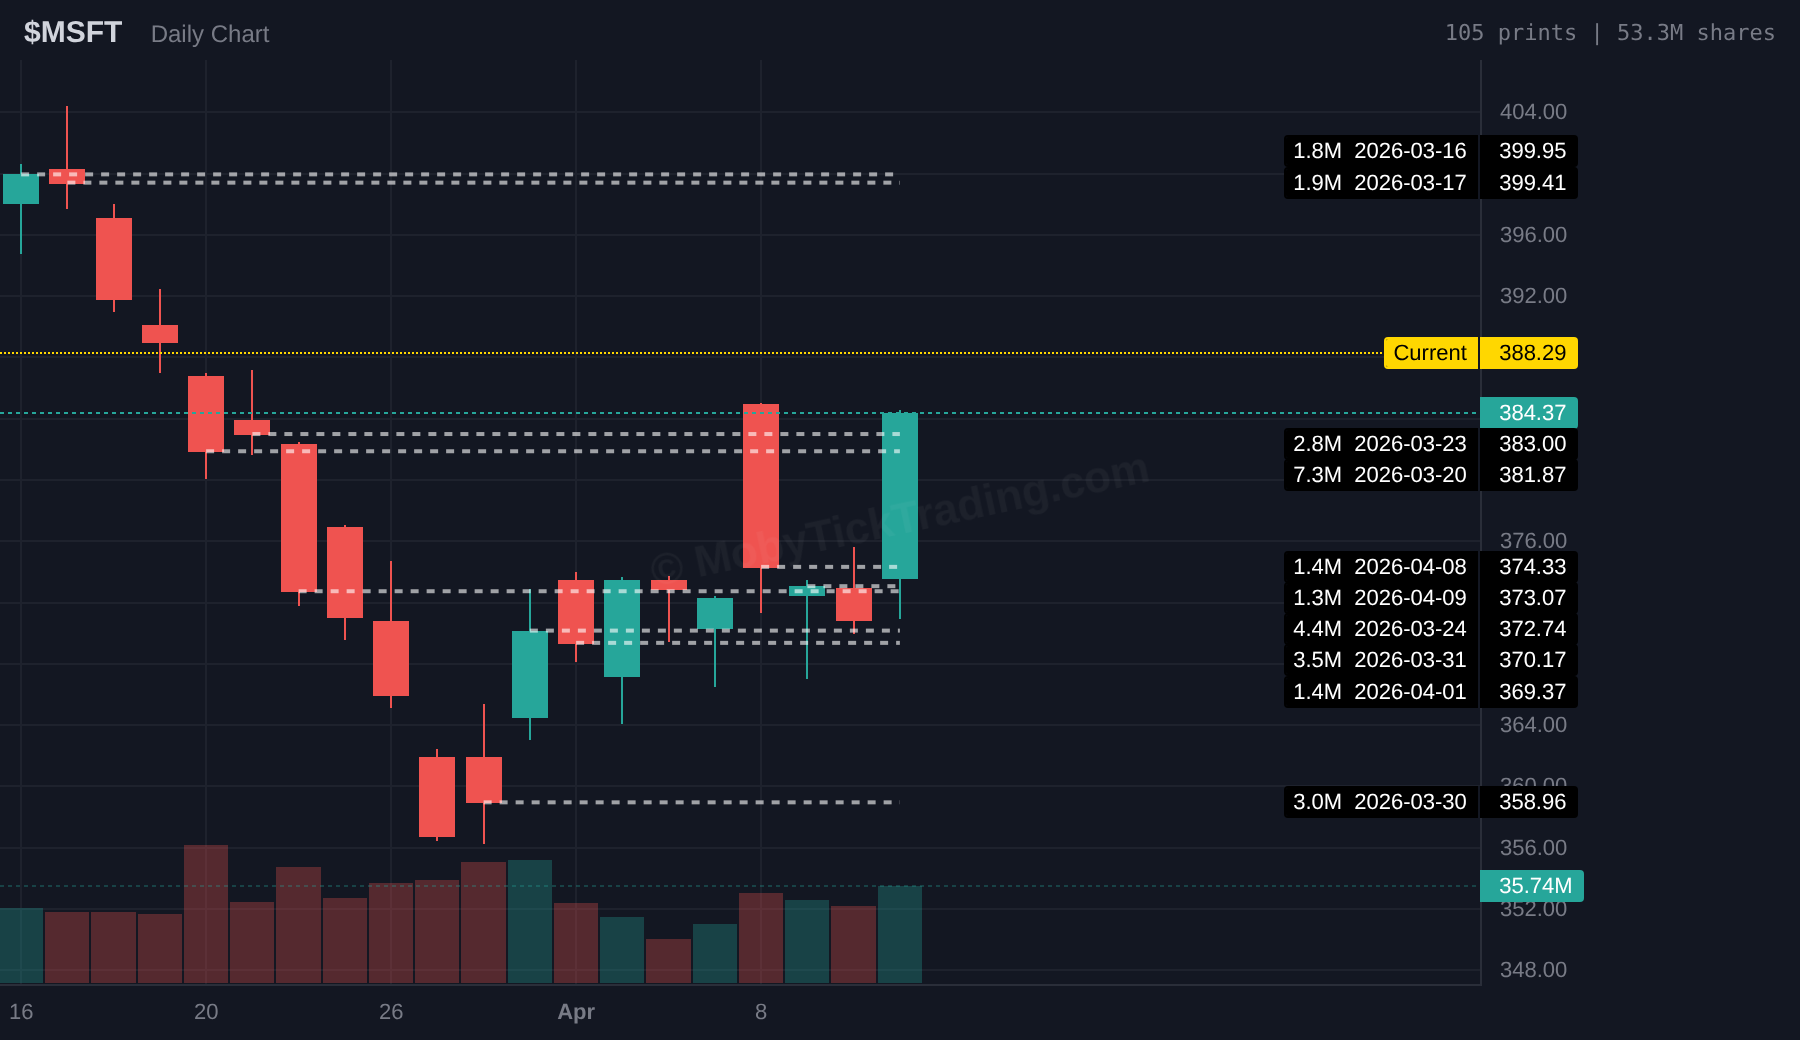
| MSFT | 7.3M shares | $381.87 | $2.77 billion | Largest print in 30 days |
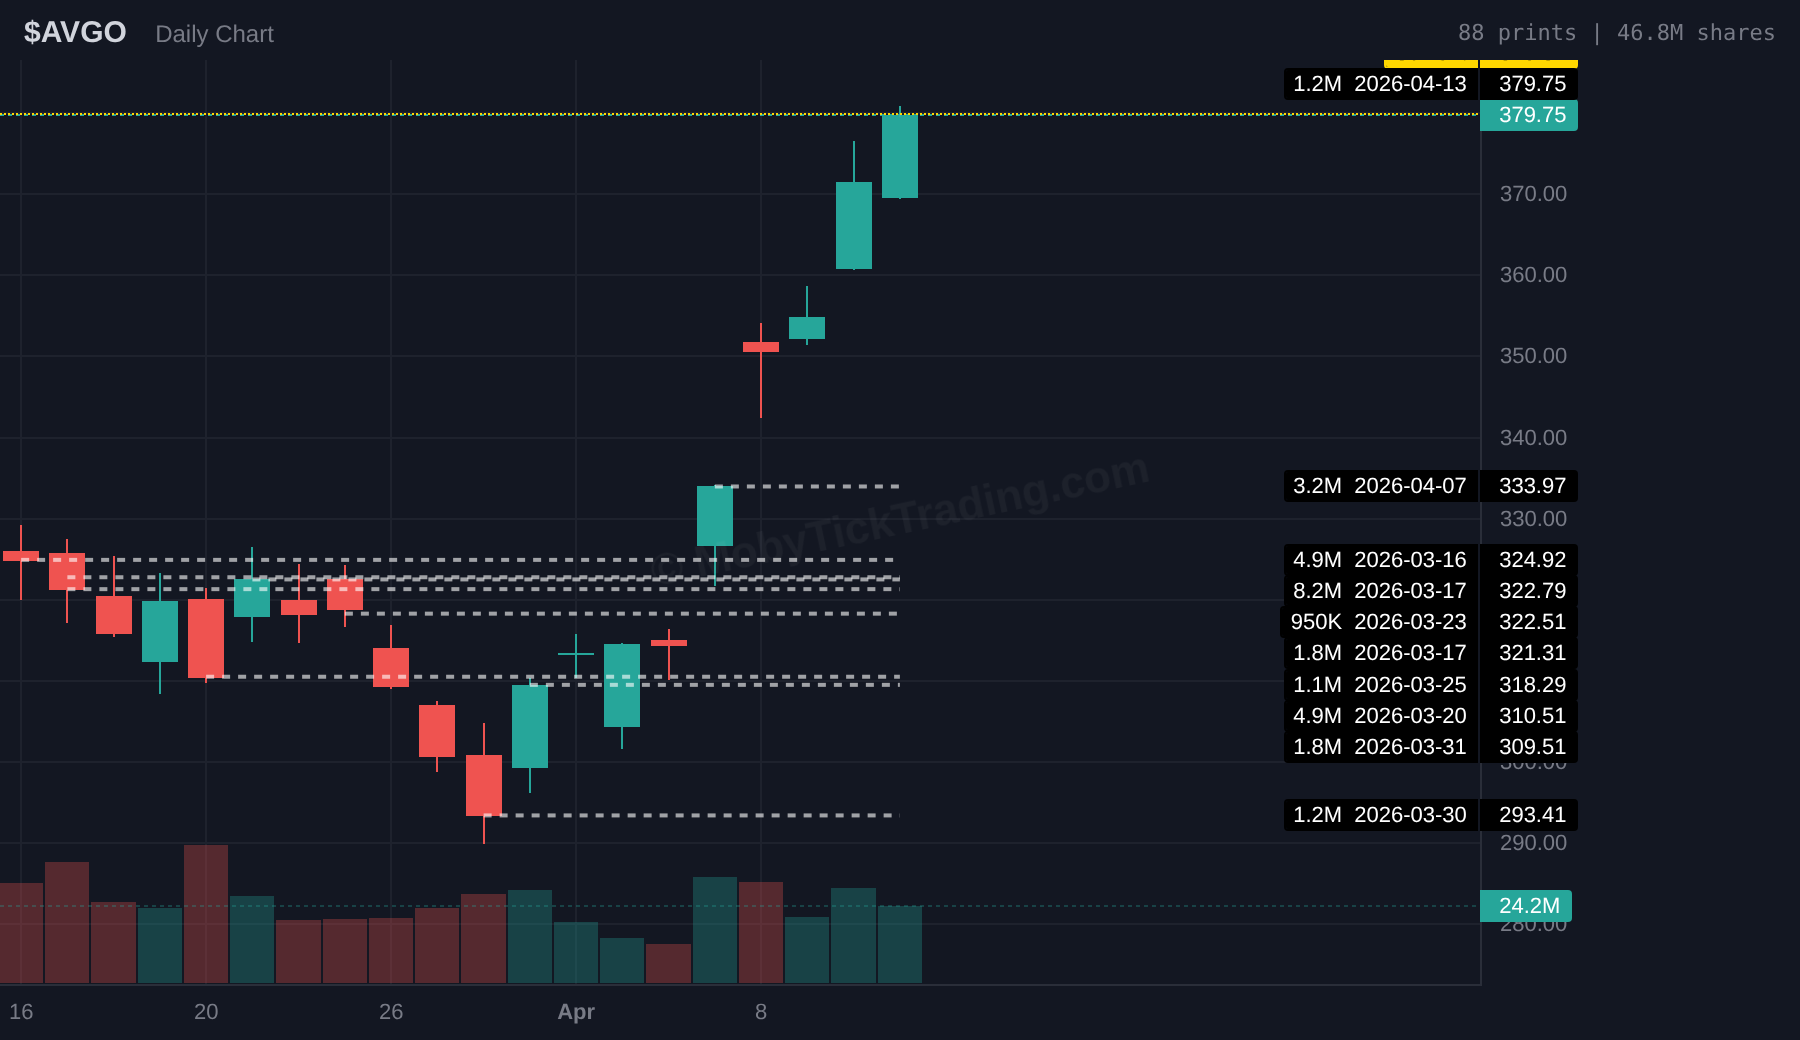
| AVGO | 8.2M shares | $322.79 | $2.64 billion | Largest print in 30 days |
| AMZN | 7.1M shares | $205.37 | $1.45 billion | Largest print in 30 days |
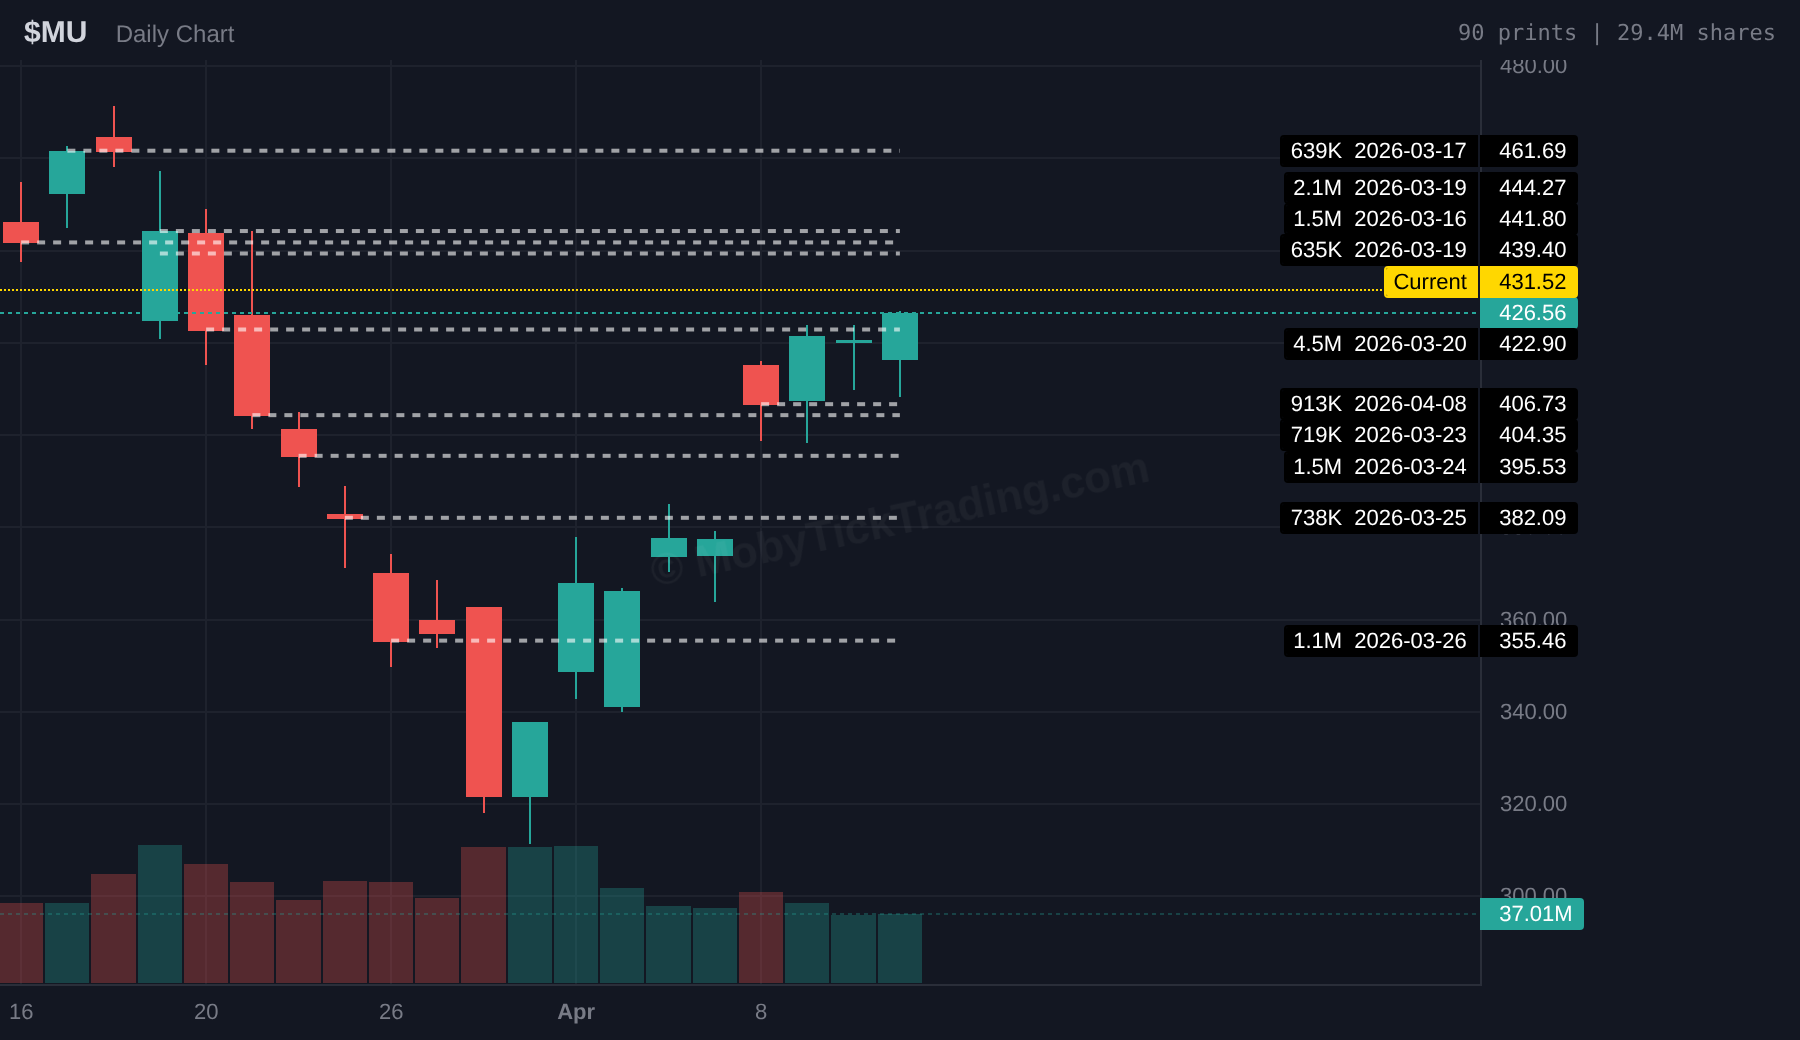
| MU | 4.5M shares | $422.90 | $1.92 billion | Largest print in 30 days |
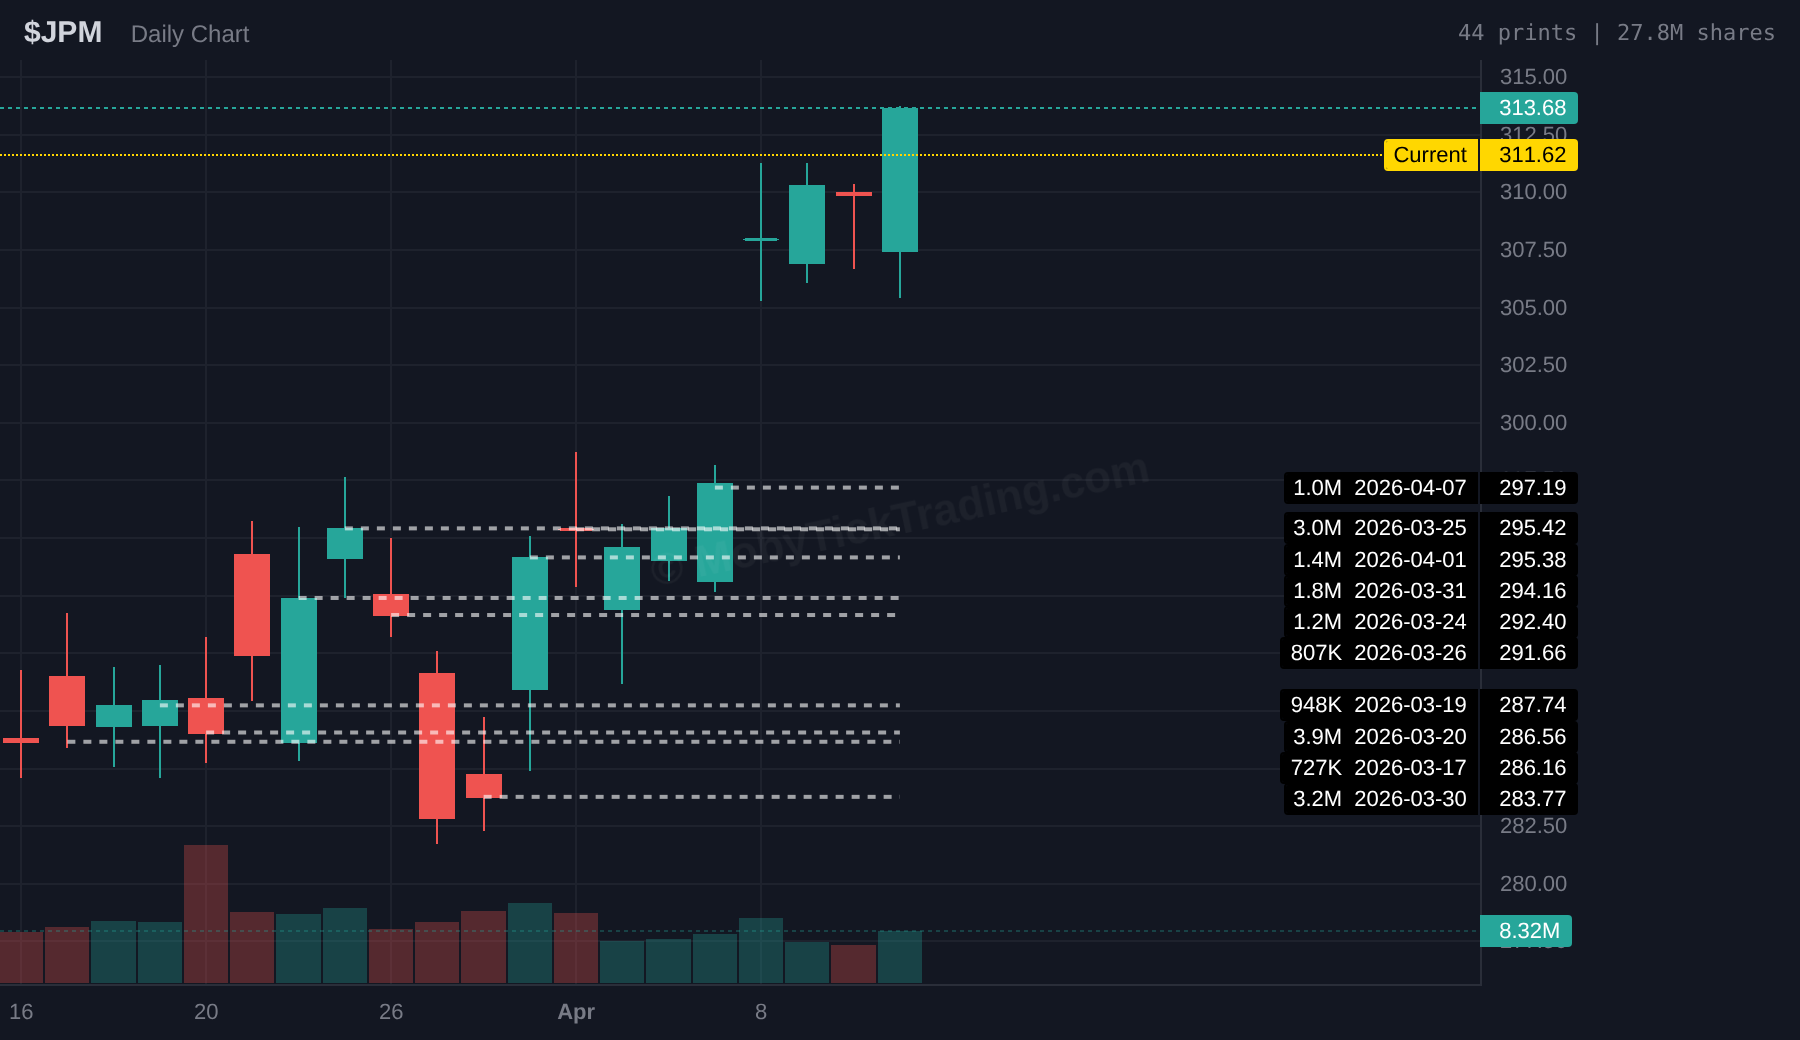
| JPM | 3.9M shares | $286.56 | $1.12 billion | Largest print in 30 days |
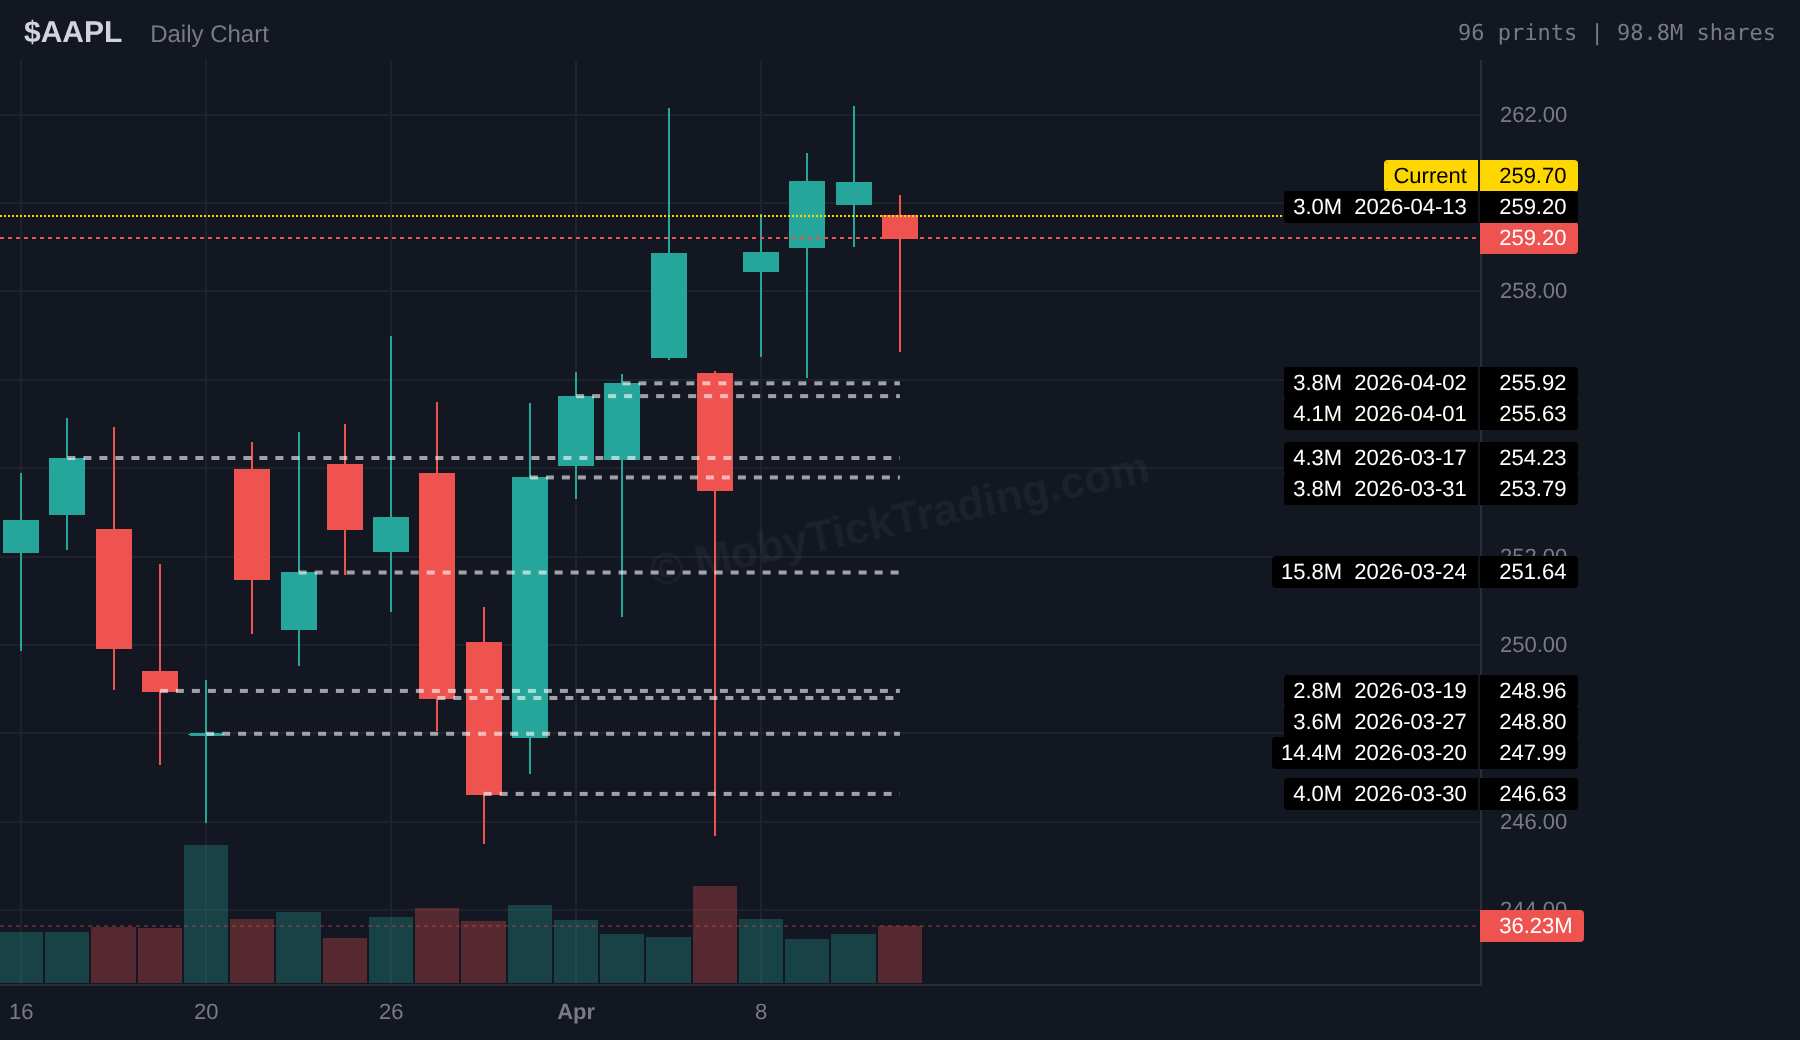
| AAPL | 15.8M shares | $251.64 | $3.98 billion | Largest print in 30 days |
Five of these eight stocks had their largest dark pool prints of the tracked period on the same day—March 20, 2026. That’s not coincidence. That’s coordinated institutional positioning. Dark pool analysis lets you see that signal before it becomes obvious on a price chart.
What to look for: Multiple large prints at similar price levels over days or weeks.
What it signals: Institutions are building positions at that level.
Real example — NVDA:
Over the 90-day period tracked, NVDA showed consistent dark pool prints clustering in the $172-$183 range:
This $172-$183 zone represents over $12 billion in institutional prints — the highest concentration of any level in the tracked period. As of April 14, NVDA trades at $190.63, above this zone. The dark pool data shows where institutions were positioned during the weakness; the current price shows where price has since moved.
What to look for: Heavy dark pool volume at specific price levels.
What it signals: Those levels have institutional backing — real capital has been committed there.
Real example — SPY:
The S&P 500 ETF (SPY) showed significant dark pool prints during the March 16-24, 2026 period of market weakness:
Two of the largest SPY prints in the 90-day window hit on the same day — March 20. Combined, they represent nearly $14 billion in institutional positioning. The $655-$670 zone became a significant reference area. As of April 14, SPY trades at $687.92 — above this zone.
What to look for: Surge in dark pool activity across multiple stocks in the same sector.
What it signals: Capital rotating into or within an industry.
Real example — Technology sector, March 16-20, 2026:
Five semiconductor and tech stocks showed their largest prints of the period on the same two days:
Total: over $12 billion in dark pool prints across five semiconductor stocks in a 4-day window. No single charting platform shows this — it’s only visible through dark pool data.
You need a platform that provides dark pool prints. Key options:
Not every dark pool print matters. MobyTick’s standard filters:
Look for:
Dark pool prints are most useful when you understand where current price sits relative to historical prints:
Is dark pool data legal?
Yes. All dark pool trades must be reported to FINRA within 10 seconds of execution under FINRA Rule 6272. Platforms like MobyTick aggregate this public regulatory data.
Does a large dark pool print mean a stock will go up?
No. A large print shows where institutions traded — not whether they bought or sold, or what they expect next. The data reveals positioning, not direction. This is why comparing where institutions traded versus current price matters: it shows where real money is relative to where price is now.
Why don’t standard charting platforms show dark pool data?
Dark pool data requires separate ATS licensing, infrastructure, and processing. Most charting platforms focus on public exchange data only.
What’s the difference between block trades and dark pool prints?
Block trades are large orders regardless of venue. Dark pool prints are specifically trades executed on Alternative Trading Systems. Both reveal institutional activity, but dark pools offer anonymity for the institution.
MobyTick provides institutional-grade dark pool intelligence designed for retail traders:
Pricing starts at $19.99/month.
Dark pool analysis gives retail traders visibility into the 30-40% of market activity that standard platforms miss entirely. The March 20 example above is a case study in why it matters: five major stocks showed their largest institutional prints of the 90-day period on the same day, during a period of market weakness. That signal — invisible on any public chart — was available to anyone with dark pool data.
The data doesn’t predict direction. But it shows you where real capital moved, at what levels, and when. For traders serious about understanding what institutions are doing, dark pool analysis is essential intelligence.
Try MobyTick free: mobyticktrading.com — real-time dark pool alerts, 6+ years historical data, accumulation signals across 10,000+ stocks.
Free weekly report: Subscribe to the MobyTick weekly dark pool report — institutional activity analysis delivered to your inbox.
Data verified against MobyTick API as of April 14, 2026. All dollar values represent aggregate dark pool print values from FINRA Trade Reporting Facility data. Charts generated via MobyTick dark pool visualization.
Keywords: dark pool analysis, institutional trading, block trades, smart money, accumulation zones, dark pool prints