Physical Address
304 North Cardinal St.
Dorchester Center, MA 02124
Physical Address
304 North Cardinal St.
Dorchester Center, MA 02124

Learn what dark pool data is, why it matters for retail traders, and how institutional block trades move markets. Real examples from recent market activity.
If you’ve been paying attention to market data, you’ve probably come across the term dark pool data — and wondered what exactly it means and whether it matters for your trading.
The short answer: it matters a lot. Understanding dark pool data may be one of the most useful edges a retail trader can develop in today’s market.
A dark pool is a private trading venue where institutional investors — hedge funds, mutual funds, pension funds, and other large organizations — execute trades without their orders being visible to the public before execution.
When you place a trade through your broker, it typically goes to a public exchange like the NYSE or Nasdaq. Your order joins the public order book, where everyone can see the price and size. That’s a lit exchange — transparent and visible.
A dark pool works differently. Large institutional orders are matched privately, away from public exchanges. The details — price, size, and counterparty identity — remain hidden until after the trade is completed and reported to FINRA.
This is where dark pool data comes from: the post-trade reports that eventually make these transactions visible.
Dark pools exist for one primary reason: size.
When a mutual fund needs to buy 500,000 shares of a stock, placing that order on a public exchange would immediately move the market. Other traders would see the large buy order, anticipate increased demand, and front-run the price upward. The institution would end up paying more per share than if they’d executed quietly.
Dark pools solve this problem. They allow large block trades to execute anonymously, without pre-trade information leaking to the broader market.
This benefits institutions executing the trades and contributes to overall market liquidity. Approximately 30-40% of all U.S. equity trading volume now occurs off-exchange — including dark pools and other Alternative Trading Systems.
Dark pool data refers to the reported information about trades that executed in dark pools. While the trades happen privately, U.S. regulations require that they be reported after execution through FINRA’s Trade Reporting Facilities (TRFs).
This data typically includes:
What dark pool data does not include:
The data is anonymous — but the information it contains is still extremely valuable for understanding where institutional money is flowing.
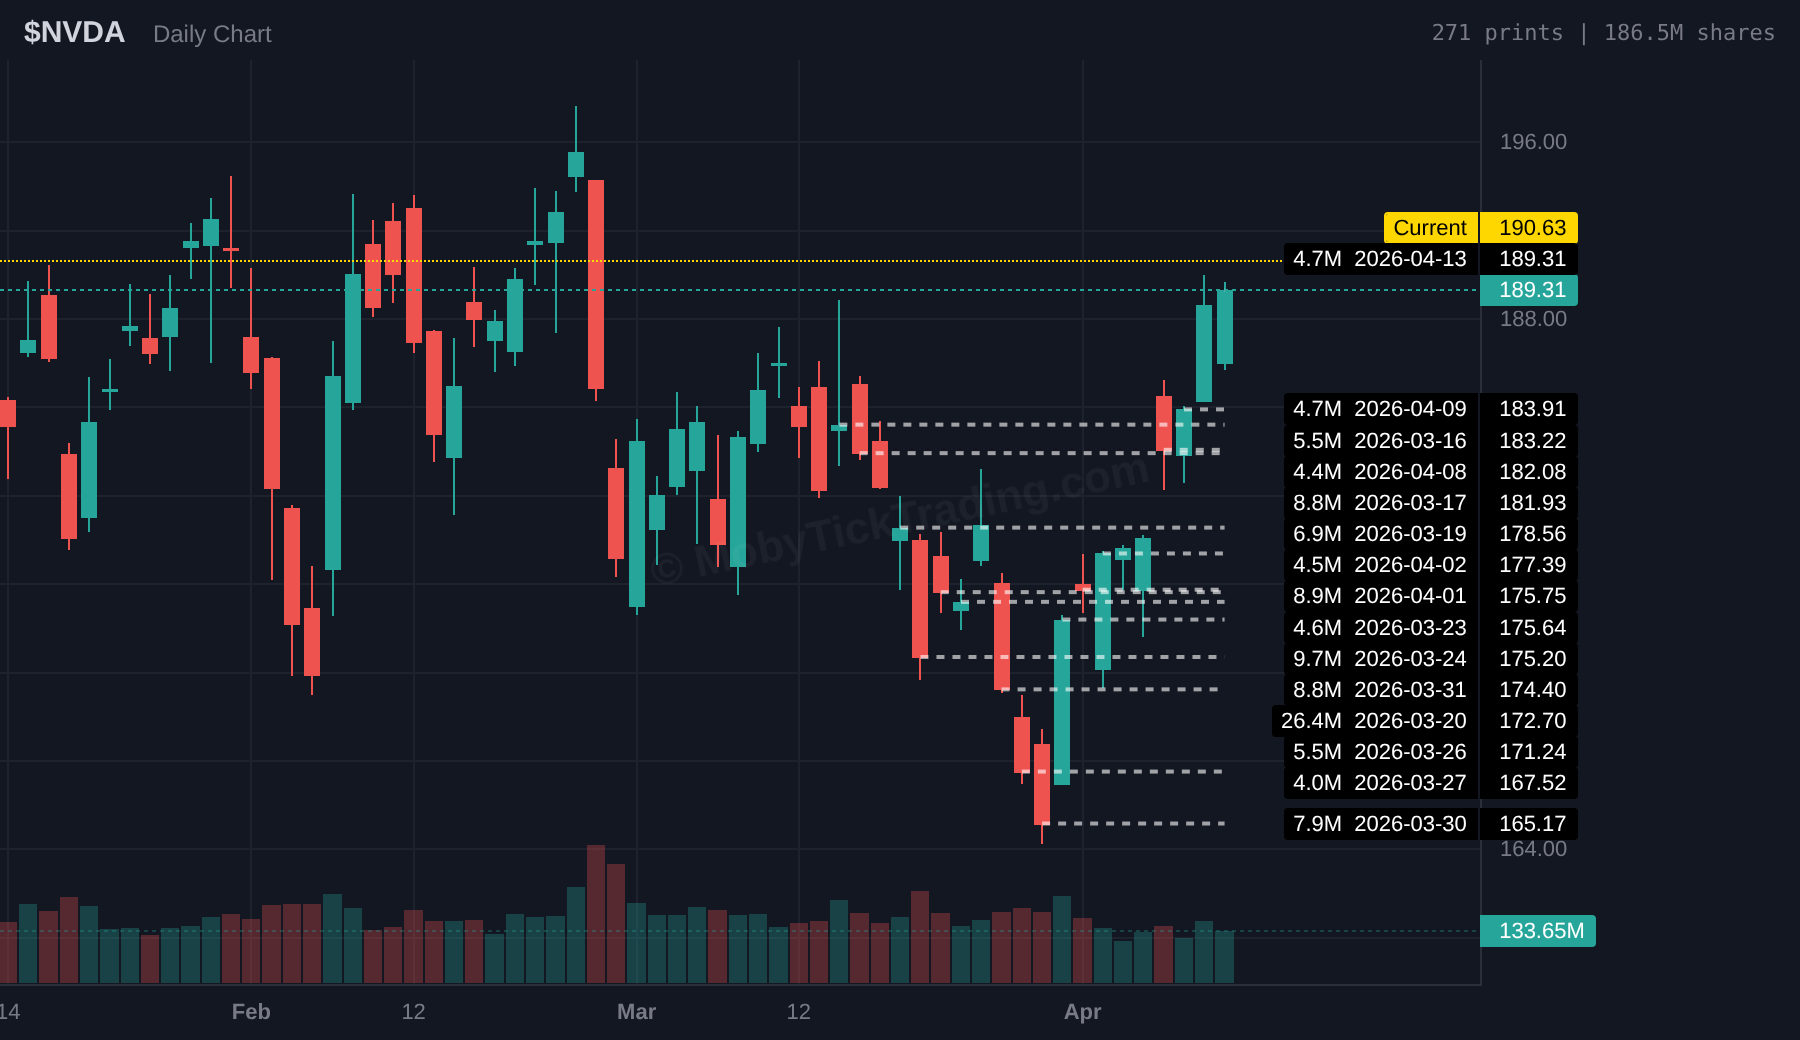
When you see a dark pool print of $4.55 billion in NVDA shares on a single day, that tells you something significant is happening at that specific level. Institutions aren’t randomly allocating billions — there’s always a thesis or a requirement behind it.
Dark pool data gives retail traders visibility into where the big money is positioning. While retail traders typically trade hundreds or thousands of shares, institutions move millions at a time. The magnitude alone makes these prints worth paying attention to.
Large block trades often execute at specific price levels that institutions consider important. These levels — identified through historical dark pool data — can become reference points for future price action.
When a $4.55 billion dark pool print executes at $172.70 in NVDA on March 20, that price becomes a known institutional reference level — a level backed by billions in committed capital, not just chart patterns.
The volume numbers you see on your trading platform often don’t tell the full story. Dark pool trades contribute to total volume, and in some stocks, dark pool volume can account for 30-40% or more of total daily activity.
When dark pool activity significantly exceeds normal levels for a particular stock, it often reflects increased institutional attention — whether that’s earnings repositioning, sector rotation, or portfolio rebalancing. Dark pool data gives you a head start on understanding what’s moving the market.
Here’s actual dark pool data from MobyTick’s database for the week of March 16-24, 2026 — verified through the API:
| Ticker | Shares | Price | Dollar Value | Date |
|---|---|---|---|---|
| NVDA | 26.4M | $172.70 | $4.55B | March 20 |
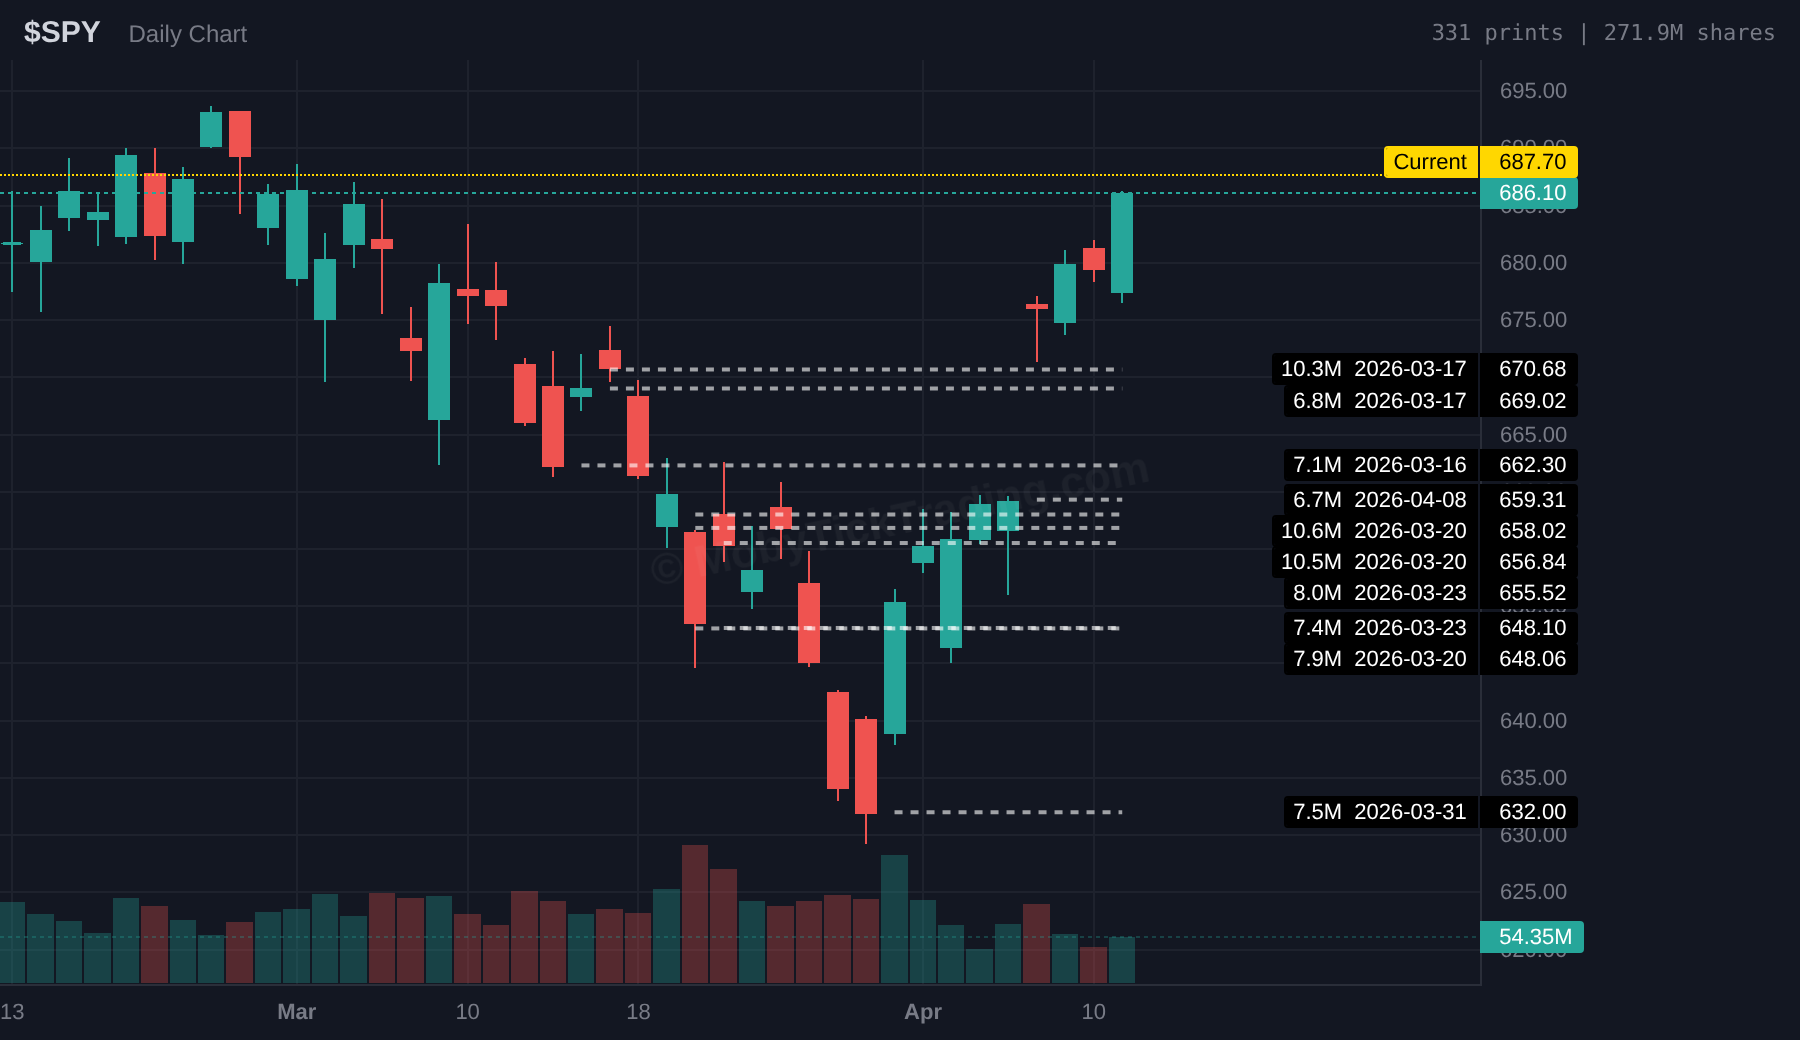
| SPY | 10.6M | $658.02 | $6.96B | March 20 |
| SPY | 10.3M | $670.68 | $6.92B | March 17 |
| AAPL | 15.8M | $251.64 | $3.98B | March 24 |
| MSFT | 7.3M | $381.87 | $2.77B | March 20 |
| AVGO | 8.2M | $322.79 | $2.64B | March 17 |
| MU | 4.5M | $422.90 | $1.92B | March 20 |
| AMZN | 7.1M | $205.37 | $1.45B | March 20 |
| JPM | 3.9M | $286.56 | $1.12B | March 20 |
Under current FINRA rules, Alternative Trading Systems must report trades within 10 seconds of execution through FINRA’s Trade Reporting Facilities. This means dark pool data is publicly available — the data isn’t hidden, it just requires specialized tools to access and interpret efficiently.
MobyTick aggregates this regulatory data from all reporting ATS venues, processes it, and delivers it to subscribers in real-time alongside 6+ years of historical archives.
The key question isn’t “is this print large?” but “is this print large relative to this stock’s normal activity?” A 1 million share print in Apple is routine. A 1 million share print in a mid-cap stock with 3 million shares of average daily volume is extraordinary.
Volume ratio — print size as a percentage of average daily volume (ADV) — is the most meaningful metric for identifying significant institutional activity.
When multiple large prints cluster at the same price level over days or weeks, that’s an accumulation zone. Institutions have demonstrated conviction at that level — it becomes a reference point worth tracking.
Dark pool data across multiple stocks in the same sector can reveal thematic institutional positioning. During the March 16-24 period above, semiconductor stocks (NVDA, MSFT, AVGO, MU) showed concentrated dark pool activity across the same few days — a pattern invisible on any single-stock chart.
| Standard Brokerage | Dark Pool Data (MobyTick) | |
|---|---|---|
| Coverage | Public exchange trades only | Public + off-exchange ATS prints |
| Institutional visibility | Indirect (via price impact) | Direct (actual execution data) |
| Historical depth | Limited | 6+ years |
| Stocks covered | All listed | 10,000+ |
| Real-time alerts | No | Yes |
MobyTick provides institutional-grade dark pool data to retail traders:
Is dark pool data legal?
Yes. Dark pools are SEC-regulated Alternative Trading Systems. All trades must be reported to FINRA and become public record. Platforms like MobyTick aggregate and present this publicly reported data.
Does dark pool data show who is trading?
No. Dark pools are designed to hide counterparty identity. You see ticker, price, share count, timestamp, and trade conditions — but not the specific institution.
Does dark pool data predict price direction?
No. A large dark pool print shows where an institution traded — not why, whether it was a buy or sell, or what they expect next. The data reveals positioning, not predictions.
What’s the minimum print size that matters?
For large-cap stocks, 100,000 shares may be routine. For mid-caps, 50,000 shares could be highly significant. Volume ratio (print size vs. ADV) is more meaningful than absolute size.
Dark pool data represents approximately 30-40% of all U.S. equity trading volume that standard platforms never show. That data is publicly available — it just requires the right tools to access and interpret.
The institutional players who move markets don’t operate in a vacuum. Their trades leave traces in dark pool data. A $4.55 billion NVDA print at $172.70, a $6.96 billion SPY print at $658.02 — these are verifiable data points that reveal where real money was committed.
For traders who want to see the full picture — not just what happens on public exchanges — dark pool data is essential intelligence. The question isn’t whether institutional money is moving. It’s whether you can see where.
Ready to access dark pool data? Visit MobyTick Trading for a free trial. Track 10,000+ stocks with 6+ years of historical dark pool data and real-time alerts.