Physical Address
304 North Cardinal St.
Dorchester Center, MA 02124
Physical Address
304 North Cardinal St.
Dorchester Center, MA 02124

Learn how to use dark pool data in a practical trading workflow, from sector scans and ticker selection to chart levels and watchlist ranking.
Using dark pool data in a trading workflow is different from simply understanding what a print means. The practical question is how to fit institutional activity into screening, chart review, watchlist building, and actual trade selection without letting it become random confirmation bias.
Dark pool data is most useful when it helps answer practical questions: where were institutions active, is the activity unusual versus normal history, and does that activity line up with broader sector or chart context? That is the frame this guide uses.
Retail traders get into trouble when they treat a dark pool print like a magical buy or sell signal. A better use is understanding where executed size actually happened, then combining that with normal charting, sector context, and disciplined trade selection.
A trader can understand what dark pool data is and still use it badly. Workflow means deciding when to check it, what qualifies as meaningful, how it changes your watchlist, and where it fits relative to charts, sector context, and catalysts.
Most of the time, dark pool activity is best used to prioritize attention. It can tell you which names deserve deeper work, which sectors are seeing unusual participation, and where price levels may matter more than they appear on a simple chart.
Institutional context becomes valuable when it reduces noise. The best workflow does not force a trade. It helps a trader ignore weaker names and focus on the setups where institutional activity, sector context, and chart structure line up.
The public chart is only part of the story. Dark pool data helps reveal where larger participants were active away from the public order book. That can matter because institutions often build or unwind positions in ways that do not show up clearly on a standard chart until later.
Used well, dark pool data helps traders prioritize names, identify better support and resistance context, and notice sector rotation earlier. Used badly, it just becomes another source of overconfidence. The difference is process.
Begin each session by checking which sectors and tickers show elevated dark pool activity. This creates a shortlist. You are not trying to analyze everything in the market. You are trying to identify where institutional participation is unusually active right now.
Example: If technology and financials are quiet but one sector lights up, that sector deserves deeper work before you start browsing isolated charts.
This matters because traders who use using dark pool data for trading well are usually building context, not chasing noise. The goal is to let institutional activity improve your process before a move becomes obvious on a simple chart.
Once a sector stands out, drill into the specific names showing the strongest unusual activity or repeated print behavior. This keeps your process top-down rather than reactive. It also reduces the chance that you overinterpret one stock with no broader context behind it.
Example: If the sector ETF is active and two related stocks also show repeated prints, those names belong near the top of your watchlist.
This matters because traders who use using dark pool data for trading well are usually building context, not chasing noise. The goal is to let institutional activity improve your process before a move becomes obvious on a simple chart.
When you find repeated dark pool activity around similar prices, map those levels onto your chart. This is where dark pool data becomes useful for execution planning. You are turning reported institutional activity into price zones you can monitor.
Example: A cluster zone near a prior breakout or consolidation base is often more useful than a level that exists only because it looks visually neat.
This matters because traders who use using dark pool data for trading well are usually building context, not chasing noise. The goal is to let institutional activity improve your process before a move becomes obvious on a simple chart.
Institutional context is not static. New prints can reinforce a zone or make the setup less interesting. Use each new session to ask whether the activity is still building, rotating elsewhere, or losing its relative significance.
Example: A name that keeps attracting prints while peers remain active is usually stronger workflow material than one that flashed once and went quiet.
This matters because traders who use using dark pool data for trading well are usually building context, not chasing noise. The goal is to let institutional activity improve your process before a move becomes obvious on a simple chart.
When several names look similar technically, dark pool context can help rank them. Prefer the setups with cleaner cluster zones, stronger relative activity, and better sector confirmation instead of treating all chart setups as equal.
Example: Two stocks may both be near support, but the one with recent repeated institutional activity usually deserves higher priority.
This matters because traders who use using dark pool data for trading well are usually building context, not chasing noise. The goal is to let institutional activity improve your process before a move becomes obvious on a simple chart.
A good workflow includes feedback. After a move, check whether the dark pool activity helped identify the right zone, the right name, or the right sector theme. This is how dark pool data becomes part of a disciplined process rather than a collection of anecdotes.
Example: If a trade worked because price respected an institutional cluster, save that example and compare it with similar setups later.
This matters because traders who use using dark pool data for trading well are usually building context, not chasing noise. The goal is to let institutional activity improve your process before a move becomes obvious on a simple chart.
Dark pool data can narrow a long watchlist into a small group of names where institutional participation is actually elevated, making your prep more focused and less noisy.
What makes this practical is that the same logic can be checked across ticker pages, sector pages, and broader heatmap activity instead of forcing every name into the same simplistic interpretation.
Once a cluster zone is mapped onto the chart, you can monitor whether price respects that area instead of trading from generic support and resistance alone.
What makes this practical is that the same logic can be checked across ticker pages, sector pages, and broader heatmap activity instead of forcing every name into the same simplistic interpretation.
Looking back at how price behaved after a cluster formed helps you refine which kinds of dark pool setups are actually useful in your own process.
What makes this practical is that the same logic can be checked across ticker pages, sector pages, and broader heatmap activity instead of forcing every name into the same simplistic interpretation.
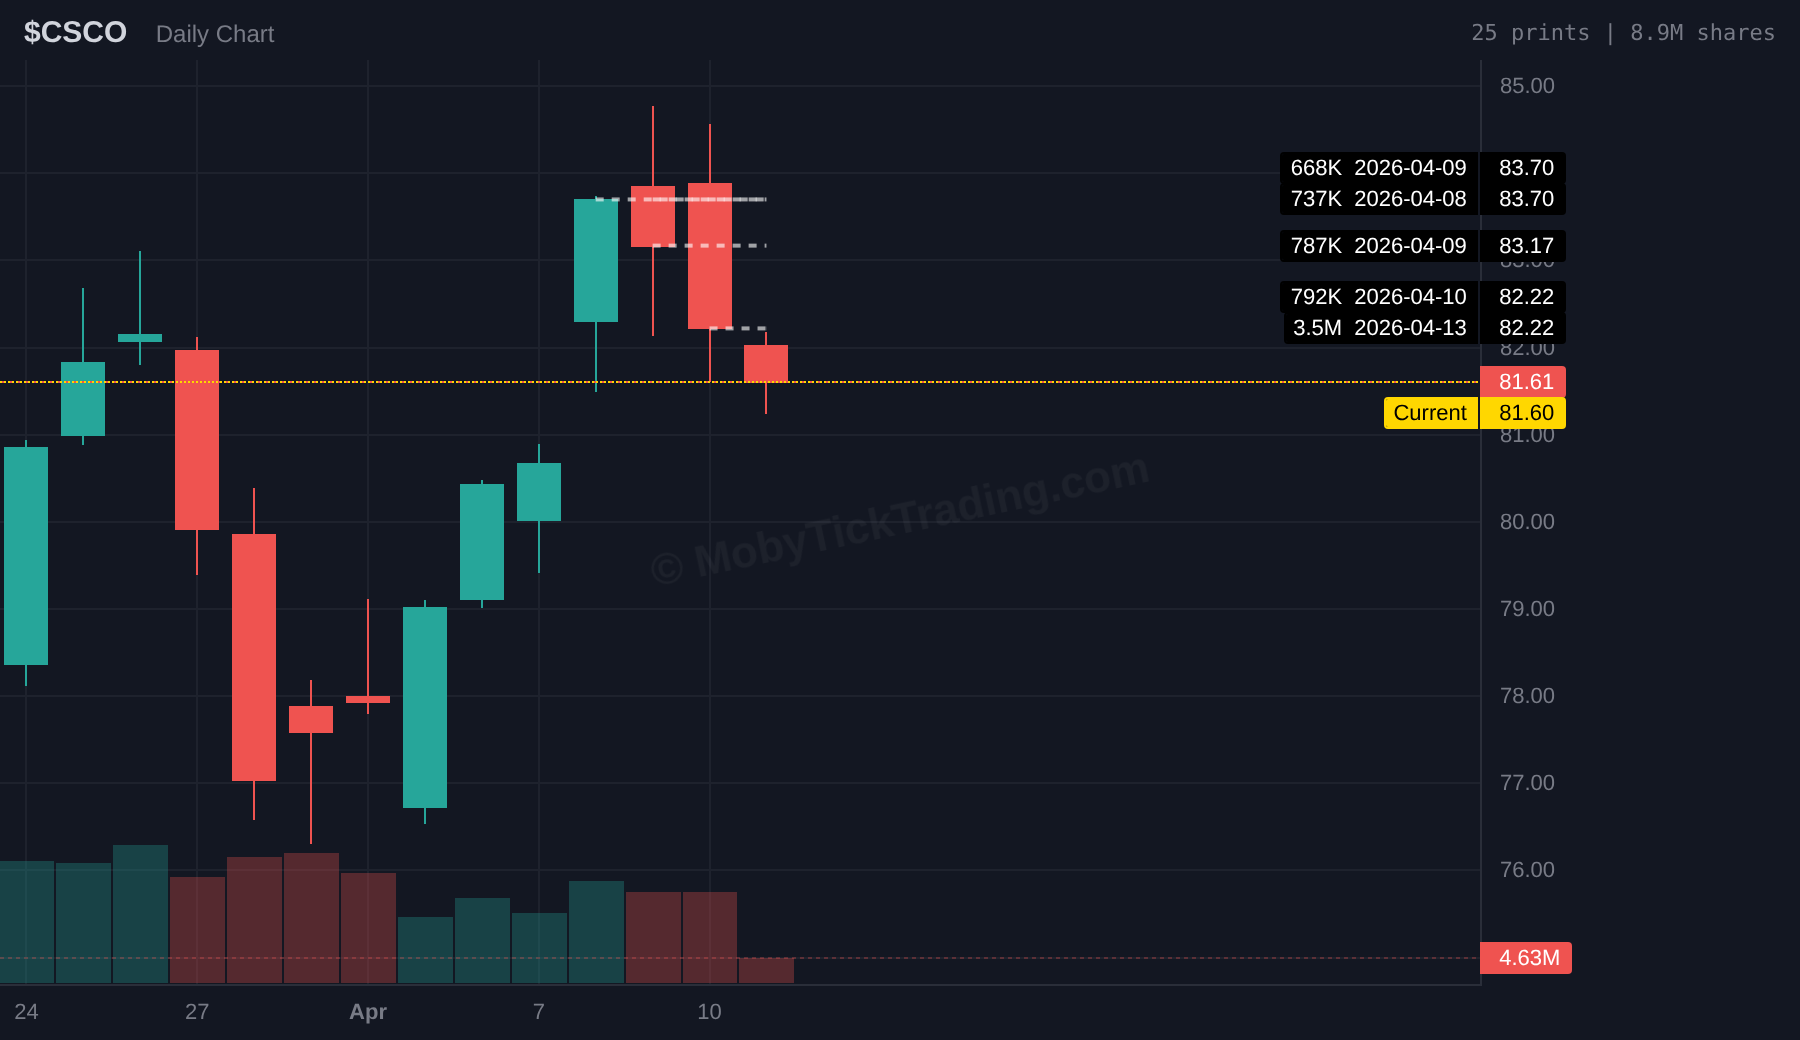
This CSCO example fits the workflow framing well: first identify unusual activity, then mark the institutional levels, then compare current price behavior against those zones before making any decision.
Most mistakes come from trying to force certainty out of data that is really best used as context. That is why the strongest workflows combine institutional activity with ordinary trade planning instead of replacing it.
These are simple habits, but they are what keep dark pool data useful. Without process, traders tend to turn institutional context into random confirmation bias.
Start on DarkPoolHeatmap.com to see which sectors are elevated. Then move into ticker pages to inspect recent print activity and relative context. If a name keeps showing up with unusual activity, mark the main levels and compare them to your chart.
That process works better than randomly browsing prints because it gives you a top-down filter: sector first, ticker second, levels third, execution last.
Where should dark pool data sit in my process?
Usually between scanning and execution. It works best as a filter and context layer before you decide which setups deserve your actual risk.
Should dark pool data override my chart?
No. It should improve how you read the chart, not replace your chart, timing, or risk management framework.
What is the easiest workflow to start with?
Check the heatmap for elevated sectors, inspect the most active ticker pages, mark the main cluster zones, and then compare those levels with your normal chart setup before making any decision.
Using Dark Pool Data in Your Trading Workflow becomes useful when it helps you understand where institutions were active and how unusual that activity really is. The data is not the trade. It is the context that helps you make better decisions before the trade.
If you build that habit, dark pool data becomes a filter for better watchlists, cleaner level identification, and stronger trade context. If you skip the process, it turns into noise very quickly.
See live institutional activity for free on DarkPoolHeatmap.com, or start your MobyTick trial if you want deeper history, alerts, and a stronger institutional workflow.
Want more dark pool education and weekly institutional context? Subscribe to the free weekly report.