Physical Address
304 North Cardinal St.
Dorchester Center, MA 02124
Physical Address
304 North Cardinal St.
Dorchester Center, MA 02124

A block trade scanner sounds simple enough: find big trades, follow the big money, profit.
That is also how traders end up talking themselves into nonsense.
The useful version of a block trade scanner is not a machine that tells you what smart money knows. It is a tool that helps you identify where meaningful size showed up, whether that size is unusual, and whether it fits into a broader institutional context.
That is a much better job description.
A block trade scanner is a tool that surfaces unusually large trades so traders can inspect where significant capital was active.
Depending on the product, it may track:
The goal is not just to show big numbers. The goal is to help you answer:
A large trade in a mega-cap ETF may be routine. A smaller trade in a thinner name may be much more interesting. Relative context always beats raw shock value.
One block can be noise. Multiple blocks in the same area often matter more.
Share count alone is sloppy. Notional size gives you a better read on actual capital.
If multiple names in the same sector are active, the story gets stronger.
A big trade near a key chart zone usually matters more than a random print in empty space.
The strongest use case for a block trade scanner is triage. It helps you move from a huge universe of names down to a short list worth actual research.
That means the scanner is best used before conviction, not after. It should tell you where to look harder, not what to believe automatically.
If you use it well, it improves:
If you use it badly, it becomes a dopamine feed of giant prints with no framework around them.
One of the easiest ways to make a scanner useful is to look at a real session and rank the biggest single prints. The chart already embedded below does that for our internal 2026-04-10 flow snapshot.
Three details matter immediately:
That matters because it shows a scanner often surfaces ETF and index positioning just as often as single-name conviction. A trader who ignores that will misread the feed and assume every large print is a stock-specific thesis.
In practice, this means the scanner should push you to ask a second question after the first alert:
Is this broad exposure, sector rotation, or single-name institutional positioning?
That second question is where the real work begins.
The biggest mistake is treating every large trade like a directional prediction.
A block can reflect many things:
That means a block trade scanner is best used as an institutional context tool, not a yes/no signal generator.
Start with the names where block activity stands out versus normal behavior.
If related names are moving too, the broader institutional story gets more interesting.
Repeated block activity around the same level is often more useful than one giant isolated print.
A scanner becomes useful when it improves your price-level work, not when it becomes a separate entertainment feed.
Use the data to rank setups and focus time. Do not hand over your brain to the scanner.
A one-day scanner view is helpful, but historical context is where the signal gets sharper. If a name shows one large print today, that is interesting. If it shows repeated institutional participation in the same band over multiple sessions, that starts to look like a level that matters.
This is where traders can separate random large prints from genuine institutional zones. History turns a scanner from a feed into a research tool.
These are related, but not identical.
A strong workflow often uses both ideas together.
Dark pool data gives you institutional context. Block trade scanning helps surface where size stands out.
DarkPoolHeatmap.com is a strong free entry point for seeing where sectors and names are active.
MobyTick Trading is the better fit when you want deeper historical context, repeated price-zone analysis, and a fuller institutional workflow around dark pool and block-trade behavior.
A block trade scanner is useful when it helps you find where size matters, which names deserve attention, and which price zones may matter more than they first appear.
It becomes useless when it turns into a giant-print dopamine machine.
Use it to improve your process, not replace it.
Start with DarkPoolHeatmap.com for free discovery, then use MobyTick Trading when you want deeper historical institutional context.
A block trade scanner gets more useful when you can show the actual size distribution instead of just talking about “large prints” in the abstract. The chart below ranks the largest single reported prints from our 2026-04-10 internal flow snapshot.
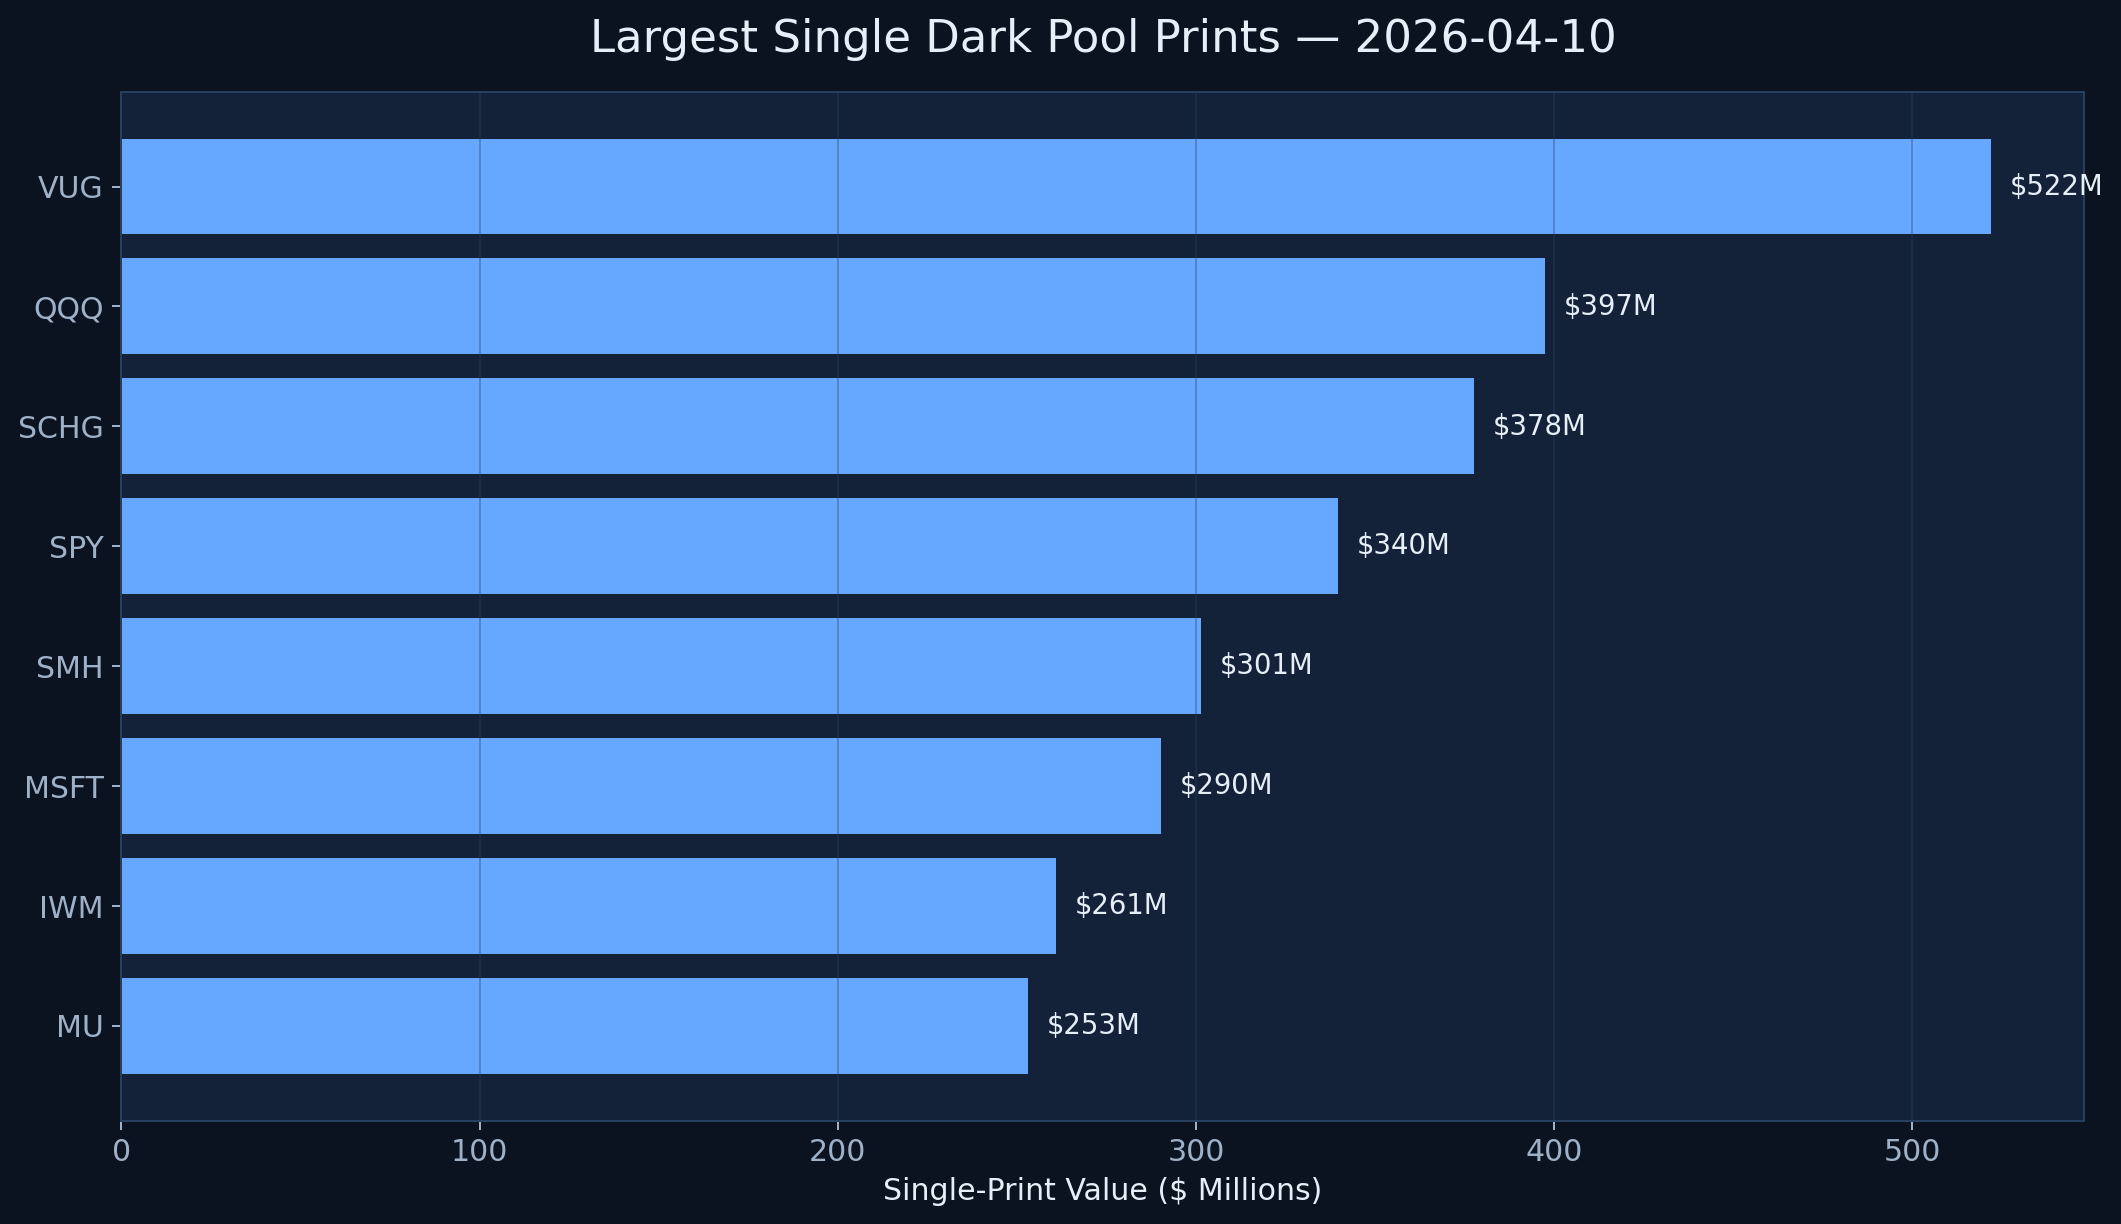
This matters because the scanner should not just show what is large. It should show what is large in context. On this session, the biggest single print was QQQ at about $522M, followed by SPY around $397M and MSFT around $290M. That tells you immediately that large-print scanning often captures ETF and index positioning as much as stock-specific conviction.
The practical takeaway is that a block trade scanner works best when it helps you sort large prints by relevance, not when it turns every oversized print into a dramatic narrative.