Physical Address
304 North Cardinal St.
Dorchester Center, MA 02124
Physical Address
304 North Cardinal St.
Dorchester Center, MA 02124

If you are a retail trader looking for institutional trading data, you are probably trying to solve a simple problem:
You want to know where the large participants are active before the move becomes obvious to everybody else.
That is a reasonable goal. The bad news is that the phrase “institutional trading data” gets stretched to cover everything from dark pool prints to options flow to insider filings to completely made-up smart money dashboards.
The good version is much simpler.
Retail traders do not need every dataset on Wall Street. They need a clean workflow that helps answer a few practical questions:
That is the framework this guide uses.
Institutional trading data is any dataset that helps reveal how larger market participants are active in the market.
Depending on the workflow, that can include:
For most retail traders, though, the most useful subset is the one closest to actual executed stock activity.
That is why dark pool data and block-trade context matter so much. They show you where size was actually reported, not where someone on the internet guessed institutions might be interested.
Most retail traders do not need more noise. They need fewer blind spots.
Without institutional context, you are mostly left with:
Institutional trading data adds a missing layer. It helps explain where large capital was active, how concentrated that activity was, and whether several names or sectors were participating together.
That is not a crystal ball. It is a much better ranking system.
Dark pool data is one of the cleanest institutional datasets for stock-focused retail traders because it captures reported off-exchange activity in individual names.
It becomes most useful when you can see:
Big blocks matter because they often represent meaningful capital deployment. But like all institutional data, context matters more than the headline number.
One isolated trade is interesting. Repeated large activity in the same zone is more useful.
Institutions often move through sectors before the narrative becomes obvious. If multiple related names start showing elevated activity together, the broader theme may matter more than the individual ticker.
Historical depth is one of the biggest separators between gimmicky tools and useful ones. Institutional activity becomes more actionable when you can compare today with prior activity and see whether the same zones keep getting defended or revisited.
The chart already embedded below is a good example of how institutional trading data becomes practical. It compares current price with a 30-day institutional average across names like NVDA, SPY, QQQ, AAPL, and CSCO.
That matters because it gives a trader a better question than “is this stock up or down?” Instead, it lets you ask:
For example, NVDA sitting roughly double-digit percentage points above its recent institutional average tells a very different story from AAPL sitting much tighter to its own average. That is not a prediction by itself, but it is a more informed way to think about extension and context.
Before diving into names, look for where institutional participation is clustering. This keeps the process top-down.
Once the sector is clear, identify the names with the strongest unusual activity or repeated zones.
Ask whether the activity is recurring, building, or just a one-day spike.
Institutional context matters most when it sharpens your normal chart workflow instead of replacing it.
The best use of institutional trading data is deciding what deserves deeper work first.
A lot of “institutional trading data” products are really just attention traps.
Be skeptical of:
If the platform cannot explain where the signal comes from, it probably is not a signal.
If you are just starting, a free utility tool can do a lot. DarkPoolHeatmap.com is a clean place to scan sectors, see which names are elevated, and decide where deeper work is worth your time.
If you want broader coverage, more historical research, recurring institutional level analysis, and a stronger dark-pool-focused workflow, MobyTick Trading is the better step up.
That is the right ladder. Start simple, then go deeper if the workflow keeps paying for itself.
Retail traders do not need a thousand institutional datasets. They need a clean process for seeing where large participants are active, whether that activity is unusual, and which names or sectors deserve more attention.
The most practical institutional trading data workflow usually starts with:
If you want a fast, free starting point, start with DarkPoolHeatmap.com.
If you want deeper institutional context, historical research, and a workflow built around dark pool and block-trade analysis, use MobyTick Trading.
That is how institutional trading data becomes useful to retail traders instead of turning into just another noisy buzzword.
Institutional trading data is easier to understand when it is tied to a practical reference level. The chart below compares current price to the 30-day institutional average from our ticker context workflow for five names: NVDA, SPY, QQQ, AAPL, and CSCO.
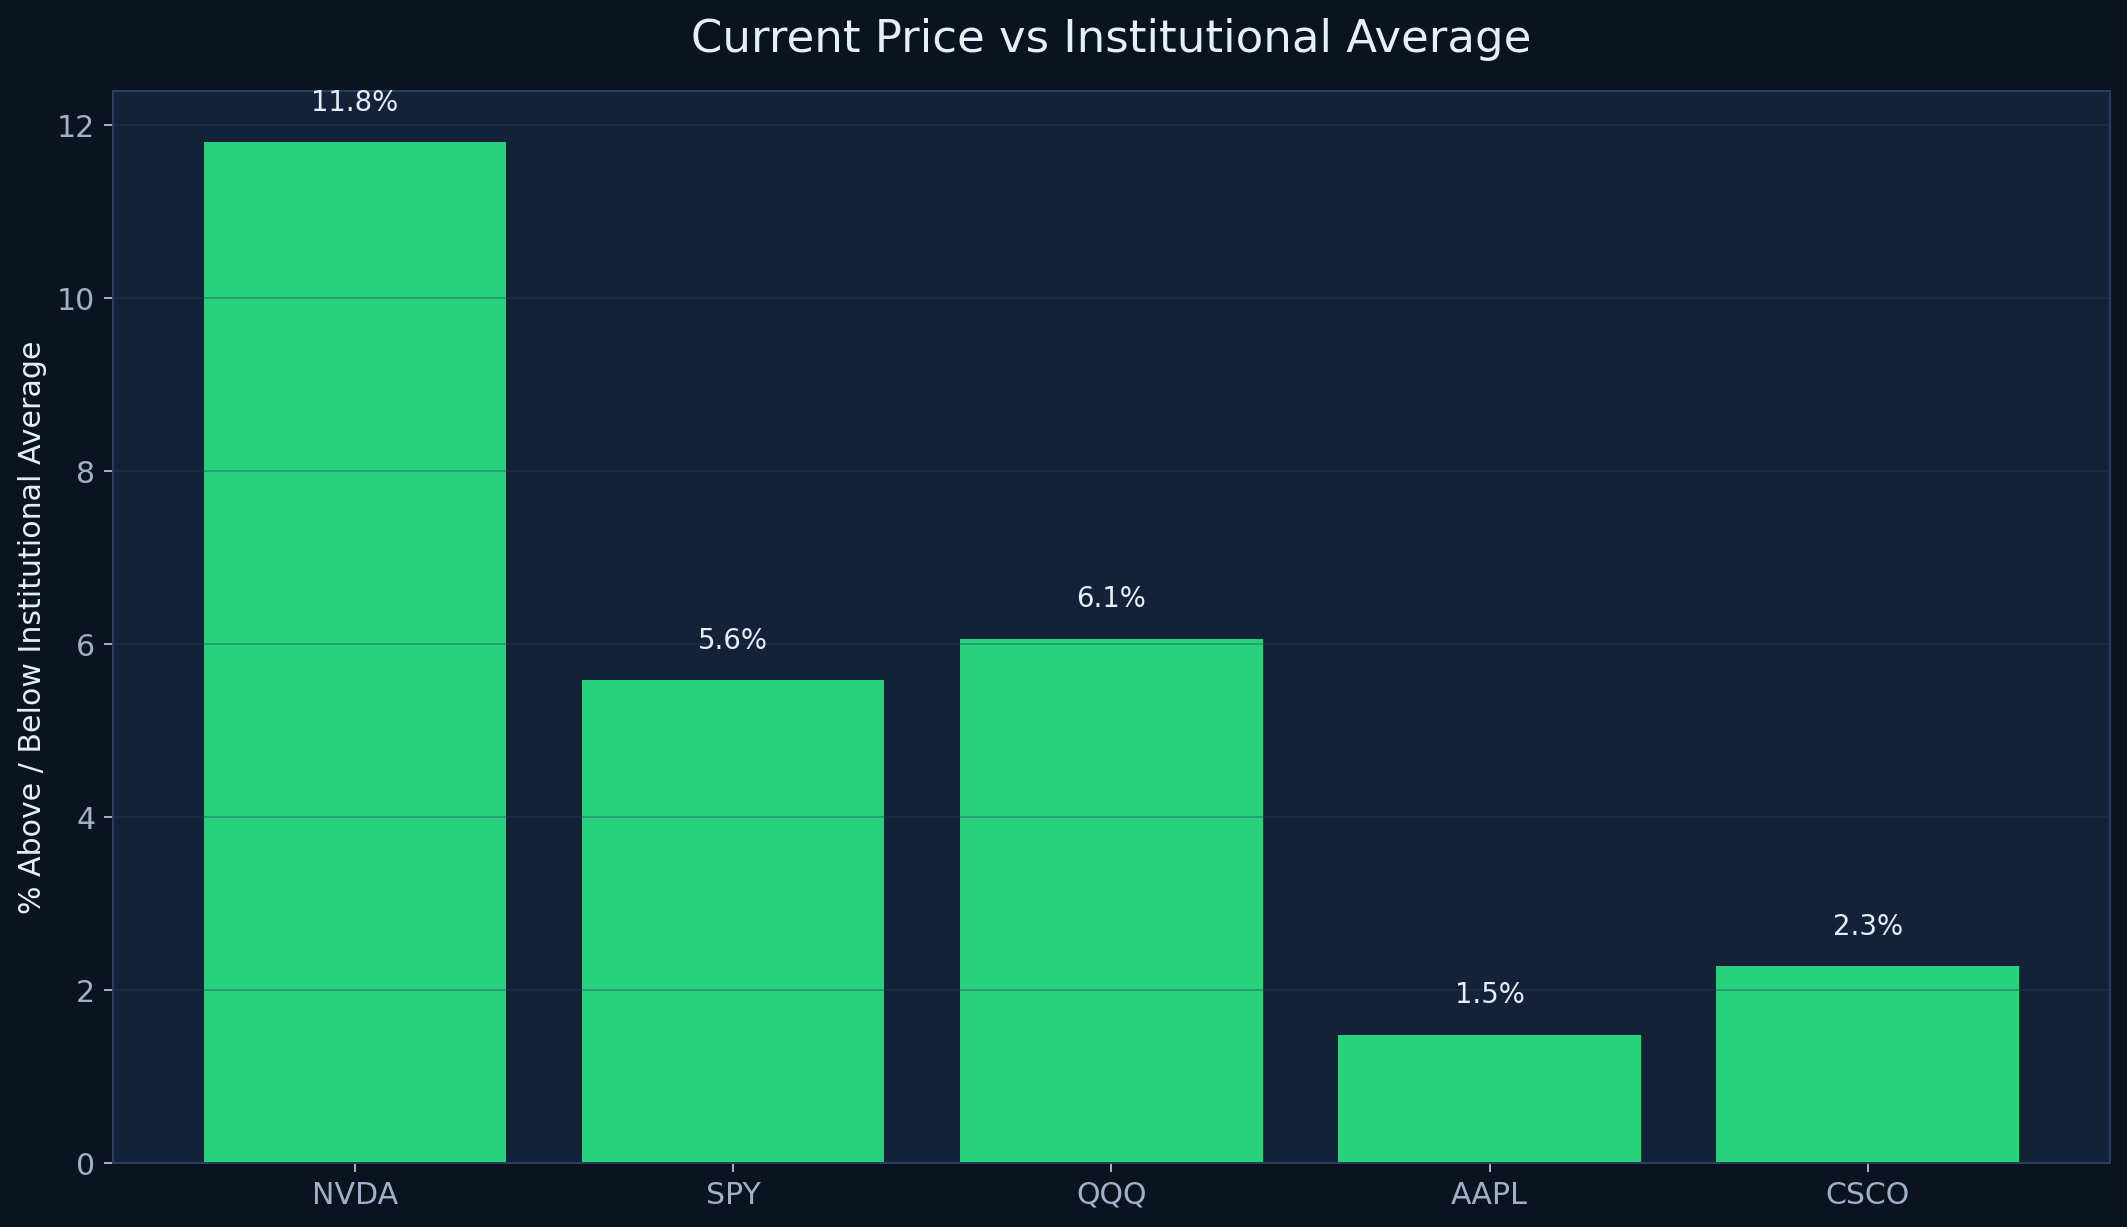
This is a useful example because it shows how institutional data becomes actionable without becoming predictive theater. NVDA is trading roughly 11.8% above its 30-day institutional average, while SPY and QQQ are about 5.6% and 6.1% above theirs. AAPL is much tighter at about 1.5%, which tells a very different story about where price sits relative to recent institutional participation.
The point is not that price must snap back to the average. The point is that institutional trading data gives retail traders a cleaner way to judge whether price is extended, sitting near prior participation, or moving well above recent institutional cost zones.