Physical Address
304 North Cardinal St.
Dorchester Center, MA 02124
Physical Address
304 North Cardinal St.
Dorchester Center, MA 02124
A volatile, holiday-shortened week (markets closed Friday for Juneteenth) ended with a powerful Thursday rally that erased a hawkish-Fed selloff. The S&P 500 closed at 7,500.58 (+0.9% on the week), the Nasdaq Composite at 26,517.93 (+2.4%), and the Dow at 51,564.70 (+0.7%). Wednesday’s FOMC hold — with half of officials signaling at least one rate hike may still be warranted in 2026 — sparked a sharp midweek drop, but Thursday’s broad recovery reclaimed the losses and then some.
Two catalysts drove the turn. First, a US-Iran interim peace deal reopened the Strait of Hormuz, pulling WTI crude down roughly 20% from its conflict peak and removing a major energy-supply overhang. Second, a Trump-announced Intel-Apple domestic chip deal lit a fire under semiconductors — Intel surged 10.6% and the Philadelphia Semi Index hit a record high. That semis resurgence is written all over this week’s dark pool tape.
The index complex dominated raw notional, led by SPY at $42.9B (57.3M shares, 28 tracked trades) and QQQ at $10.1B (13.8M shares, 16 tracked trades). IWM logged $1.8B (6.1M shares, 8 tracked trades) as small caps showed signs of broadening participation.
But the single-stock story was semiconductors. MRVL printed $14.7B (47.2M shares, 7 prints, $310.71 avg) — our #3 flow ticker overall and the largest single-name notional on the board. The semis theme deepened with AVGO at $6.8B (17.5M shares, 10 prints, $392.49 avg), INTC at $2.9B (22.5M shares, 10 prints, $129.88 avg), MU at $2.8B (one $1,133.99 print), and TSM at $1.1B (2.4M shares, 5 prints, $448.59 avg). Newcomer ALAB drew a single $1.9B print at $417.07, and CRWV logged $1.6B (13.6M shares, 4 prints).
Beyond chips, SPCX printed $5.0B (27.0M shares, 15 prints, $186.66 avg) with a weekly range of $168.35 to $225.64 — fitting, given it was last week’s standout. EEM saw $1.8B (26.1M shares, 16 prints, $69.91 avg) and PANW logged $340M (1.2M shares, 2 prints).
Five of our names closed the week above their dark pool average price — a sign accumulation levels held into strength:
Our prior callouts hit a 50% trigger rate (14 of 28 setups). The headline winner was SPCX, which ran the full table to T5 (+$48.14) on the bull side, while XOM hit all five bear targets (-$9.15) as crude collapsed. The semis names also delivered — QQQ, AVGO, and INTC each reached T3.
All figures sourced from the MobyTick Snapshot and dark pool print data, week of June 15–19, 2026.
Grading our June 15–19 callouts against that week’s actual high, low, and Thursday close (markets closed Friday for Juneteenth). Data sourced from MobyTick.
| Ticker | Above | Below | Wk High | Wk Low | Wk Close | Result |
|---|---|---|---|---|---|---|
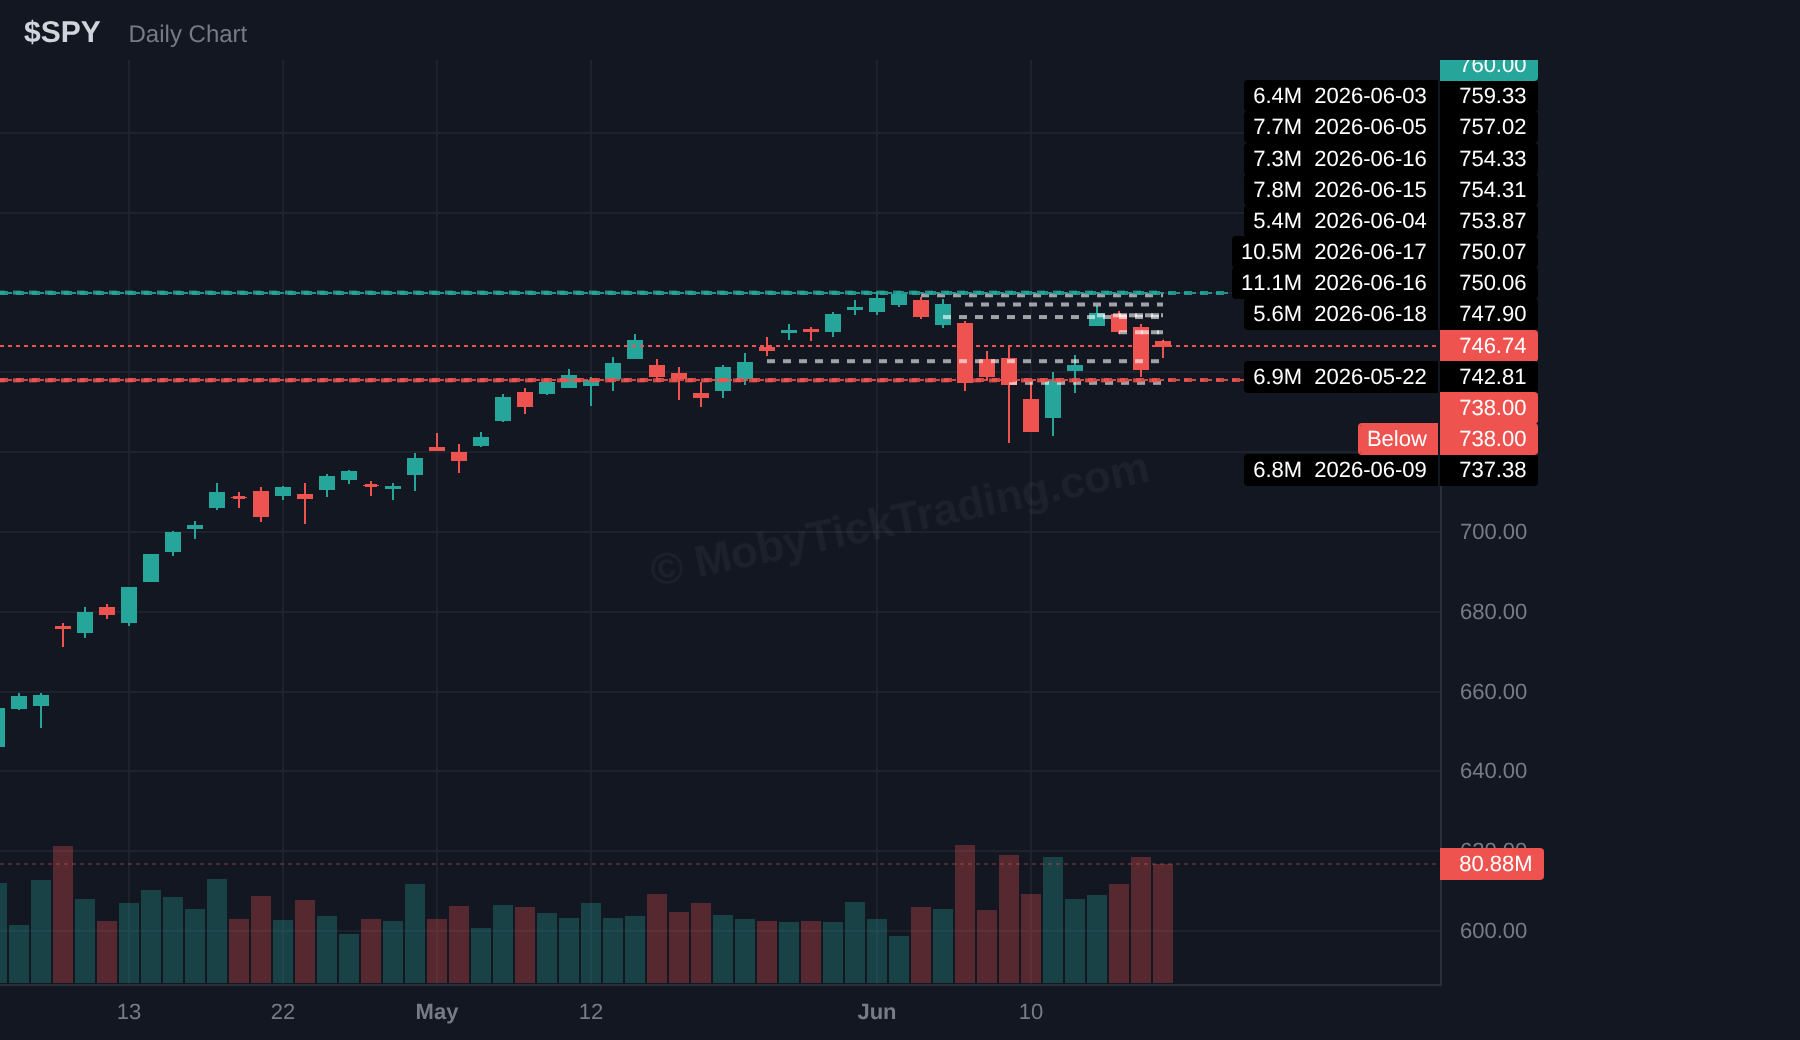
| SPY | $760.00 | $735.00 | $756.68 | $739.22 | $746.74 | ⚪ No trigger — Above missed by $3.32 |
| QQQ | $726.25 | $692.50 | $744.76 | $720.85 | $740.62 | 🟢 Above — +7 target(s) |
| IWM | $296.00 | $290.00 | $297.91 | $288.93 | $295.59 | 🔄 Both — Above +6T, Below +0T |
| AVGO | $397.50 | $370.00 | $412.70 | $376.46 | $411.35 | 🟢 Above — +6 target(s) |
| NVDA | $208.00 | $200.00 | $212.71 | $203.08 | $210.69 | 🟢 Above — +6 target(s) |
| META | $590.00 | $552.50 | $605.81 | $563.10 | $577.22 | 🟢 Above — +4 target(s) |
| MSFT | $392.50 | $382.00 | $401.75 | $373.28 | $379.40 | 🔄 Both — Above +7T, Below +2T |
| TSLA | $410.00 | $380.00 | $416.00 | $384.70 | $400.49 | 🟢 Above — +5 target(s) |
| INTC | $127.50 | $107.50 | $135.48 | $116.00 | $133.99 | 🟢 Above — +7 target(s) |
| AAPL | $305 | $288 | $302.07 | $291.70 | $298.01 | ⚪ No trigger — Above missed by $2.93 |
| PLTR | $132.5 | $126.5 | $136.10 | $125.01 | $128.47 | 🔄 Both — Above +7T, Below +0T |
| XOM | $152.5 | $145 | $142.34 | $135.85 | $137.81 | 🔴 Below — +5 target(s) |
| UNH | $416 | $396 | $414.15 | $398.59 | $400.96 | ⚪ No trigger — Above missed by $1.85 |
| SPCX | $177.5 | $155 | $225.64 | $168.35 | $185.00 | 🟢 Above — +7 target(s) |
Tally: 7 Above triggers | 1 Below trigger | 3 Both | 3 No trigger
Data-driven upper levels and target ladders for the week ahead. These are observed dark pool reference levels, not directional recommendations.
| Ticker | Above | T1 | T2 | T3 | T4 | T5 | T6 | T7 |
|---|---|---|---|---|---|---|---|---|
| SPY | $760.00 | $762.50 | $765.00 | $767.50 | $770.00 | $775.00 | — | — |
| QQQ | $747.50 | $750.00 | $752.50 | $755.00 | $757.50 | $760.00 | $765.00 | — |
| IWM | $298.00 | $300.00 | $302.50 | $305.00 | $307.50 | $310.00 | $312.50 | — |
| INTC | $136.25 | $140.00 | $142.50 | $145.00 | $147.50 | $150.00 | — | — |
| SPCX | $215.00 | $220.00 | $225.00 | $230.00 | $235.00 | $240.00 | $245.00 | — |
| AVGO | $412.50 | $420.00 | $430.00 | $440.00 | $450.00 | $460.00 | $470.00 | $480.00 |
| MRVL | $330.00 | $335.00 | $340.00 | $350.00 | $360.00 | $375.00 | $400.00 | — |
| MU | $1,150.00 | $1,175.00 | $1,200.00 | $1,225.00 | $1,250.00 | $1,275.00 | $1,300.00 | $1,350.00 |
| TSM | $467.50 | $470.00 | $480.00 | $490.00 | $500.00 | $510.00 | $512.50 | — |
| EEM | $71.25 | $72.50 | $73.25 | $75.00 | $77.50 | $80.00 | — | — |
| CRWV | $125.00 | $127.50 | $130.00 | $135.00 | $140.00 | — | — | — |
| PANW | $290.00 | $294.00 | $297.50 | $300.00 | $305.00 | $310.00 | $315.00 | $320.00 |
| ALAB | $420.00 | $430.00 | $440.00 | $450.00 | $462.50 | $475.00 | $500.00 | — |
| Ticker | Below | T1 | T2 | T3 | T4 | T5 | T6 | T7 |
|---|---|---|---|---|---|---|---|---|
| SPY | $738.00 | $735.00 | $730.00 | $725.00 | $720.00 | $715.00 | $712.50 | — |
| QQQ | $720.00 | $717.50 | $715.00 | $710.00 | $708.00 | $705.00 | $700.00 | — |
| IWM | $288.00 | $285.00 | $282.50 | $280.00 | $277.50 | $275.00 | — | — |
| INTC | $116.00 | $115.00 | $112.50 | $110.00 | $108.00 | $105.00 | $100.00 | $97.50 |
| SPCX | $172.00 | $165.00 | $160.00 | $155.00 | $150.00 | $145.00 | $140.00 | — |
| AVGO | $372.50 | $370.00 | $365.00 | $362.50 | $360.00 | — | — | — |
| MRVL | $280.00 | $270.00 | $260.00 | $250.00 | $240.00 | $230.00 | $220.00 | — |
| MU | $945.00 | $925.00 | $900.00 | $890.00 | $850.00 | $800.00 | $750.00 | — |
| TSM | $425.00 | $420.00 | $415.00 | $412.50 | $410.00 | $405.00 | $400.00 | — |
| EEM | $67.50 | $66.50 | $66.00 | $65.50 | $64.00 | $64.00 | $63.00 | $62.00 |
| CRWV | $100.00 | $97.50 | $95.00 | $92.50 | $90.00 | $87.50 | $85.00 | — |
| PANW | $260.00 | $255.00 | $252.50 | $250.00 | $245.00 | $240.00 | $235.00 | — |
| ALAB | $350 | $340 | $335 | $330 | $320 | $310 | — | — |
Dark pool flow for the week of June 15–19 (minimum 500,000-share prints, opening and closing crosses excluded). Levels shown are this week’s June 23–27 reference levels.
Dark pool flow: $42.86B across 57.30M shares and 28 prints. Average reported print price: $748.00. Status: BETWEEN levels.

Above $760.00 | Targets: $762.50, $765.00, $767.50, $770.00, $775.00
Below $738.00 | Targets: $735.00, $730.00, $725.00, $720.00, $715.00, $712.50
Dark pool flow: $10.12B across 13.83M shares and 16 prints. Average reported print price: $732.03. Status: BETWEEN levels.
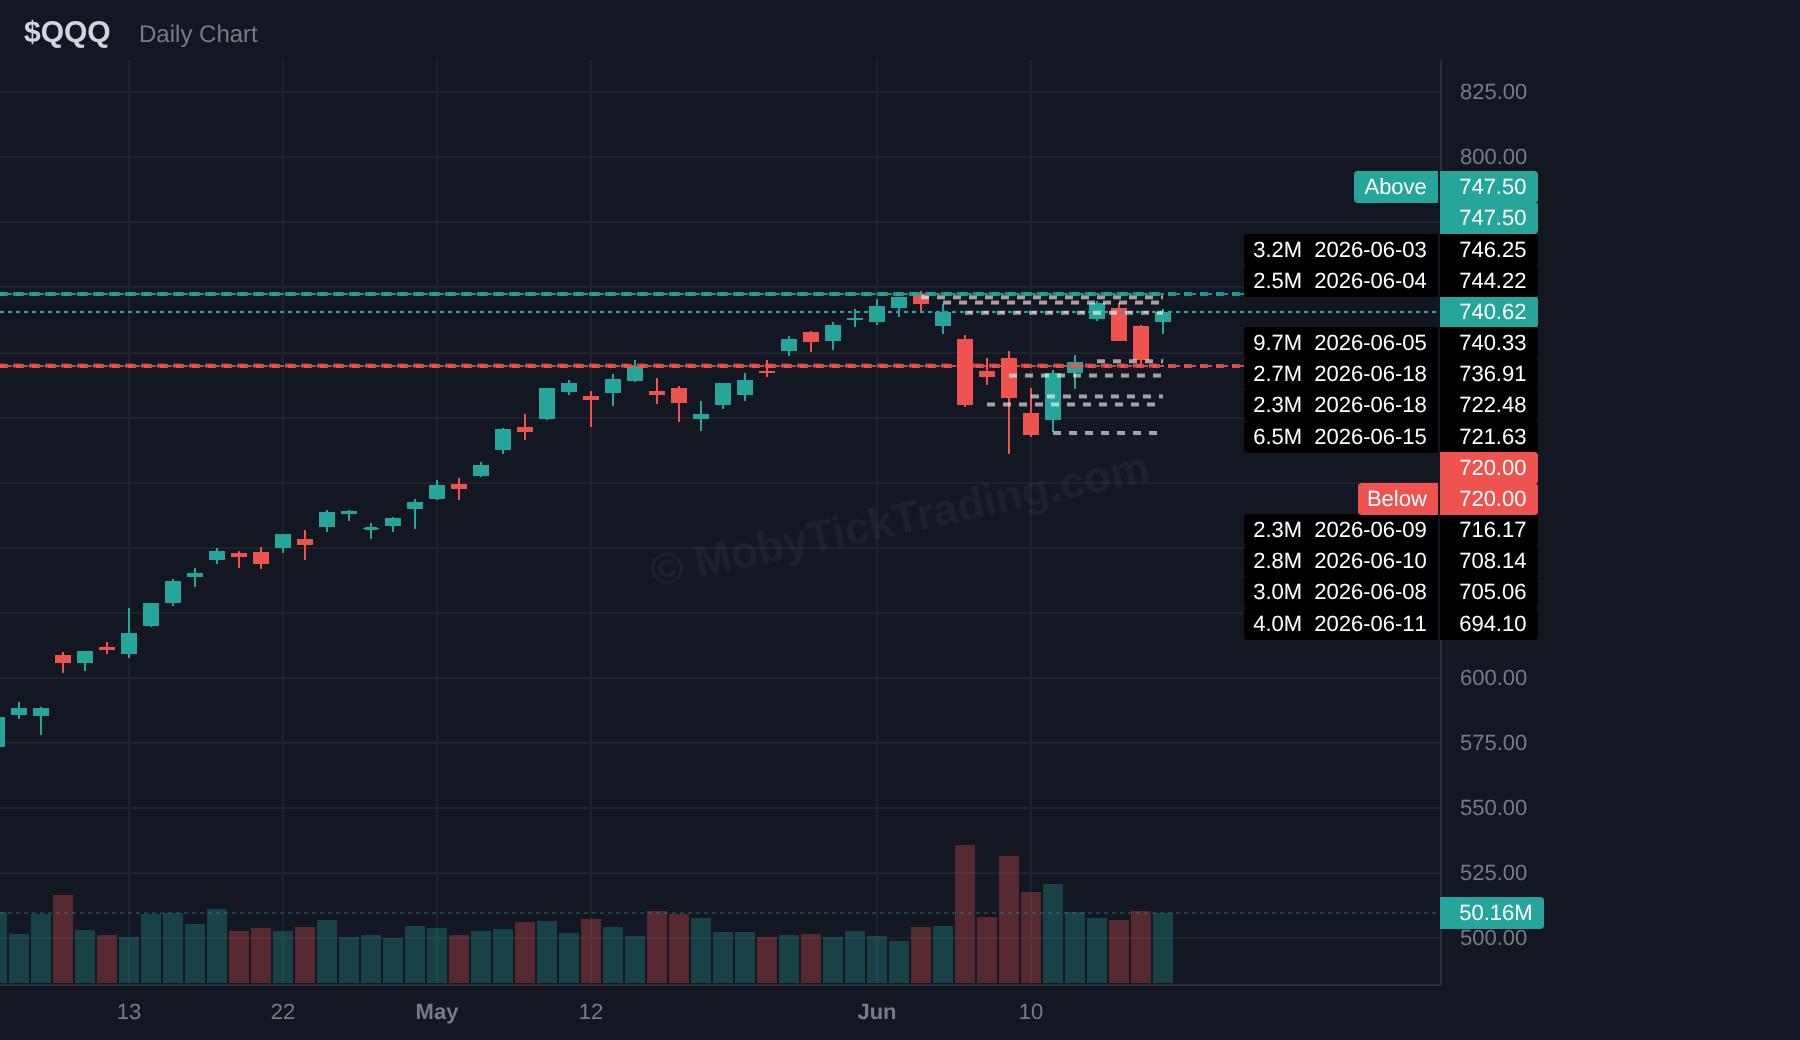
Above $747.50 | Targets: $750.00, $752.50, $755.00, $757.50, $760.00, $765.00
Below $720.00 | Targets: $717.50, $715.00, $710.00, $708.00, $705.00, $700.00
Dark pool flow: $1.79B across 6.09M shares and 8 prints. Average reported print price: $293.54. Status: BETWEEN levels.
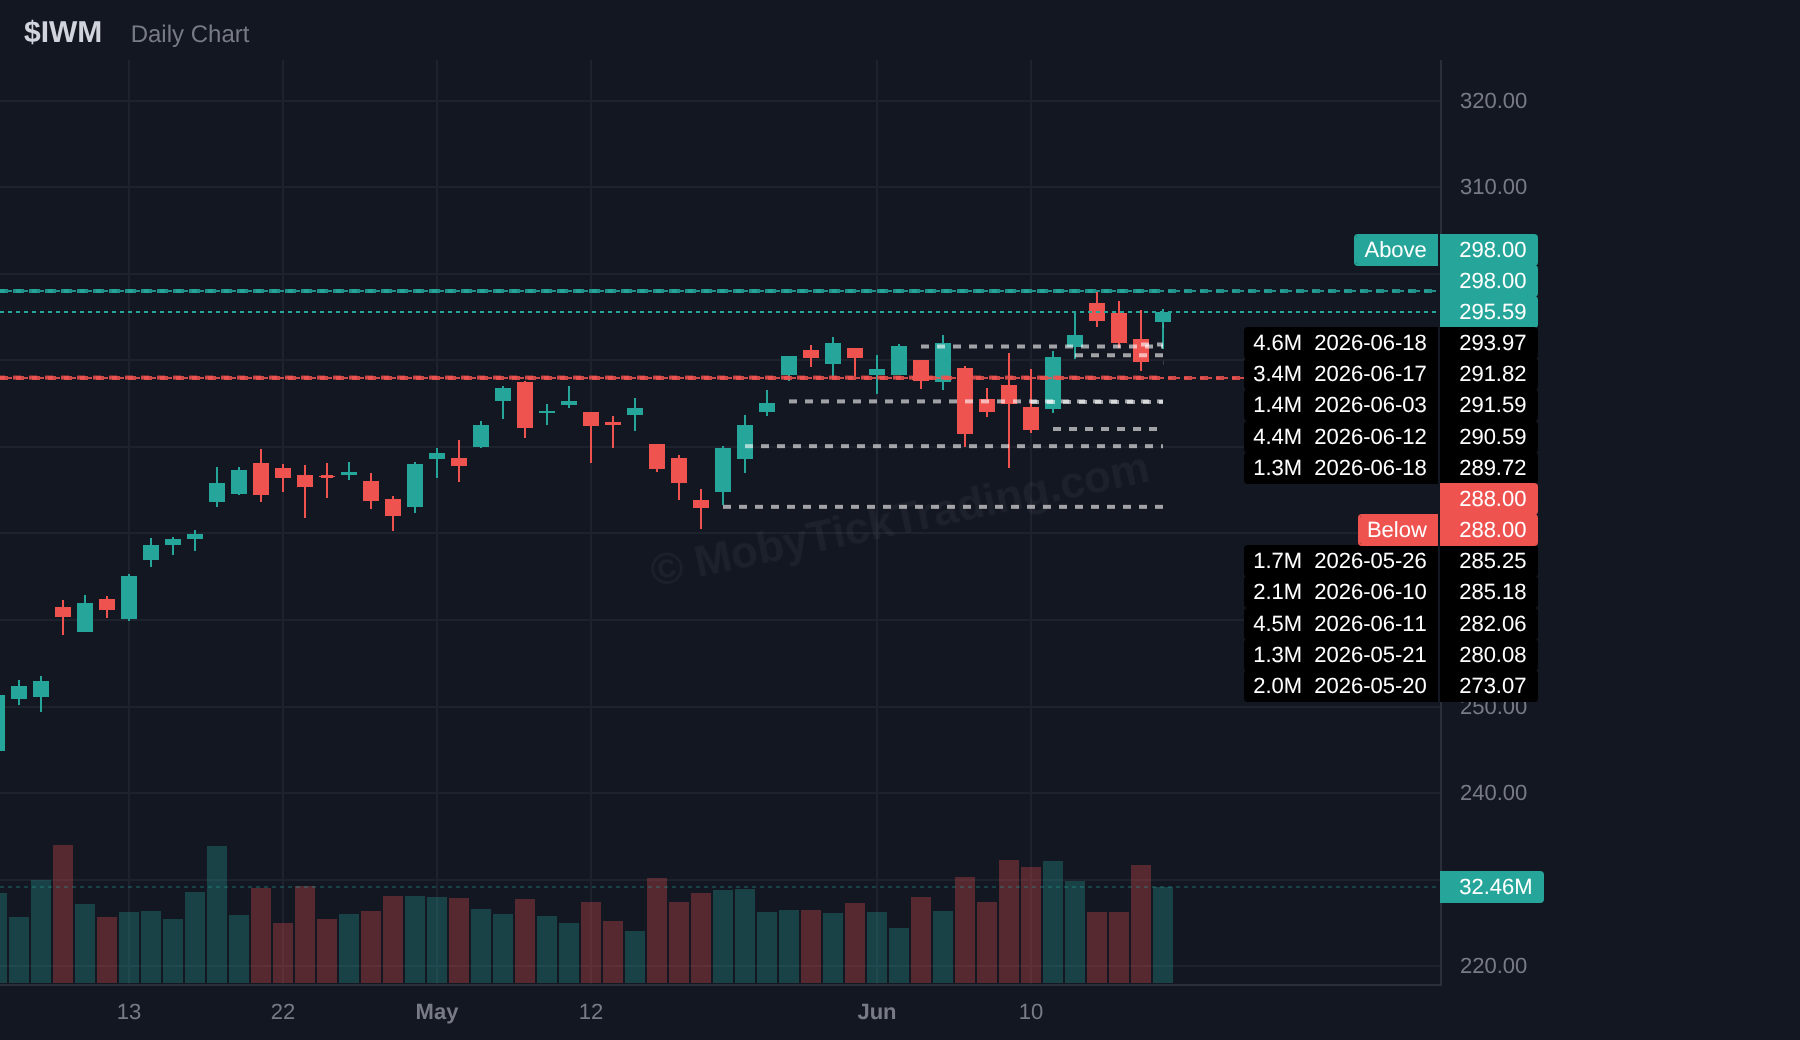
Above $298.00 | Targets: $300.00, $302.50, $305.00, $307.50, $310.00, $312.50
Below $288.00 | Targets: $285.00, $282.50, $280.00, $277.50, $275.00
Dark pool flow: $2.92B across 22.49M shares and 10 prints. Average reported print price: $129.88. Status: BETWEEN levels.
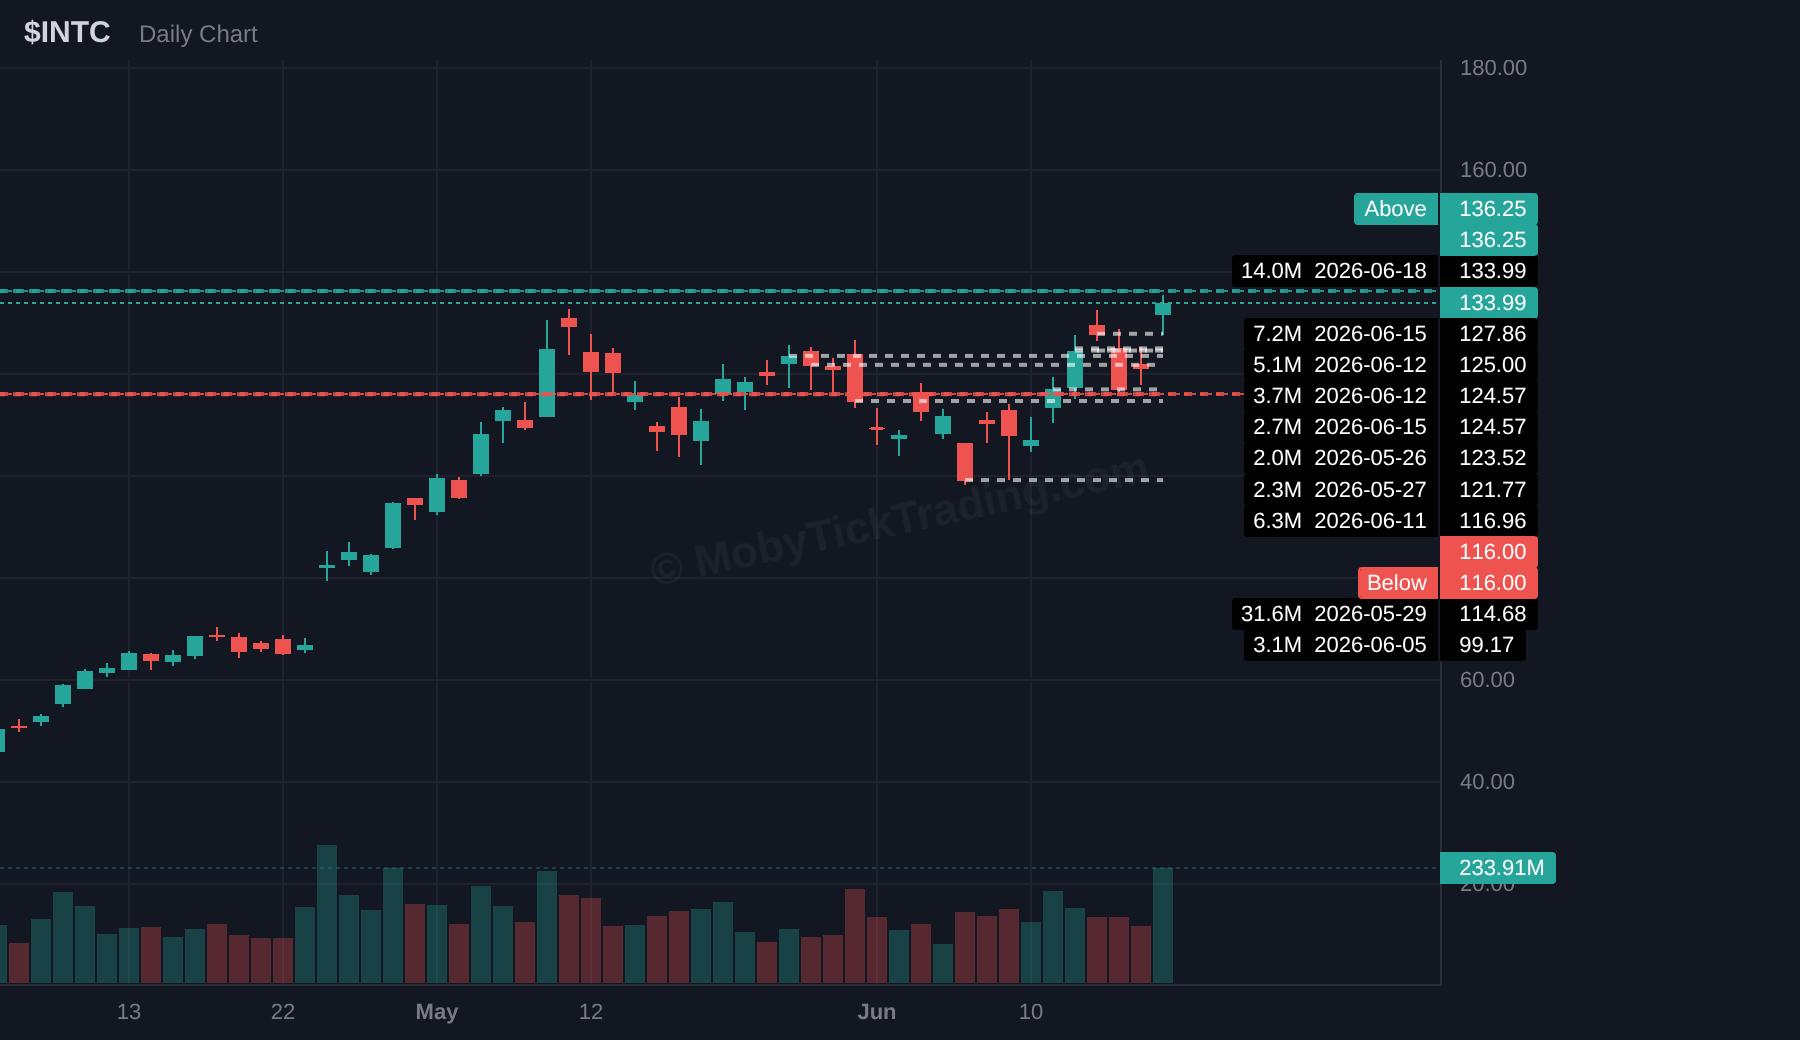
Above $136.25 | Targets: $140.00, $142.50, $145.00, $147.50, $150.00
Below $116.00 | Targets: $115.00, $112.50, $110.00, $108.00, $105.00, $100.00, $97.50
Dark pool flow: $5.04B across 26.97M shares and 15 prints. Average reported print price: $186.66. Status: BETWEEN levels.
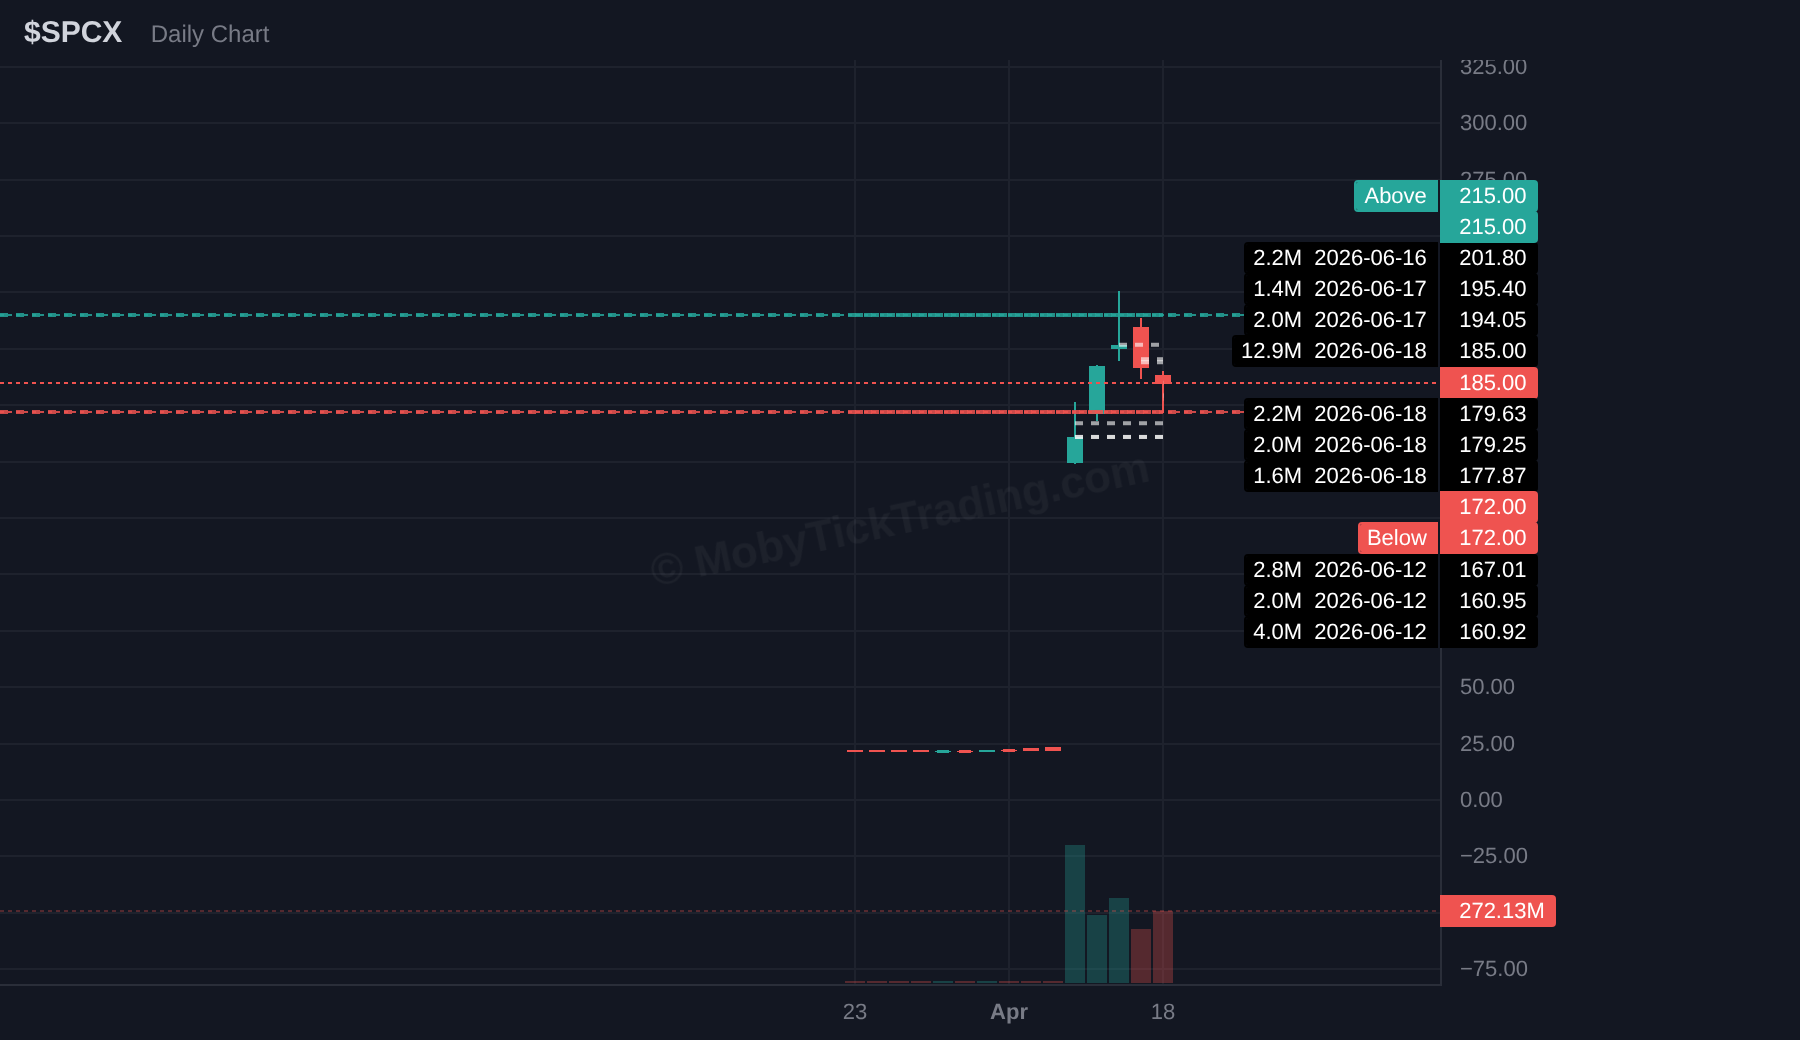
Above $215.00 | Targets: $220.00, $225.00, $230.00, $235.00, $240.00, $245.00
Below $172.00 | Targets: $165.00, $160.00, $155.00, $150.00, $145.00, $140.00
Dark pool flow: $6.85B across 17.45M shares and 10 prints. Average reported print price: $392.49. Status: BETWEEN levels.
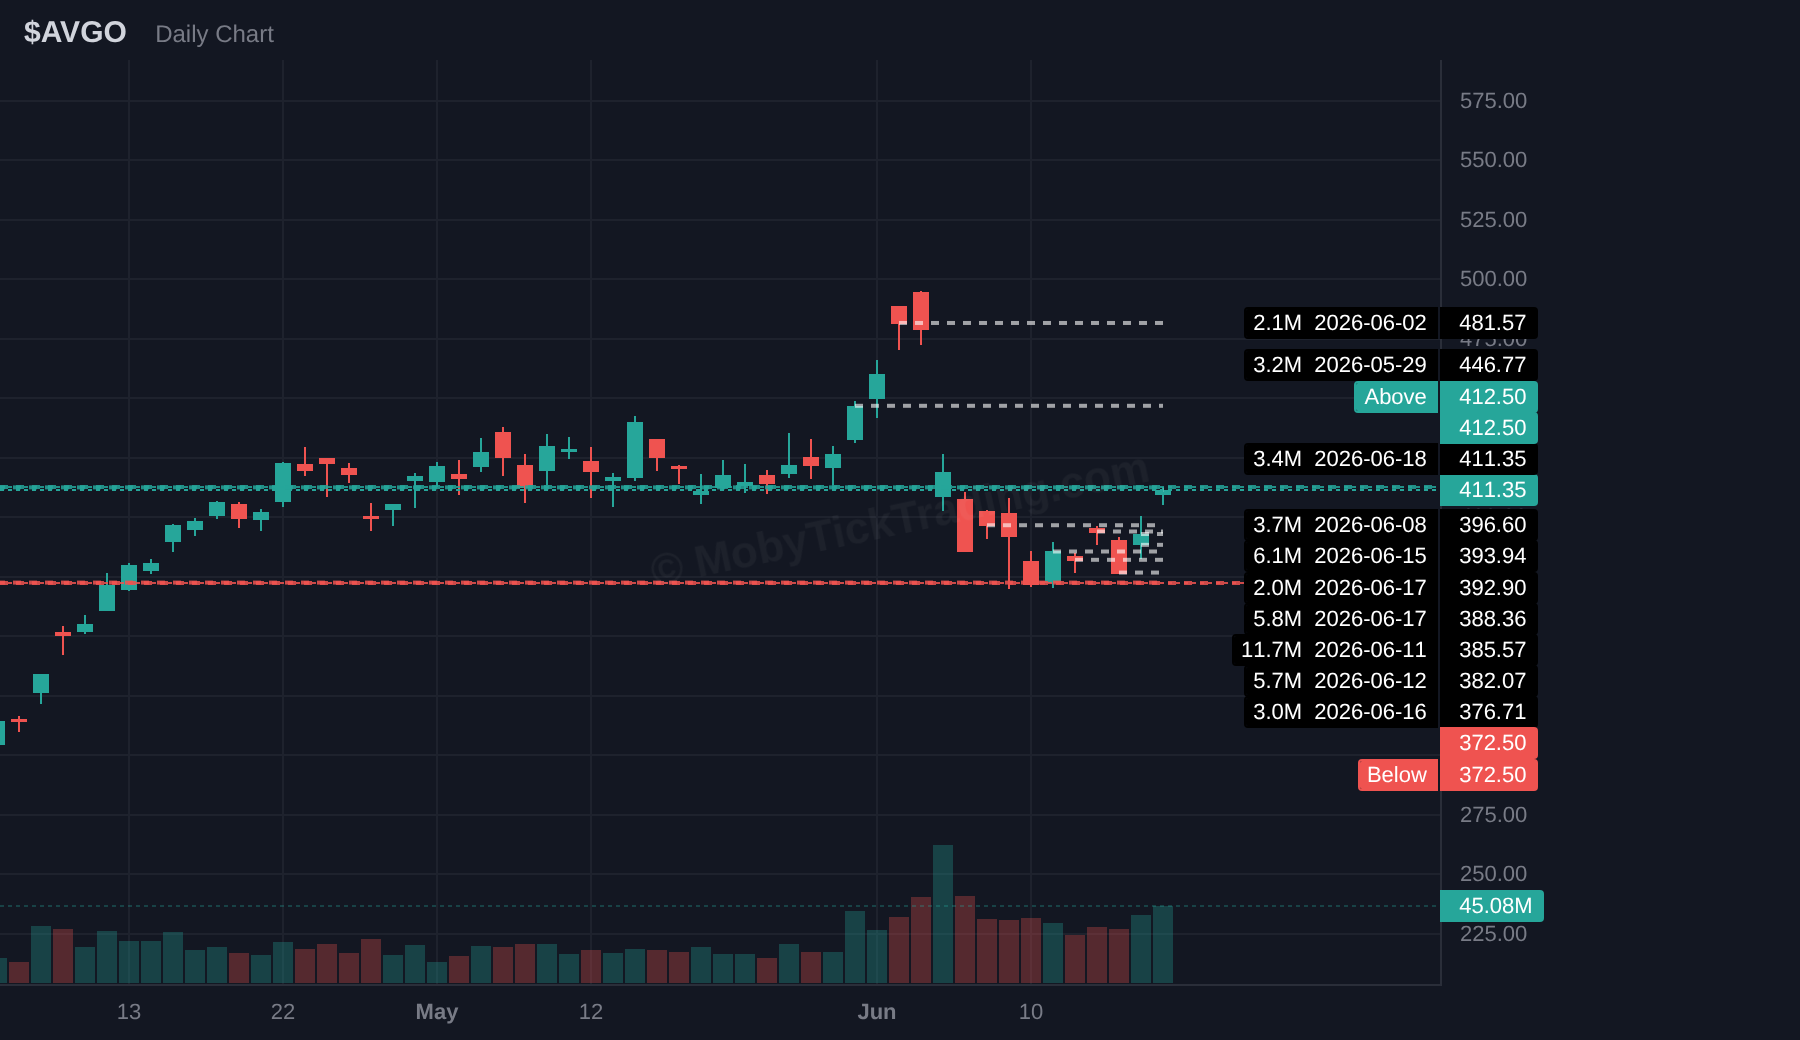
Above $412.50 | Targets: $420.00, $430.00, $440.00, $450.00, $460.00, $470.00, $480.00
Below $372.50 | Targets: $370.00, $365.00, $362.50, $360.00
Dark pool flow: $14.68B across 47.24M shares and 7 prints. Average reported print price: $310.71. Status: BETWEEN levels.
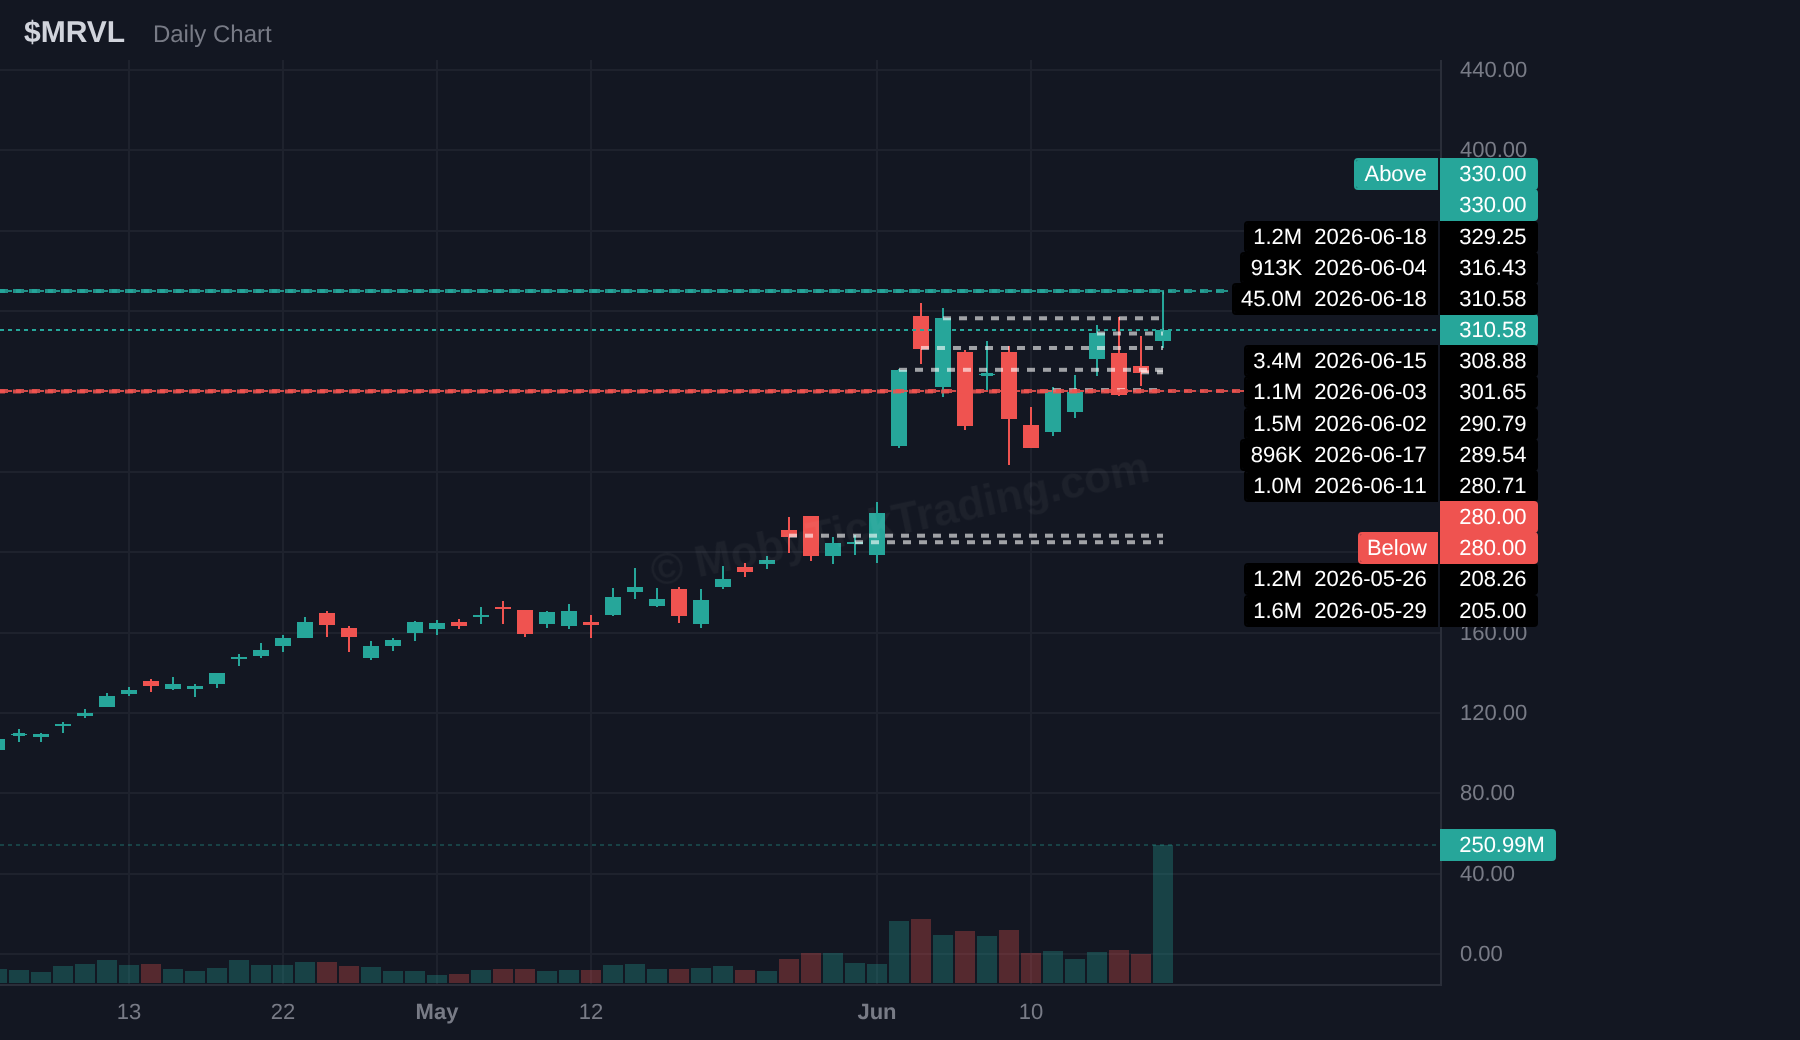
Above $330.00 | Targets: $335.00, $340.00, $350.00, $360.00, $375.00, $400.00
Below $280.00 | Targets: $270.00, $260.00, $250.00, $240.00, $230.00, $220.00
Dark pool flow: $2.81B across 2.47M shares and 1 print. Average reported print price: $1,133.99. Status: BETWEEN levels.
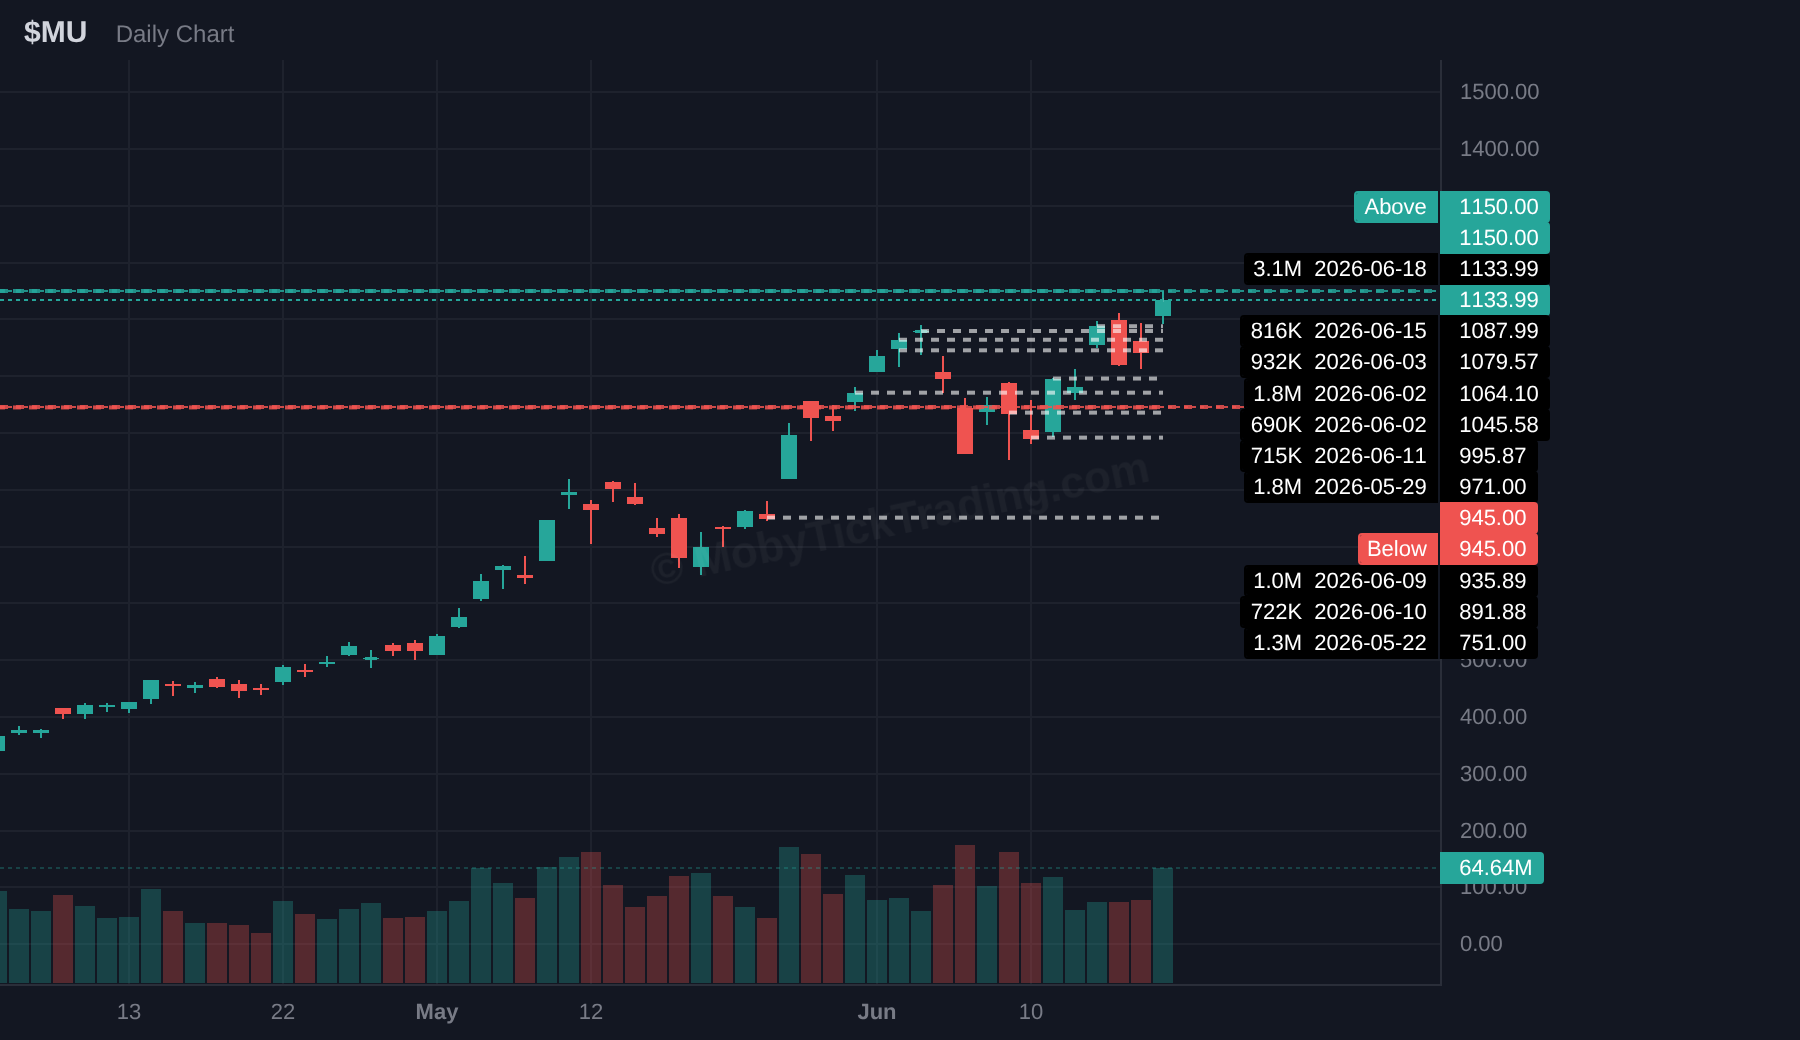
Above $1,150.00 | Targets: $1,175.00, $1,200.00, $1,225.00, $1,250.00, $1,275.00, $1,300.00, $1,350.00
Below $945.00 | Targets: $925.00, $900.00, $890.00, $850.00, $800.00, $750.00
Dark pool flow: $1.08B across 2.40M shares and 5 prints. Average reported print price: $448.59. Status: BETWEEN levels.
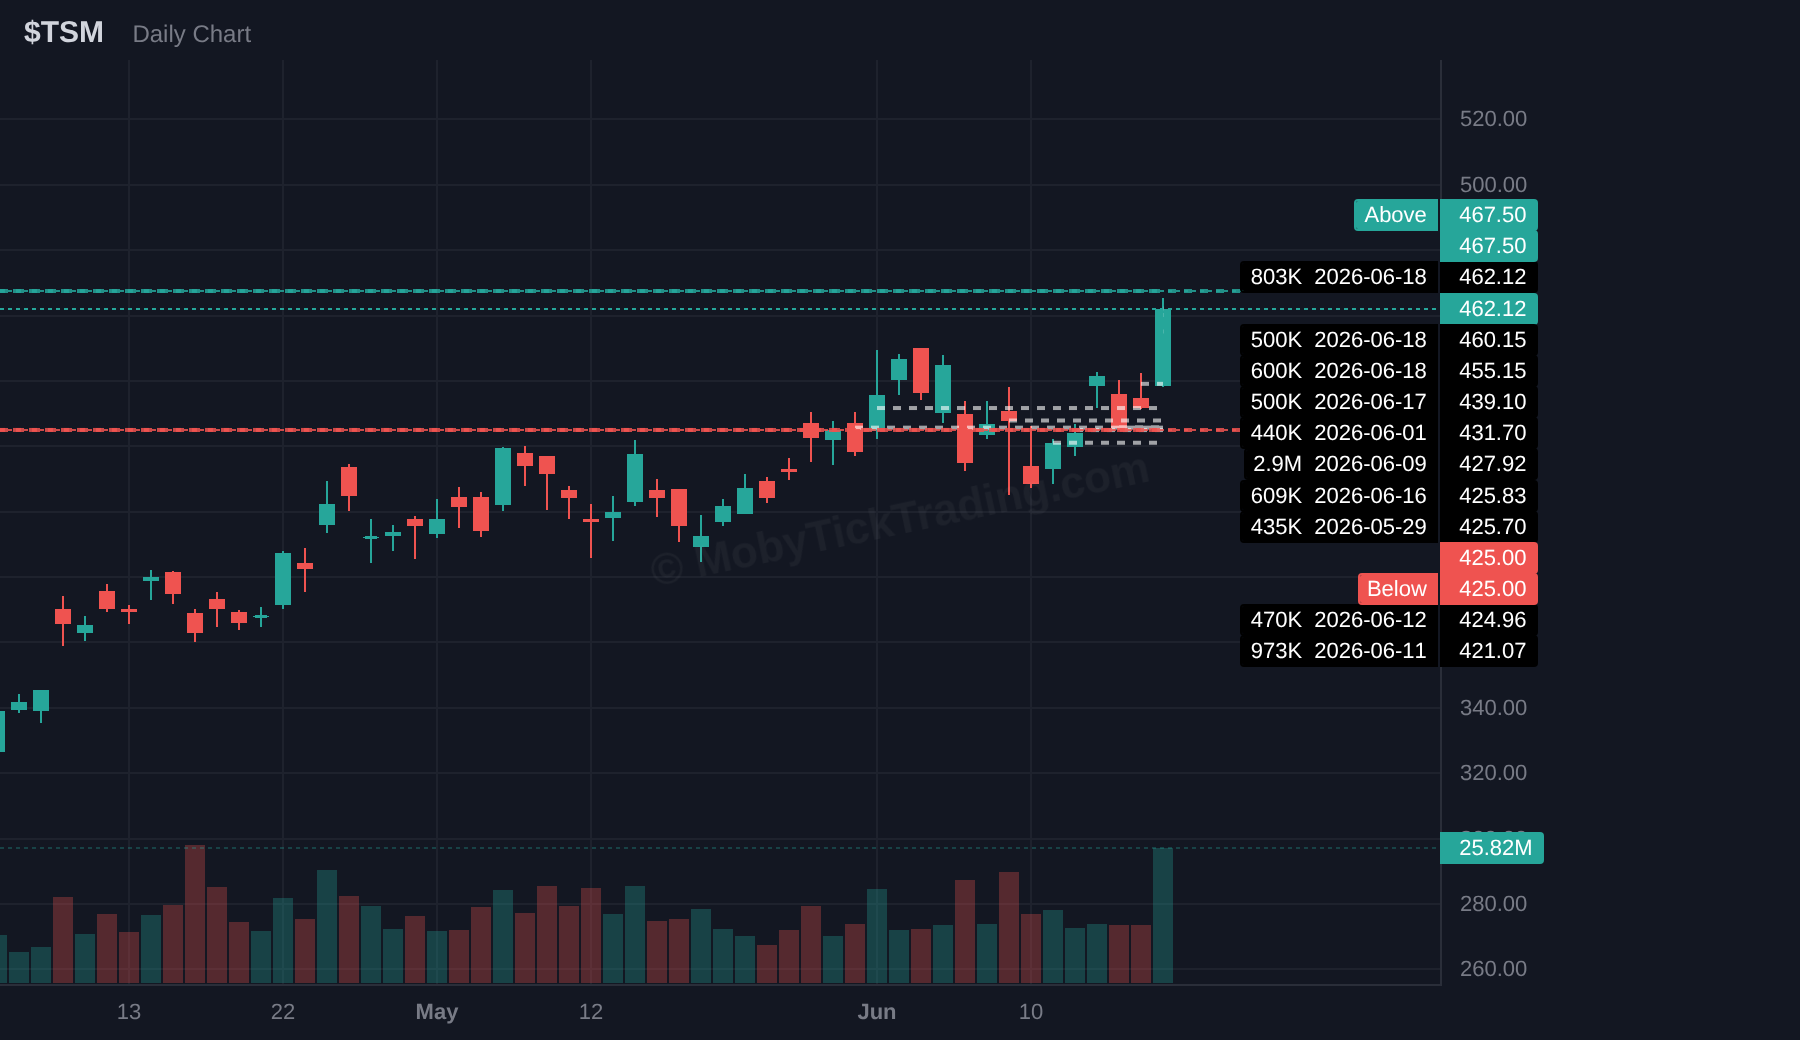
Above $467.50 | Targets: $470.00, $480.00, $490.00, $500.00, $510.00, $512.50
Below $425.00 | Targets: $420.00, $415.00, $412.50, $410.00, $405.00, $400.00
Dark pool flow: $1.82B across 26.06M shares and 16 prints. Average reported print price: $69.91. Status: BETWEEN levels.
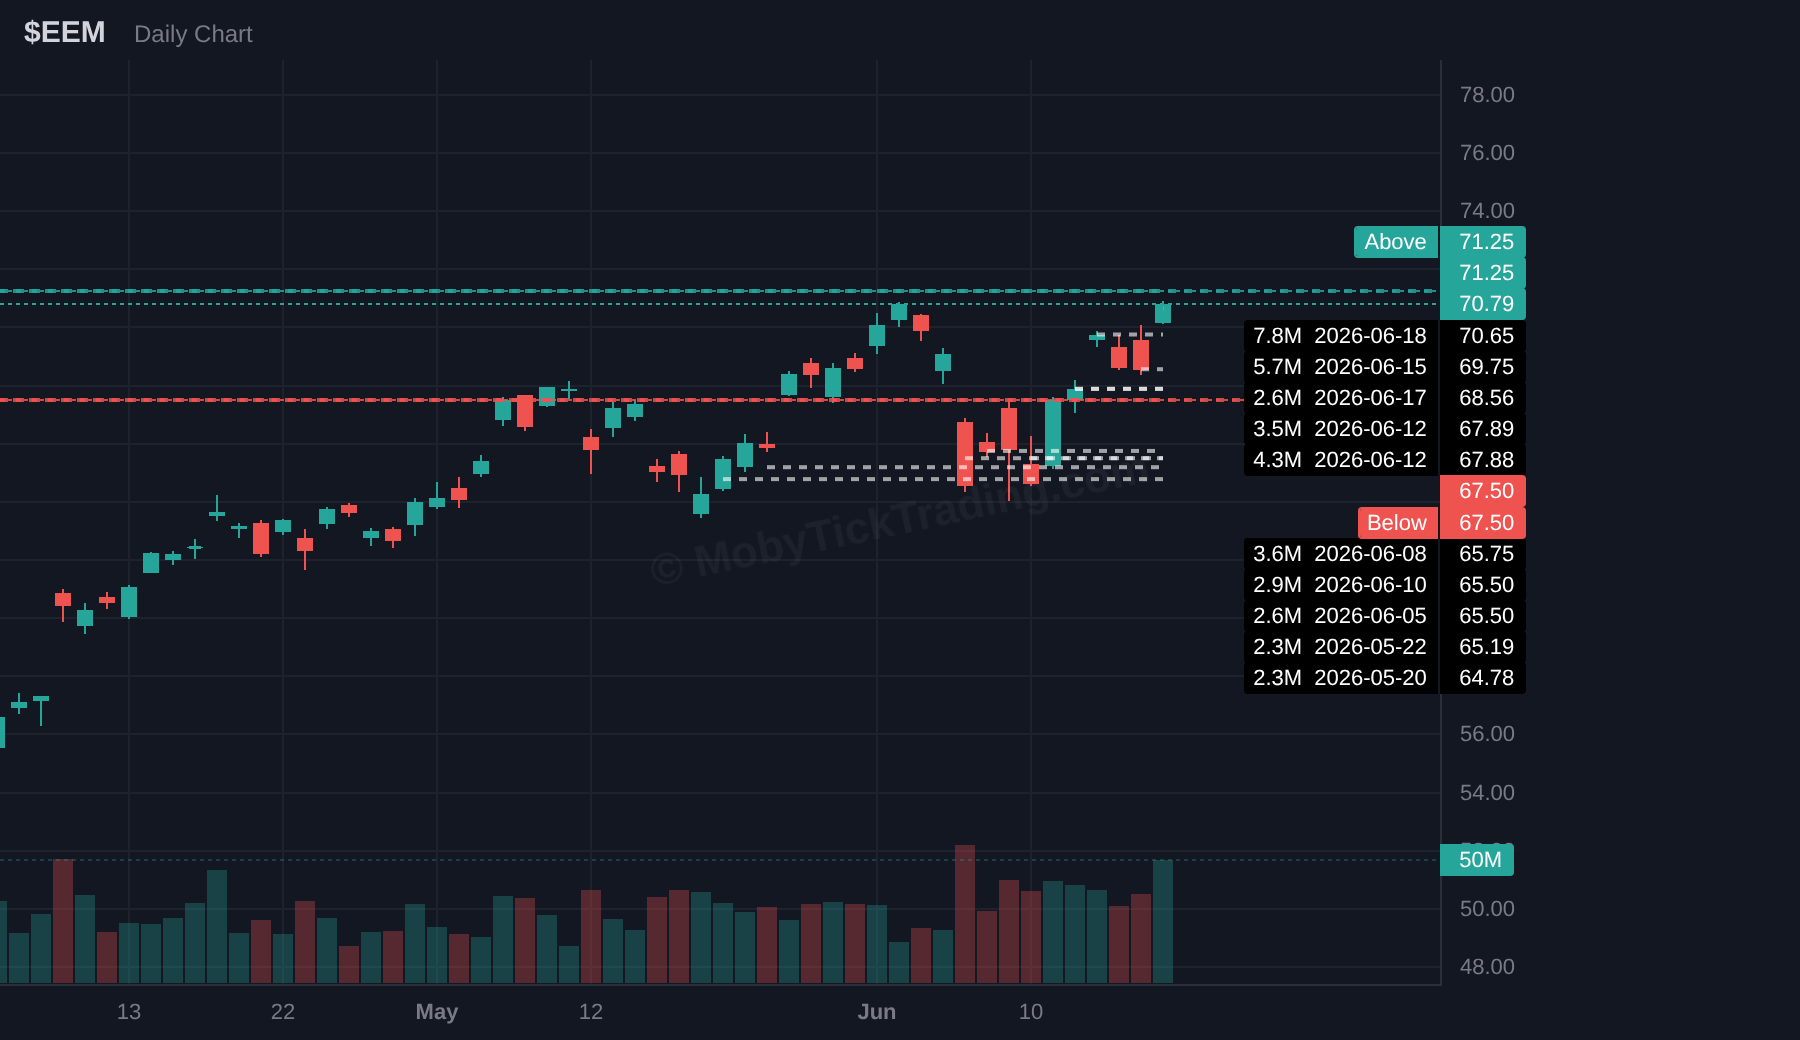
Above $71.25 | Targets: $72.50, $73.25, $75.00, $77.50, $80.00
Below $67.50 | Targets: $66.50, $66.00, $65.50, $64.00, $64.00, $63.00, $62.00
Dark pool flow: $1.60B across 13.60M shares and 4 prints. Average reported print price: $117.72. Status: BETWEEN levels.
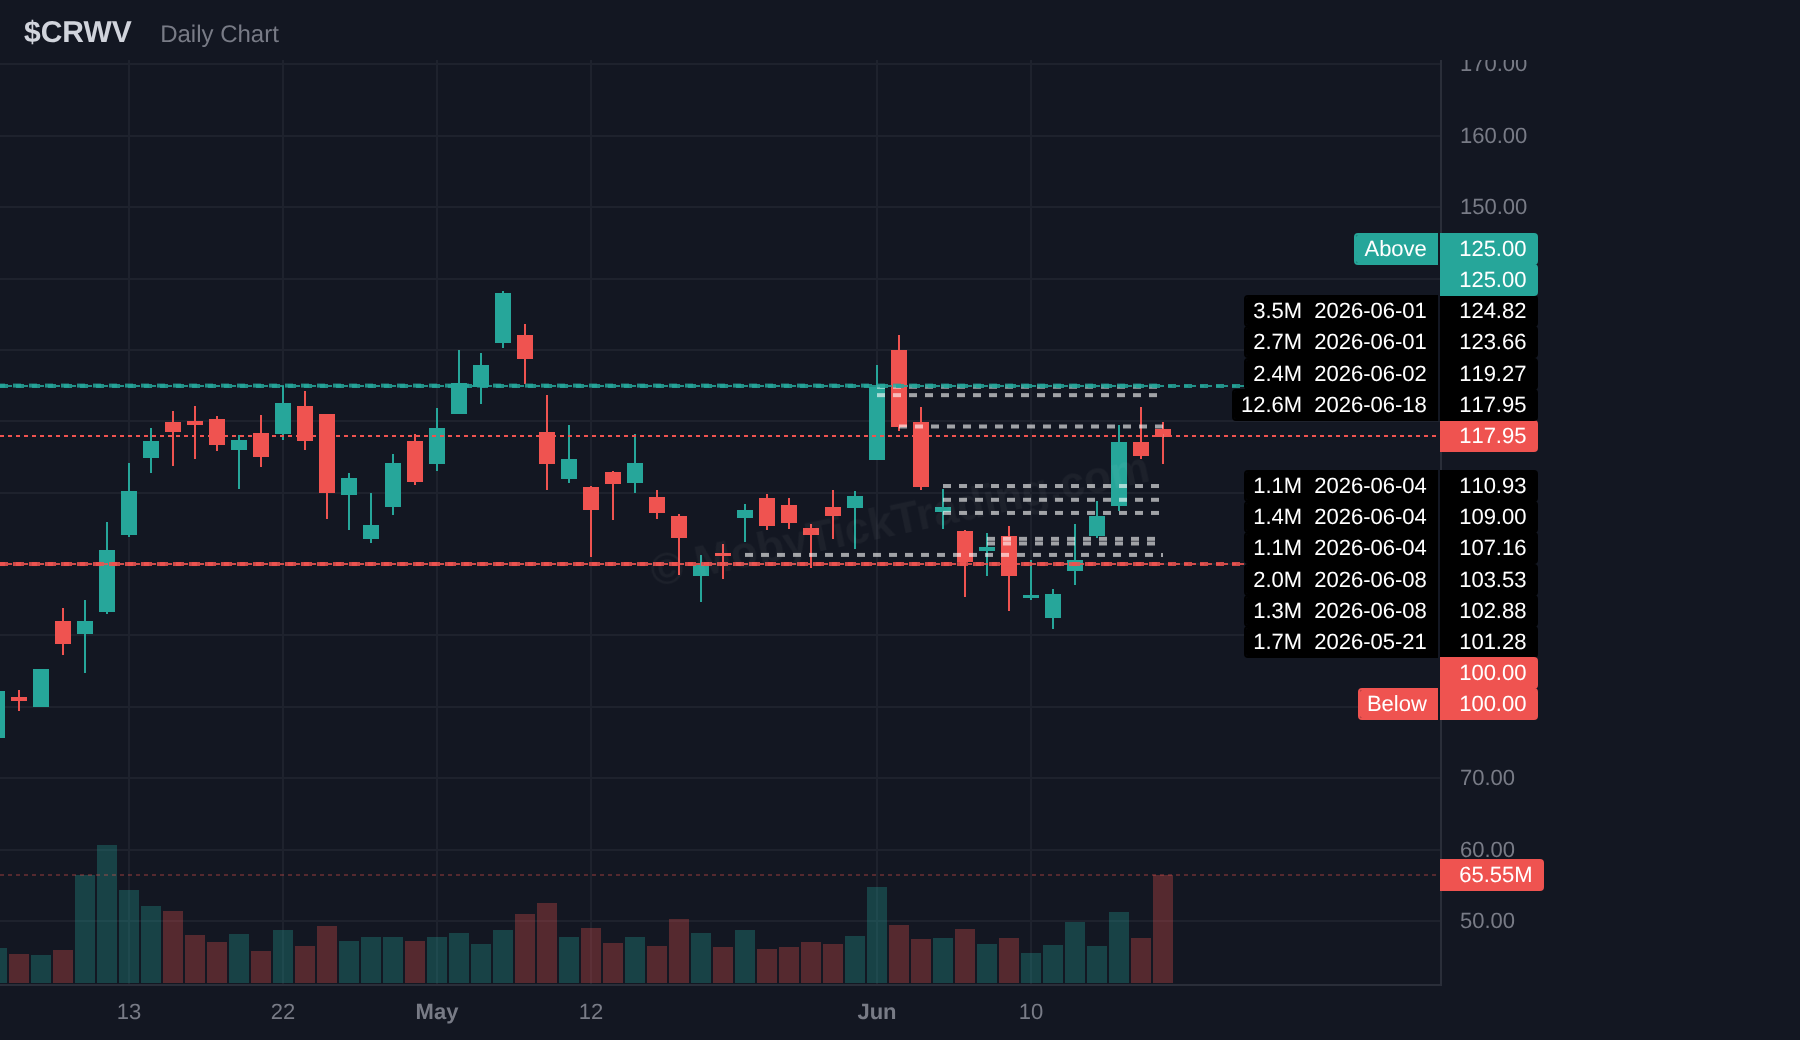
Above $125.00 | Targets: $127.50, $130.00, $135.00, $140.00
Below $100.00 | Targets: $97.50, $95.00, $92.50, $90.00, $87.50, $85.00
Dark pool flow: $340.2M across 1.19M shares and 2 prints. Average reported print price: $285.68. Status: BETWEEN levels.
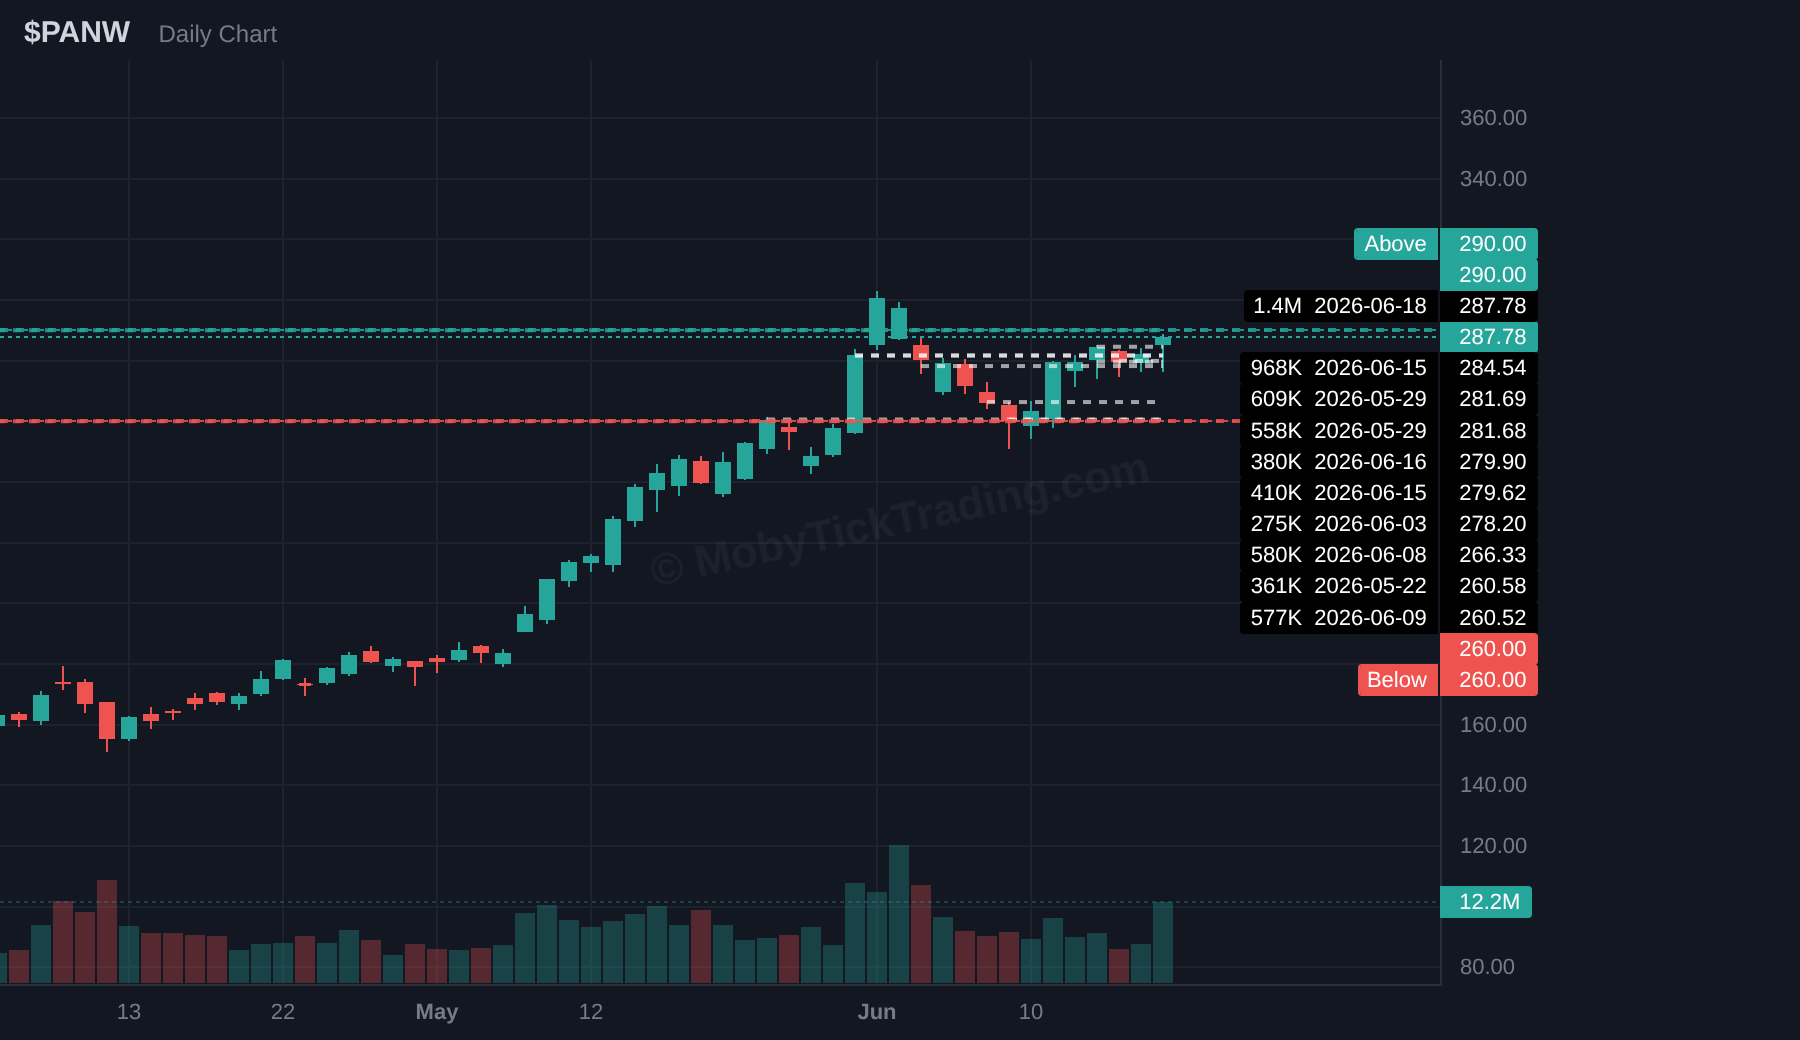
Above $290.00 | Targets: $294.00, $297.50, $300.00, $305.00, $310.00, $315.00, $320.00
Below $260.00 | Targets: $255.00, $252.50, $250.00, $245.00, $240.00, $235.00
Dark pool flow: $1.90B across 4.55M shares and 1 print. Average reported print price: $417.07. Status: BETWEEN levels.
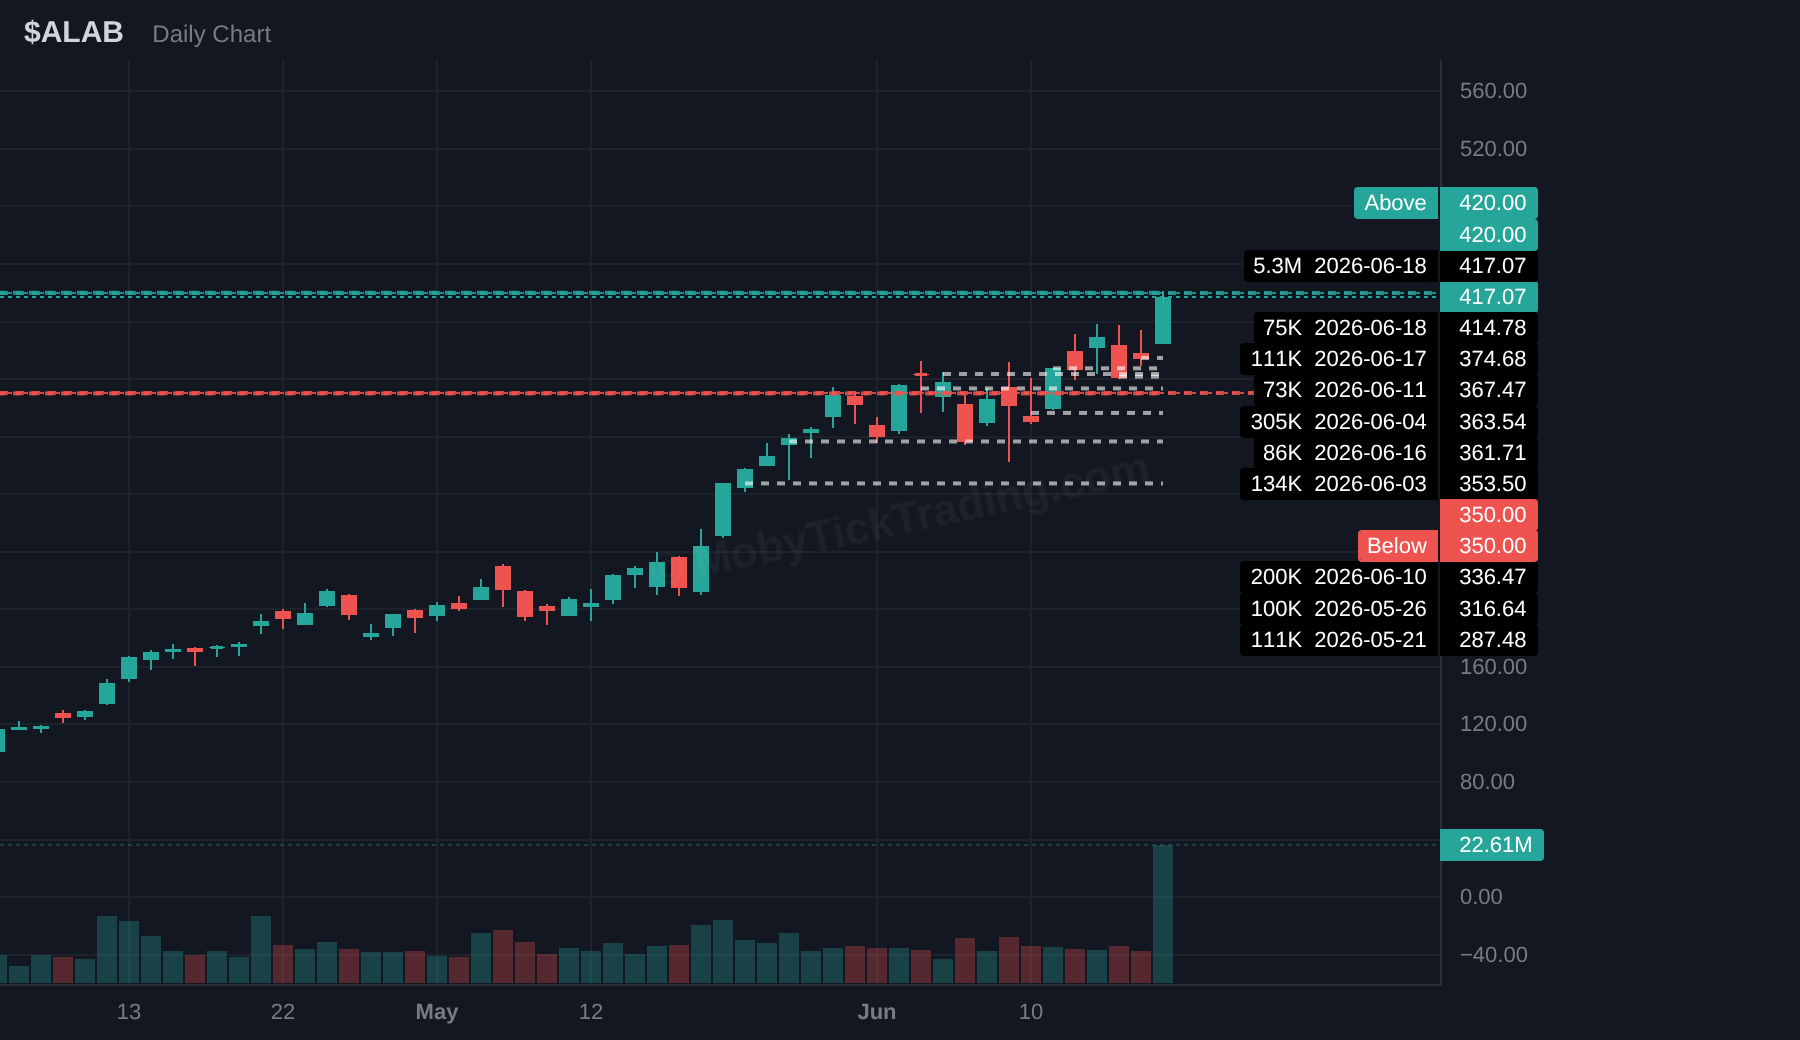
Above $420.00 | Targets: $430.00, $440.00, $450.00, $462.50, $475.00, $500.00
Below $350 | Targets: $340, $335, $330, $320, $310
Broad-market ETF dark pool activity hit $107.3 billion this week across 85 prints. The headline is concentration: large-cap vehicles captured 88.9% of all broad ETF flow, while small-caps barely registered.
Large-Cap Dominance
The SPY/IVV/VOO complex moved a combined $95.4 billion over 61 prints. SPY alone accounted for $42.86 billion — 40% of all broad ETF dark pool volume — across 28 prints averaging $1.53 billion per trade. IVV added $30.54 billion (19 prints) and VOO contributed $21.96 billion (14 prints). When three functionally identical S&P 500 trackers are each clearing tens of billions in dark venues, the signal is unambiguous: institutions are routing enormous notional exposure through the most liquid instruments available.
QQQ printed $10.12 billion over 16 trades, confirming healthy institutional demand for Nasdaq-100 exposure alongside the S&P 500 flow. The combined large-cap + tech-heavy ETF total reached $105.5 billion.
Small-Caps Left Behind
IWM generated just $1.79 billion across 8 prints — 1.7% of total broad ETF flow. The large-cap-to-small-cap flow ratio stood at 53:1. This is not a rotation; it is a one-way street. Institutional dark pool activity shows no measurable appetite for broadening exposure down the market-cap spectrum. Every dollar that touched IWM was matched by $53 flowing into SPY, IVV, or VOO.
Sector Flows
Sector ETF dark pool activity totaled $1.93 billion across 38 prints, a rounding error next to the broad-market complex, but the internal distribution tells a story.
Financials (XLF) led decisively at $596.9 million across 13 prints — 30.9% of all sector ETF flow and the only sector vehicle with double-digit print count. Energy (XLE) followed at $279.3 million (7 prints), and Communication Services (XLC) rounded out the top three at $243.4 million (3 prints).
The bottom of the sector ranking was defined by scarcity, not just size. Five of eleven Select Sector SPDRs recorded a single print this week: Consumer Discretionary (XLY, $52.0M), Healthcare (XLV, $74.8M), Technology (XLK, $82.3M), Industrials (XLI, $90.3M), and Real Estate (XLRE, $106.4M). No sector ETF had zero prints, but single-print sectors represent institutional indifference more than active positioning.
The Big Picture
Institutional flow through dark pools this week was a vote for concentration: S&P 500 exposure at scale, with selective sector interest in financials and energy, and almost no capital reaching small-caps or defensive sectors through the ETF channel. The data does not suggest rotation. It suggests institutions are comfortable where they are.
Beyond Dollar Volume: How Print Concentration and Consolidation Signal Bigger Moves
Most traders fixate on the headline dollar figure of a dark pool block — the bigger the number, the bigger the deal, right? Not quite. The number that often matters more is how many prints make up that total, and how tightly they cluster around the same price level.
Here’s the mechanism. When an institution needs to fill a large order, it can’t just slam one giant market buy — that would spike the price against itself. Instead, it spreads the buying across multiple prints at similar levels, absorbing supply quietly. So concentration is conviction: ten prints clustered around one zone tells you a desk is methodically building a real position, while one lone block tells you far less about intent.
This is where consolidation comes in. When price grinds sideways around a dark pool accumulation zone, institutions are loading up without pushing the tape. The deeper and more extended that consolidation near the accumulation level, the larger the position being built — and historically, the more energy stored for the eventual move.
This week’s MobyTick data shows it clearly. INTC logged 10 prints / 22.5M shares / $2,921M at an average of $129.88. Price dropped all the way to $116 — well below the dark pool zone — then institutions bought across all 10 prints and the stock V-recovered to close $133.99, +3.16% above the DP average. AVGO mirrored it: 10 prints / $6,848M at $392.49, dipping to $376.46 before ripping to close $411.35, +4.81% above average. Even smaller-cap SMCI showed the pattern — 9 concentrated prints through a sharp dip to $27.71, closing +1.17% over its $30.31 DP average.
Contrast that with ARM: a single print of 7.5M shares / $3,285M. Bigger dollar value than many names on the list — but one print, no concentration, no consolidation signal. Hard to read conviction from a lone block.
Key Takeaway: Don’t just ask how big the dark pool dollar volume is — ask how many prints built it and how tightly they consolidated. Multiple prints clustered through a dip point to quiet institutional accumulation; a single block, however large, tells a thinner story. (Source: MobyTick data.)
MobyTick gives retail traders institutional-grade dark pool and block trade intelligence across 10,000+ stocks.
Already on the list? Get the weekly report free at mobyticktrading.com/weekly-report.
This report is for educational and informational purposes only. It is not financial advice, investment advice, or a recommendation to buy or sell any security. Past performance does not guarantee future results. Trading involves risk.