Physical Address
304 North Cardinal St.
Dorchester Center, MA 02124
Physical Address
304 North Cardinal St.
Dorchester Center, MA 02124
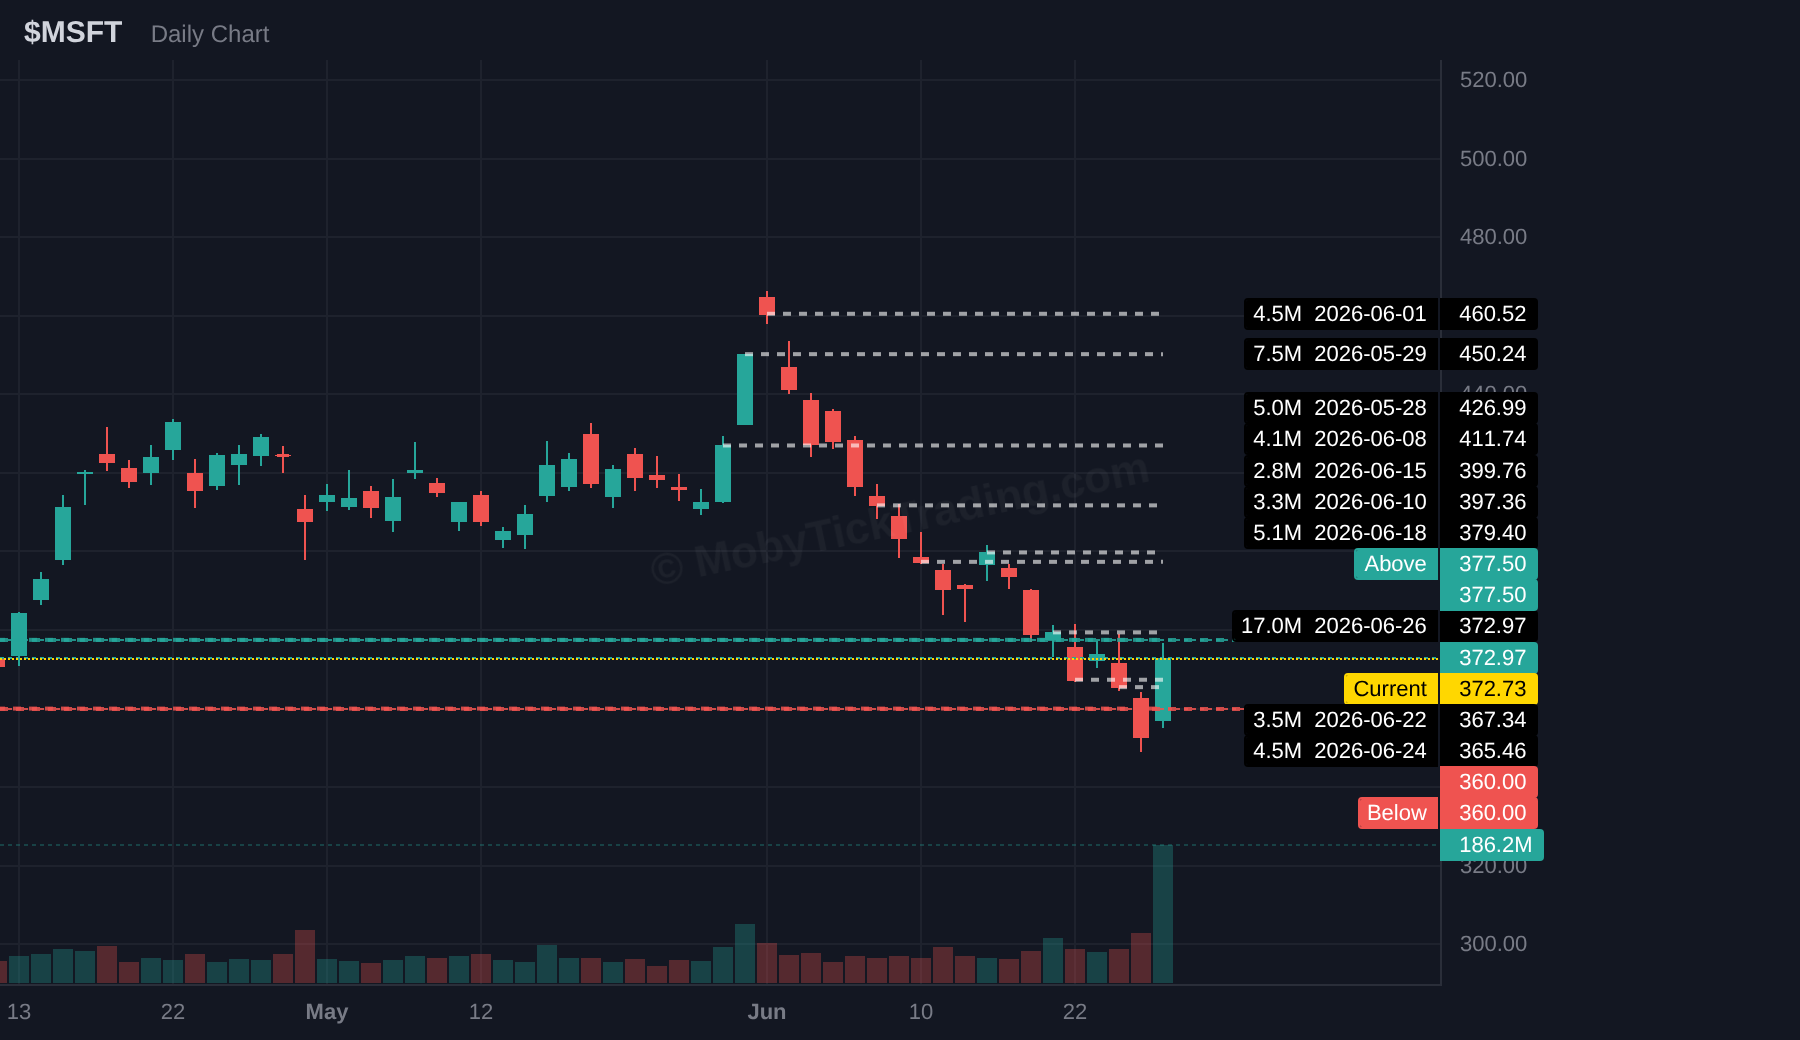
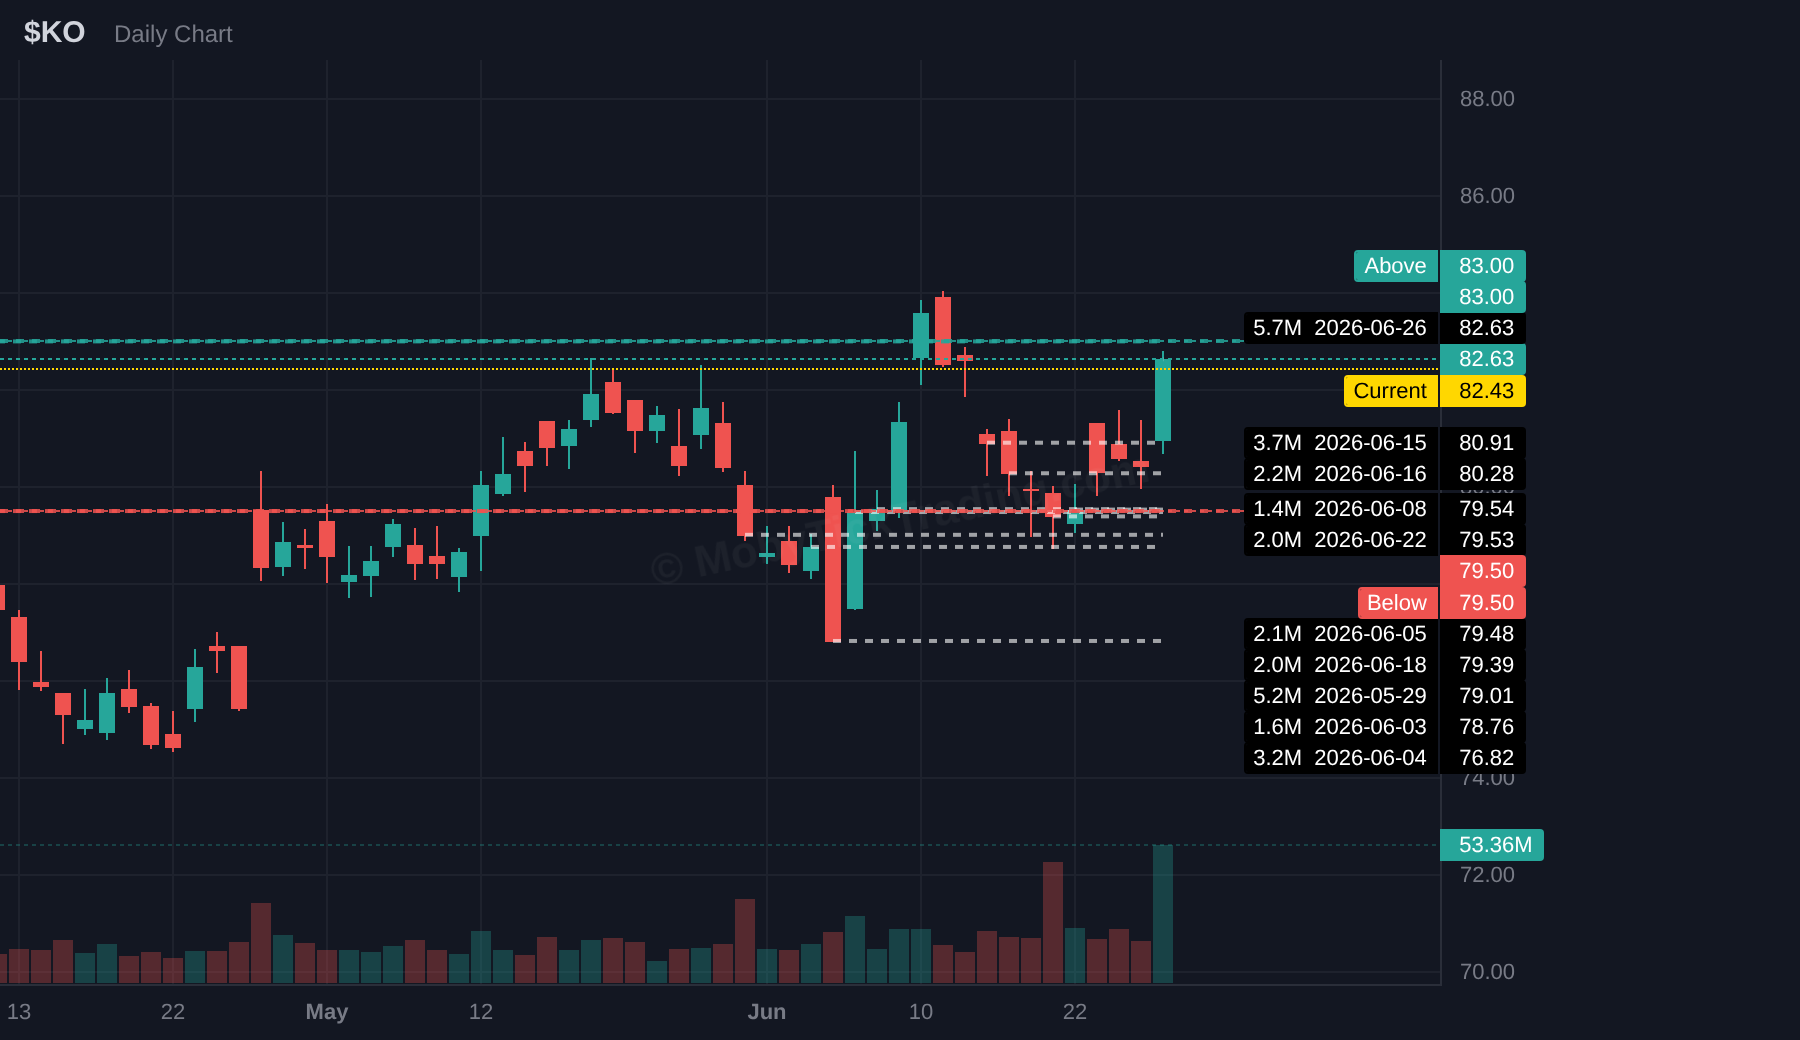
Dark pool weekly report for June 29, 2026. Rotation from AI/semis into defensives and utilities continues. MSFT shows +19% bull cross. NFP Thursday is the week's pivot.
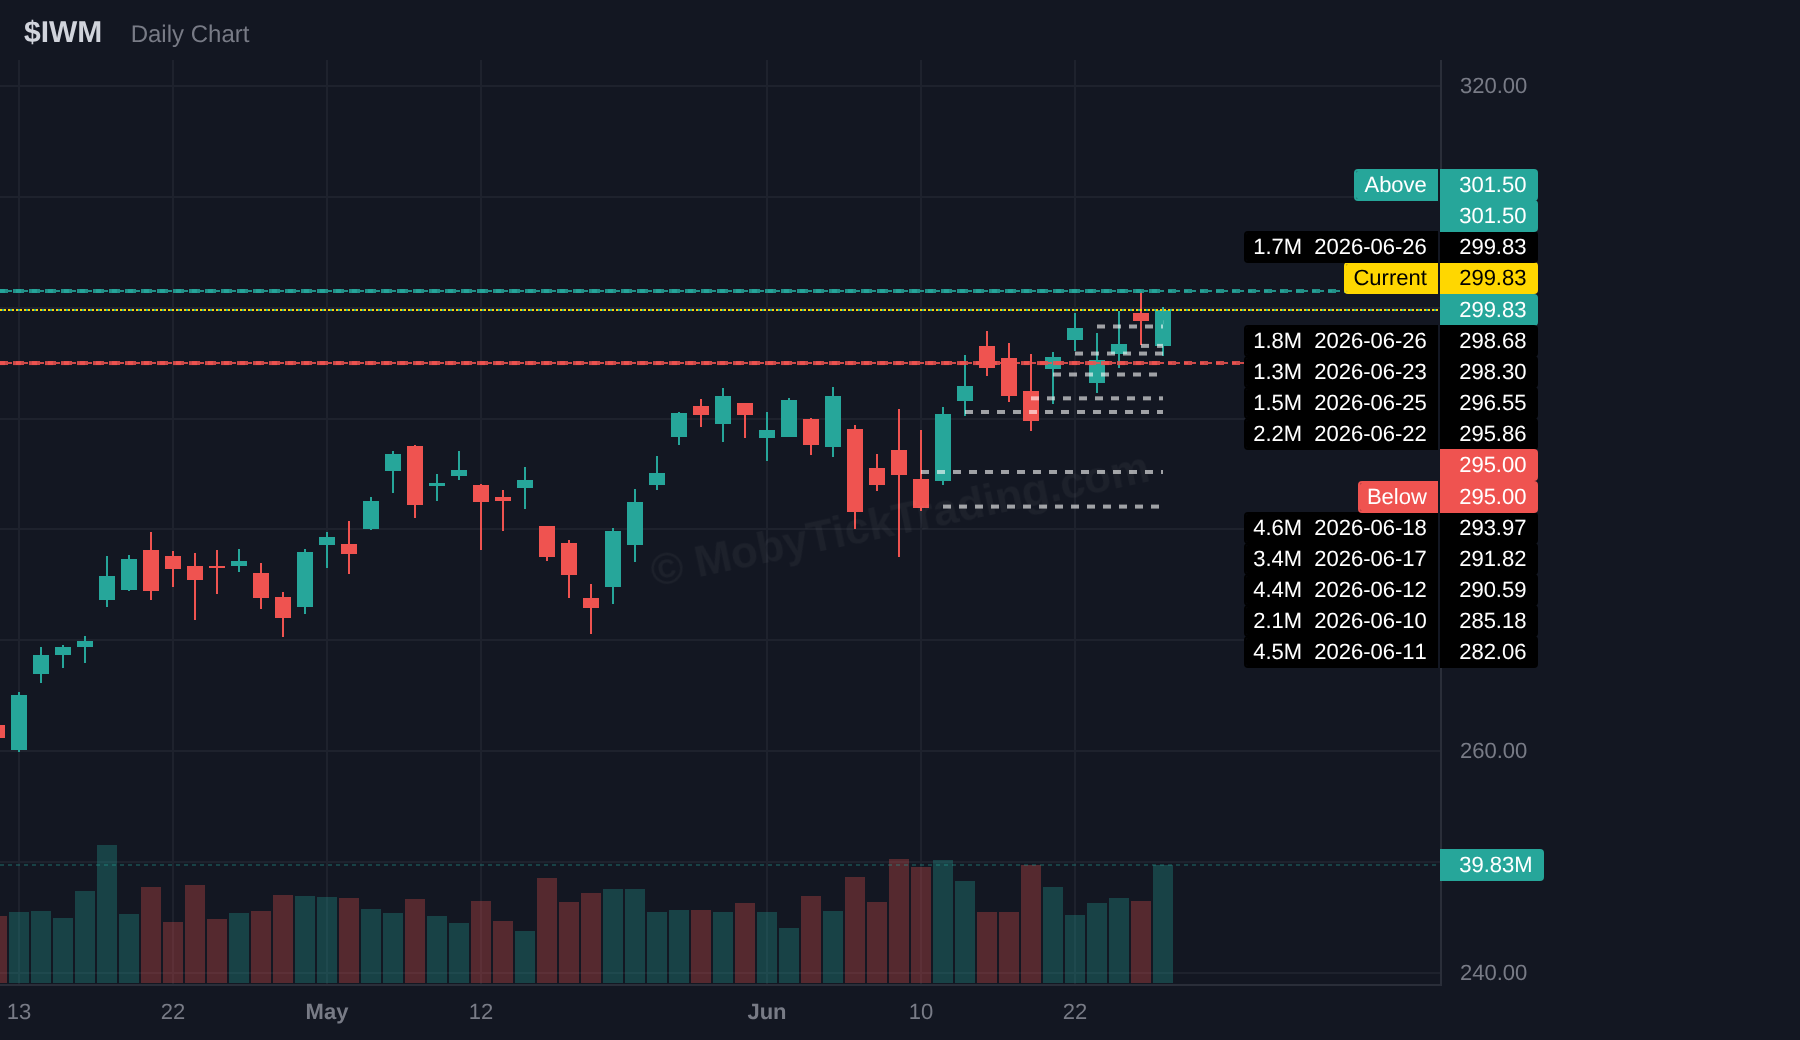
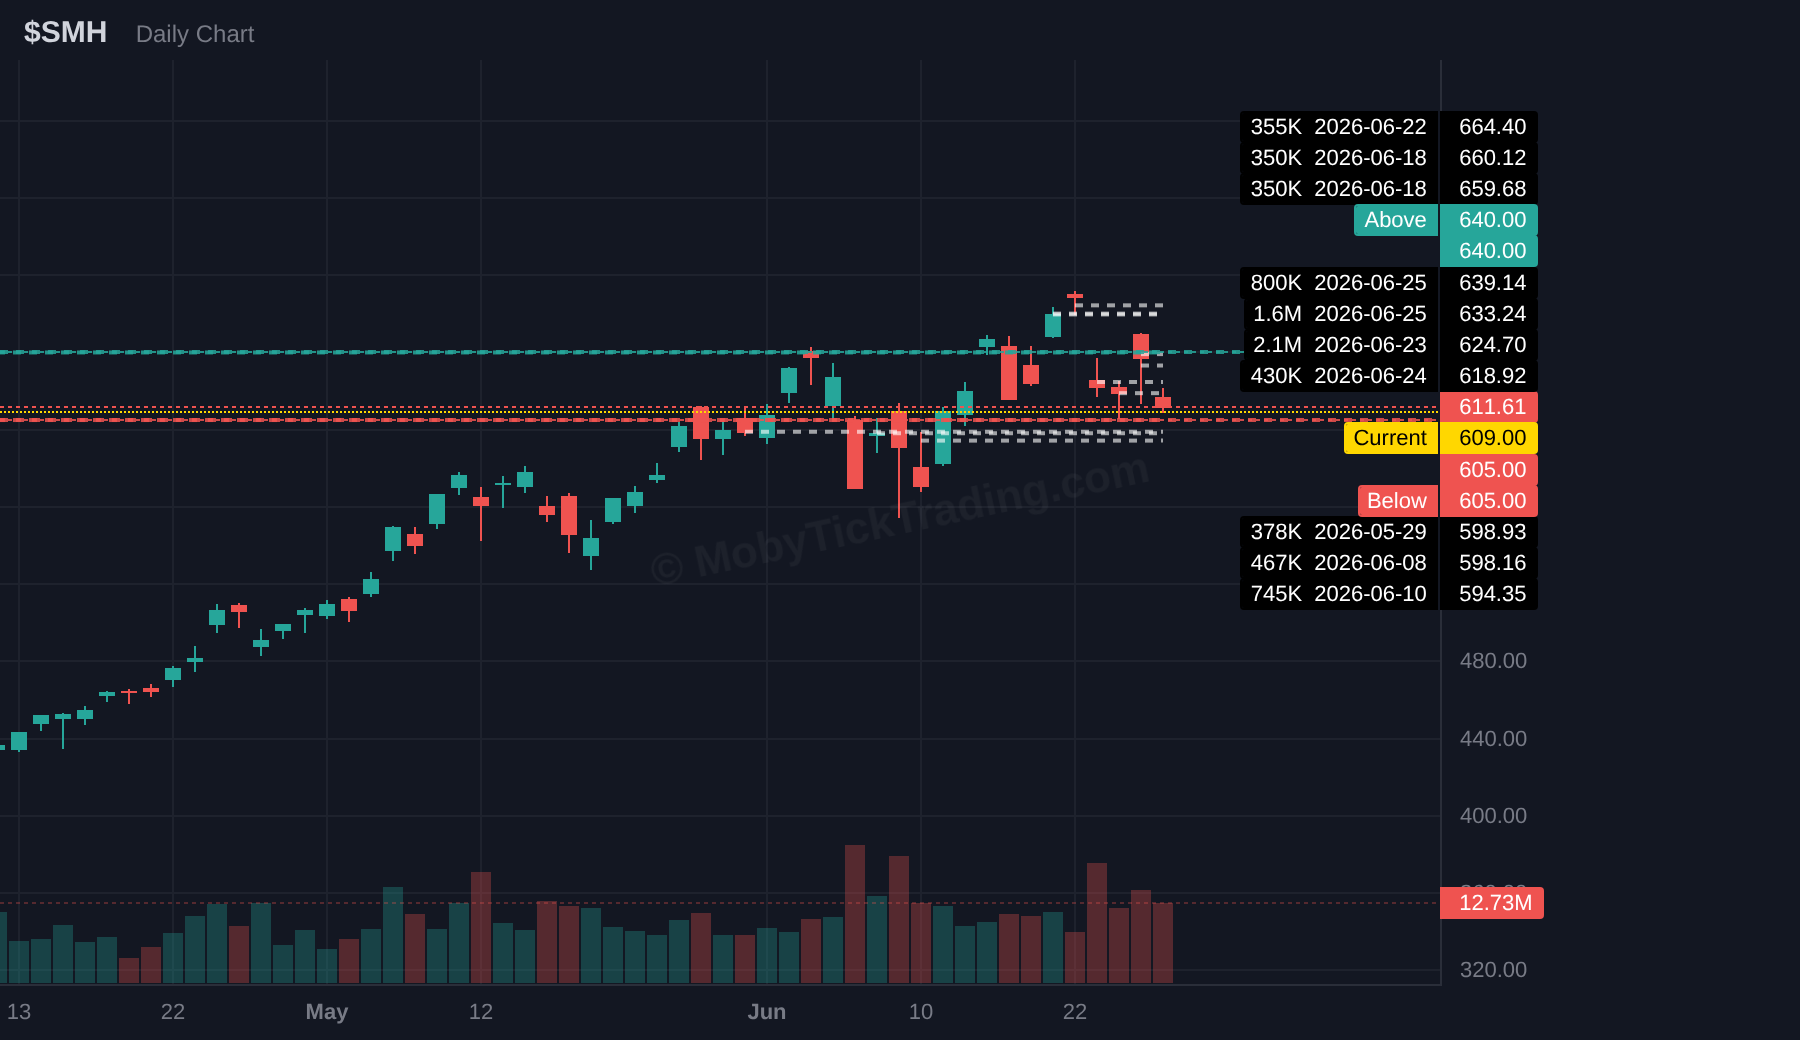
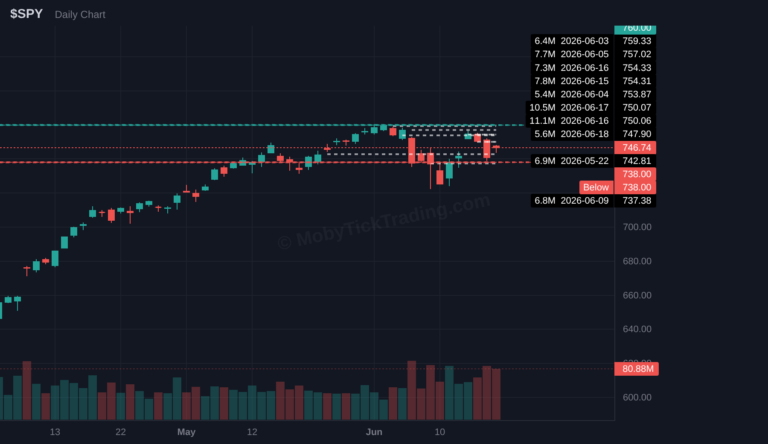
The week of June 22–26 closed lower across the major averages, but the more notable feature was the spread beneath the surface. The QQQ–IWM gap of roughly −5.7 percentage points is consistent with a rotation out of the most-crowded leadership rather than a broad-based selloff. Capital appeared to step back from AI-hardware names — SMH finished the week down about −8.8%, with semiconductor weakness traced in part to Samsung and SK Hynix — while defensives, utilities, value, and small caps that had lagged earlier in the quarter held up comparatively well.
| Ticker | Above | Below | Wk High | Wk Low | Wk Close | Result |
|---|---|---|---|---|---|---|
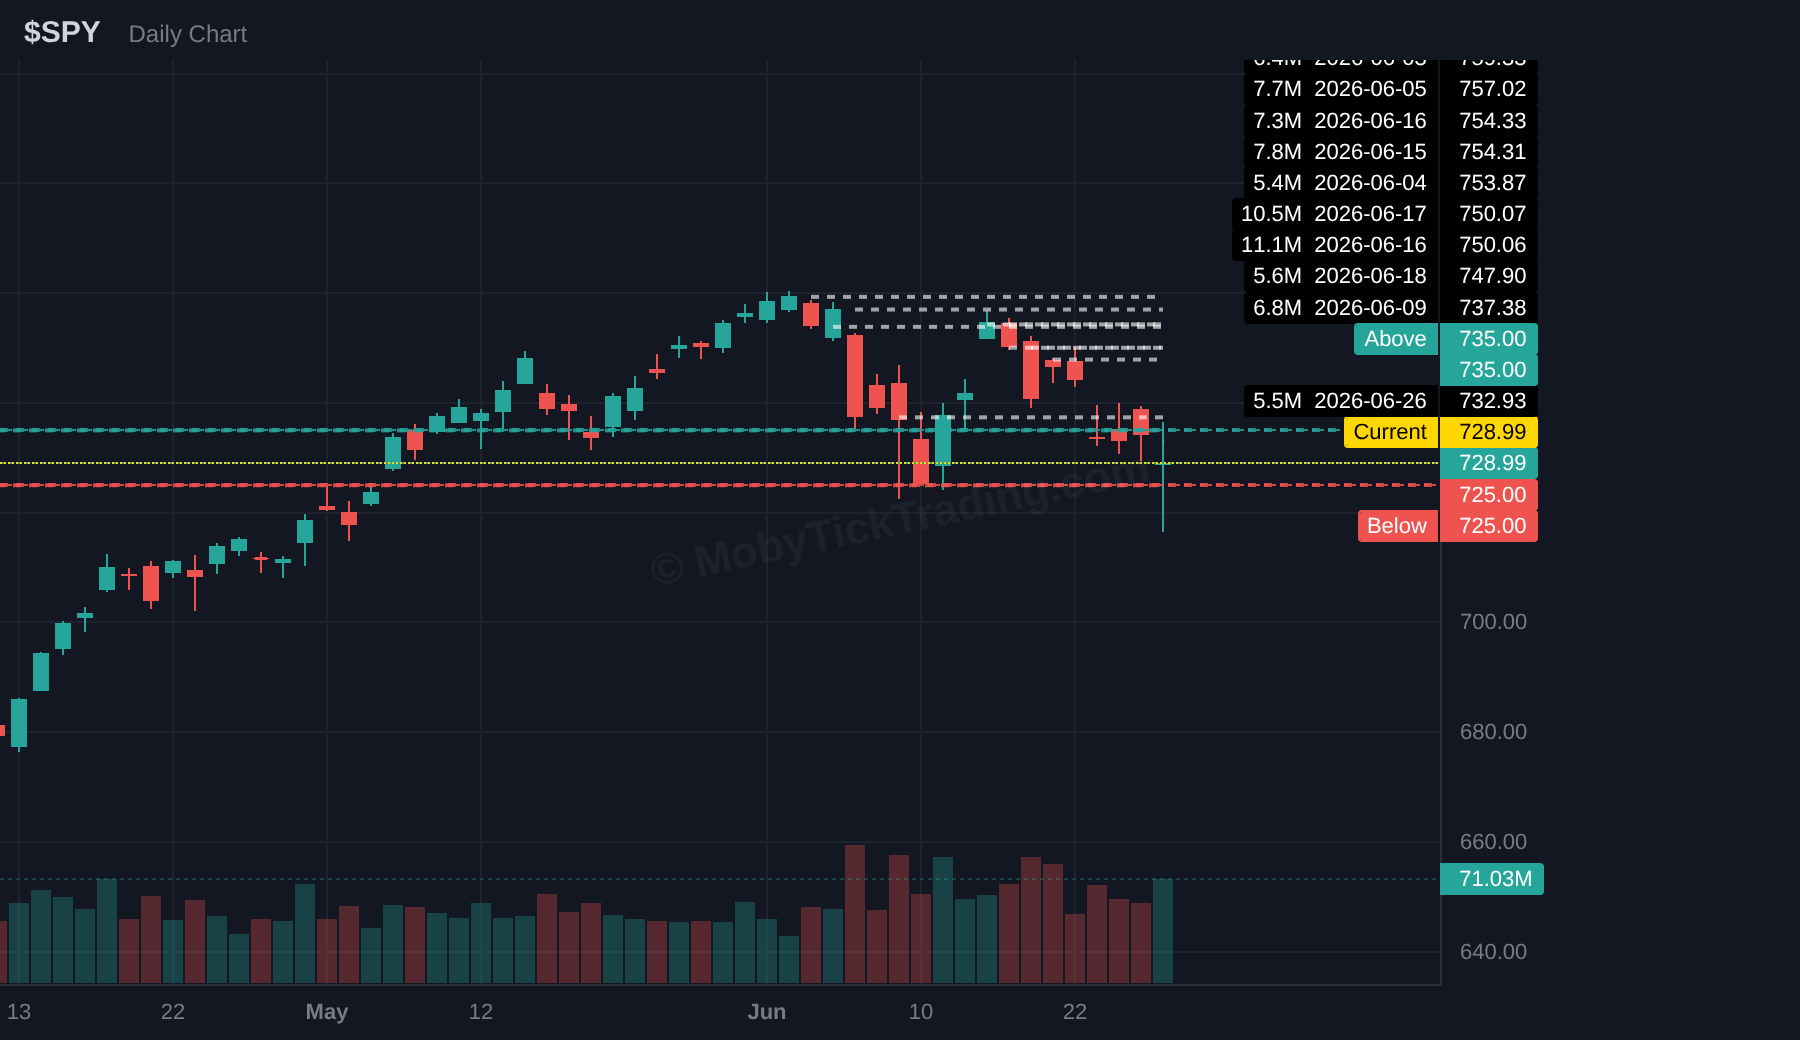
| SPY | $760.00 | $738.00 | $750.18 | $716.58 | $728.99 | 🔴 Below — +6 target(s) |
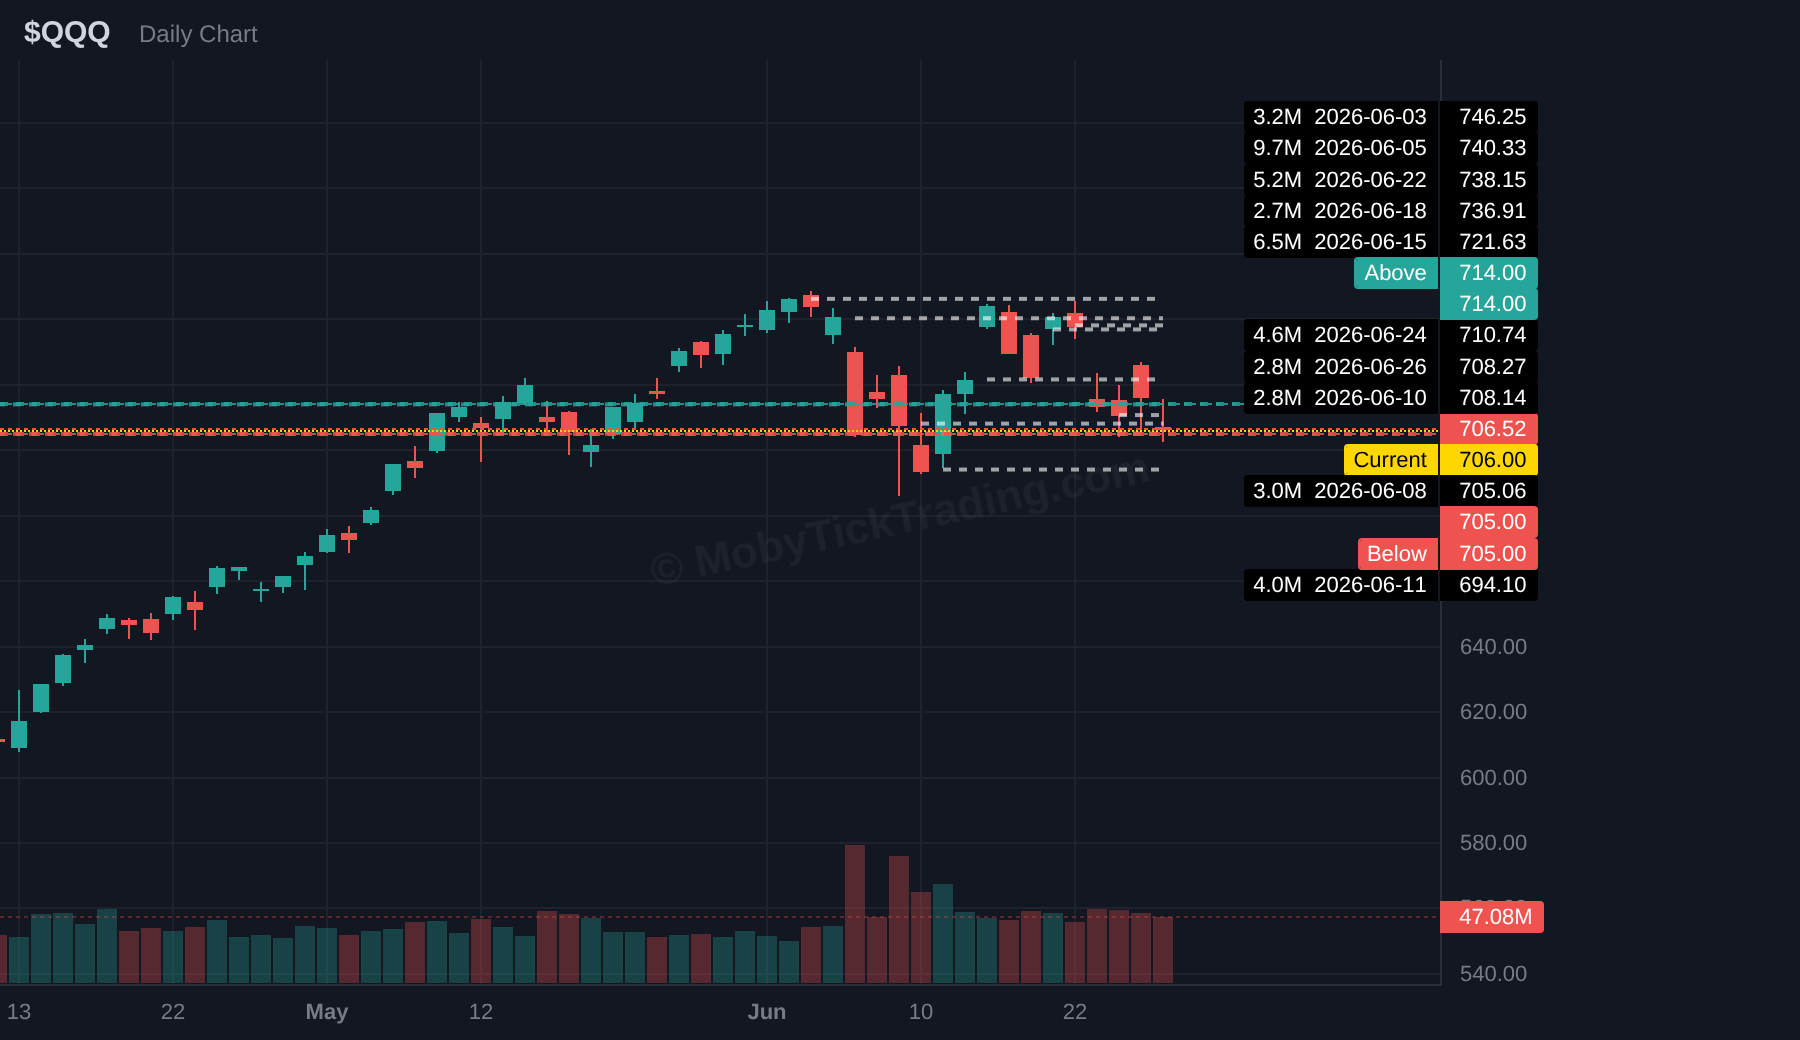
| QQQ | $747.50 | $720.00 | $745.45 | $702.81 | $706.52 | 🔴 Below — +6 target(s) |
| IWM | $298.00 | $288.00 | $301.50 | $292.40 | $299.83 | 🟢 Above — +1 target(s) |
| INTC | $136.25 | $116.00 | $141.45 | $125.41 | $128.32 | 🟢 Above — +1 target(s) |
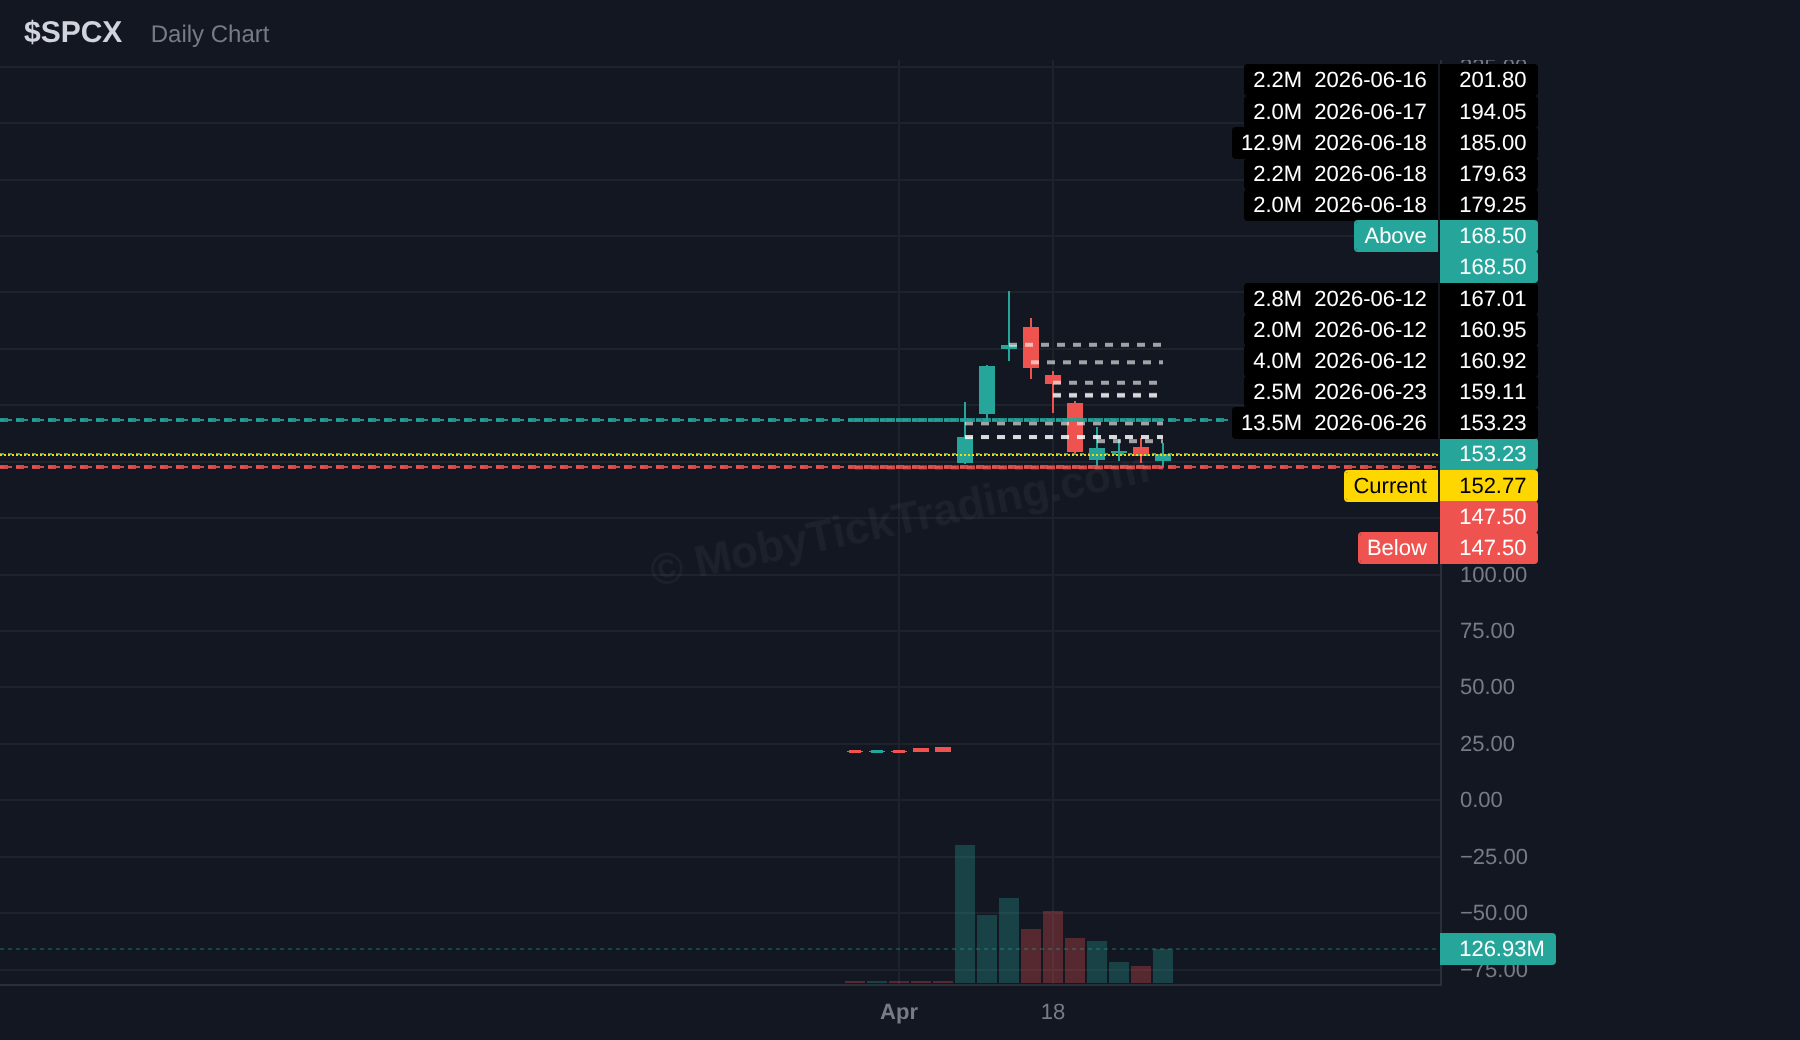
| SPCX | $215.00 | $172.00 | $176.75 | $147.11 | $153.23 | 🔴 Below — +5 target(s) |
| AVGO | $412.50 | $372.50 | $414.64 | $363.83 | $365.02 | 🔴 Below — +3 target(s) |
| MRVL | $330.00 | $280.00 | $314.17 | $262.00 | $266.77 | 🔴 Below — +3 target(s) |
| MU | $1,150.00 | $945.00 | $1,255.00 | $991.10 | $1,132.33 | 🟢 Above — +5 target(s) |
| TSM | $467.50 | $425.00 | $476.79 | $419.19 | $432.35 | 🔄 Both — Above +1T, Below +1T |
| EEM | $71.25 | $67.50 | $71.57 | $66.27 | $67.19 | 🔴 Below — +3 target(s) |
| CRWV | $125.00 | $100.00 | $119.19 | $93.50 | $96.58 | 🔴 Below — +3 target(s) |
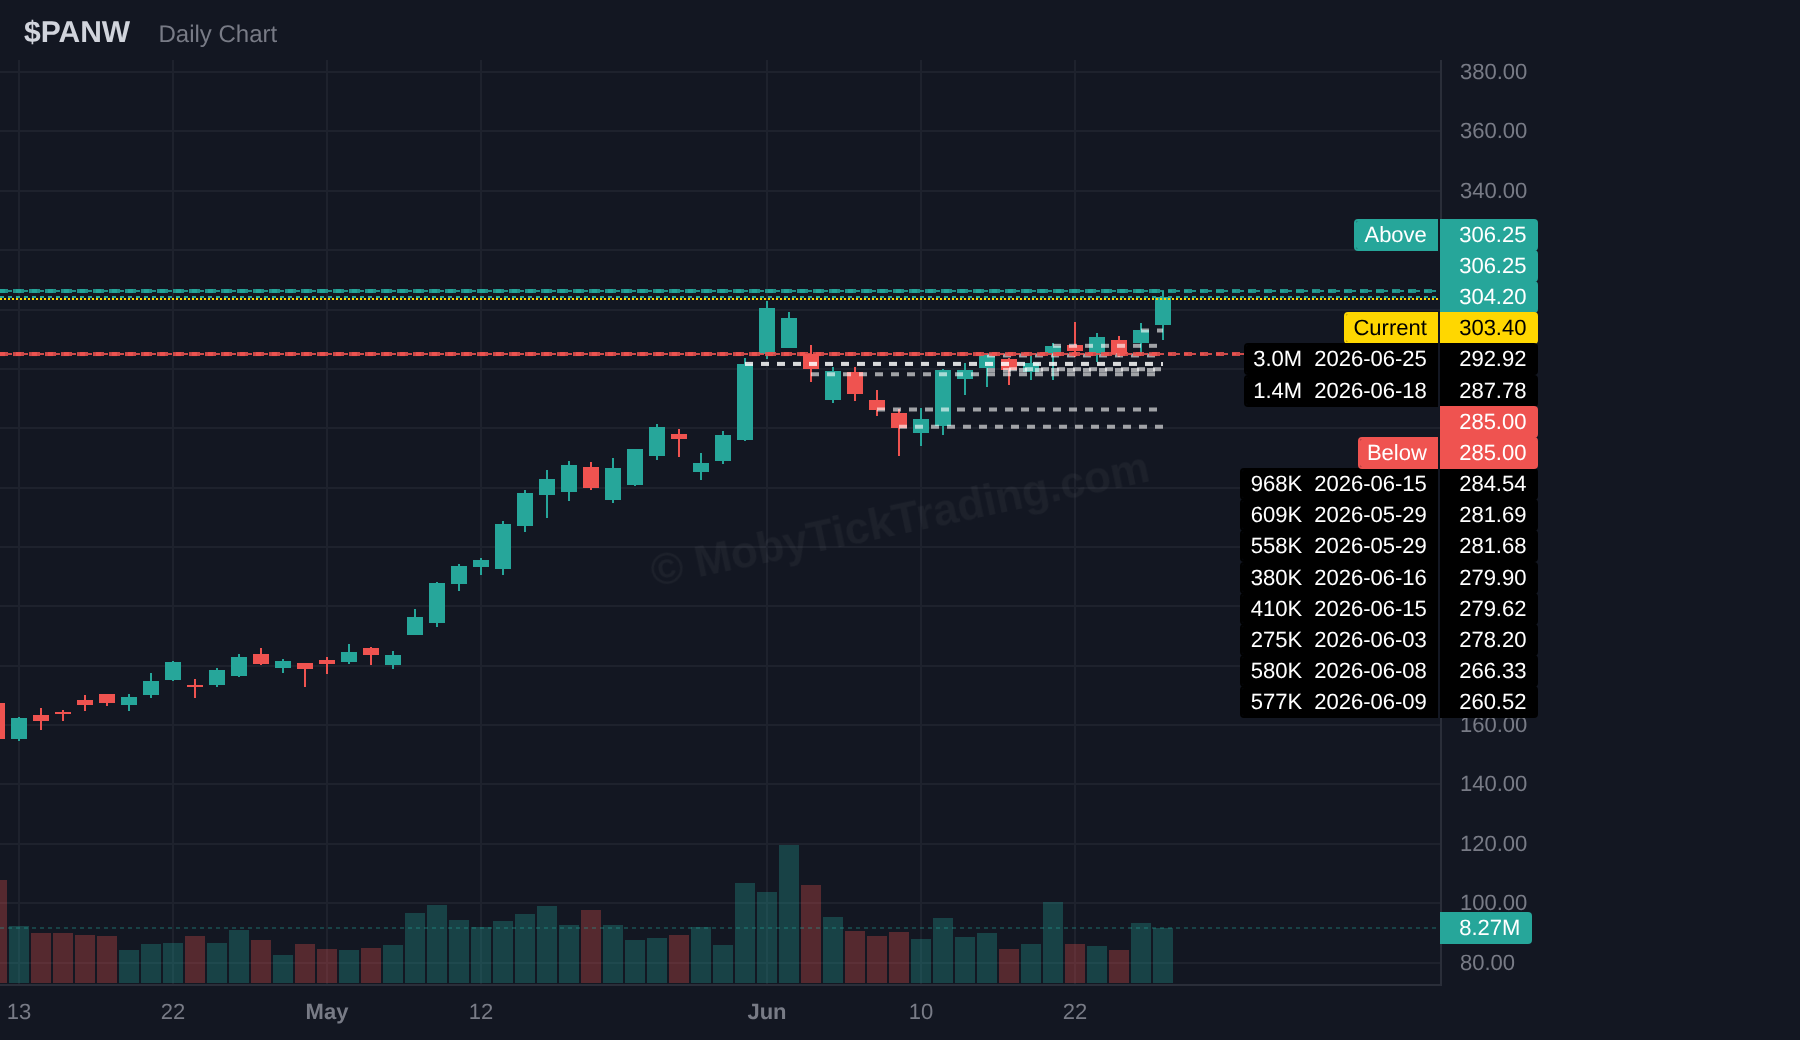
| PANW | $290.00 | $260.00 | $306.24 | $282.52 | $304.20 | 🟢 Above — +5 target(s) |
| ALAB | $420.00 | $350.00 | $440.99 | $372.50 | $391.74 | ⚪ No trigger |
The index complex dominated raw notional in the tracked prints, led by SPY at roughly $20.2B across 27 prints (avg ~$734.65) and QQQ near $18.4B across 18 prints (avg ~$722.22). IWM logged about $2.8B across 15 prints (avg ~$297.63) — a footprint that appears consistent with the rotation theme seen in price.
Below are the trigger levels for the week ahead. Bullish triggers in green, bearish triggers in red.
ETF-level prints skewed heavily toward the largest index products through the week. SPY (27 prints, ~$20.2B, avg ~$734.65) carried the highest print count of any instrument, a pattern that appears consistent with systematic rebalancing across the move. QQQ (18 prints, ~$18.4B, avg ~$722.22) closed the week below its average print price. IWM (15 prints, ~$2.8B, avg ~$297.63) ended above its average print — a small bull cross that may indicate the rotation theme also showed up in the tracked ETF tape.
Get institutional-grade dark pool intelligence delivered weekly. Track 10,000+ stocks with 5+ years of historical data.
Start Your 7-Day Free Trial →Disclaimer: This newsletter is for informational and educational purposes only. It does not constitute financial advice, investment advice, or a recommendation to buy or sell any security. Dark pool data reflects historical institutional trades and does not guarantee future price movement. Past performance does not predict future results. Trading involves substantial risk of loss.
About MobyTick: Institutional-grade dark pool and block trade intelligence for retail traders. 10,000+ stocks tracked. 5+ years of historical data. 91% accuracy rate on trade callouts.