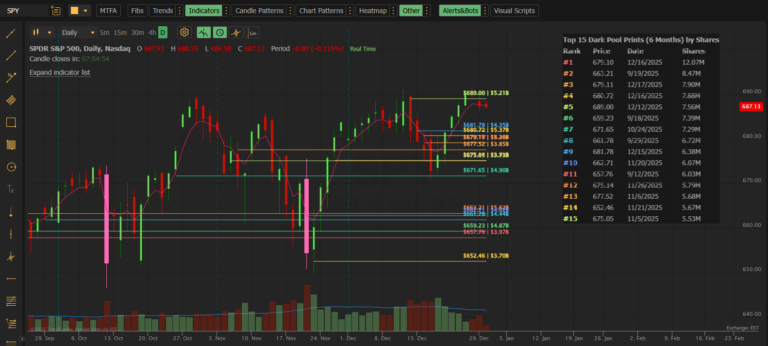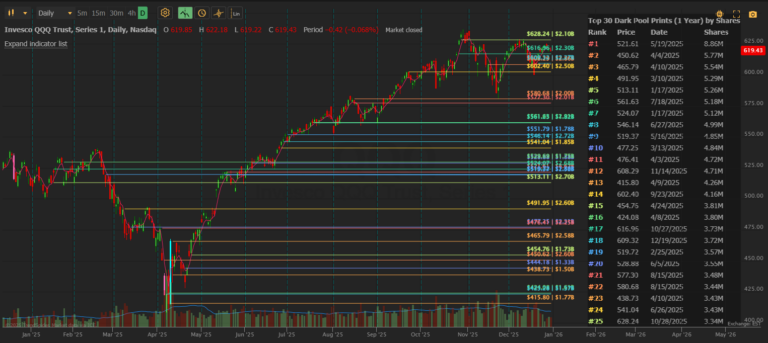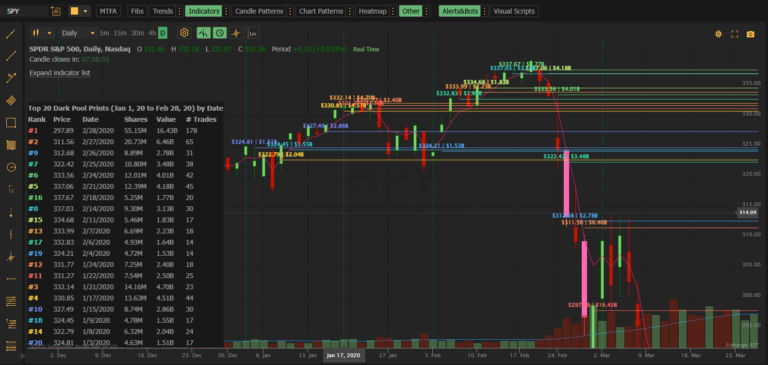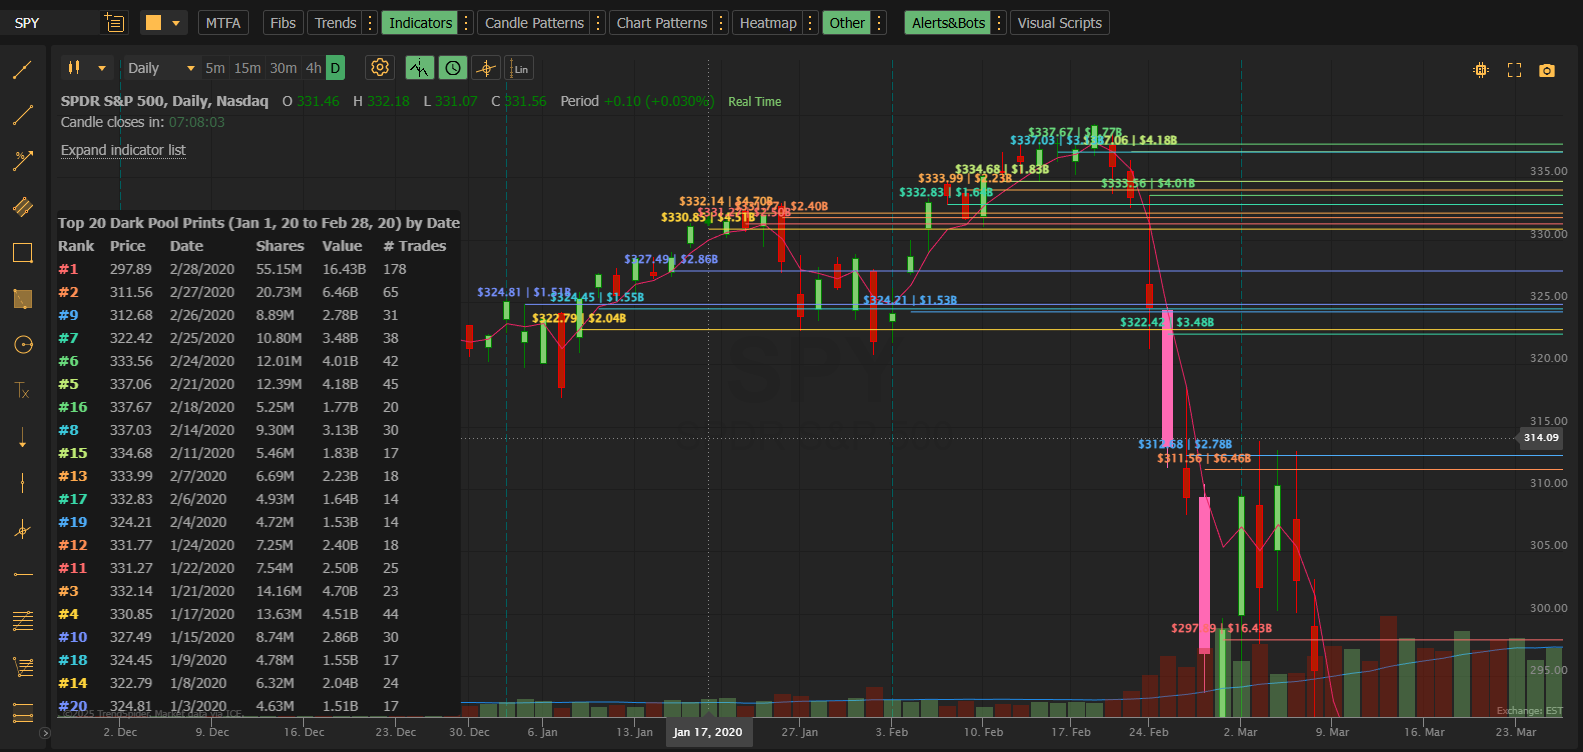
A detailed guide to every configuration option in the Moby Tick Dark Pool Levels indicator
Overview
The MobyTick Dark Pool Levels indicator displays institutional dark pool transactions as horizontal price levels on your TrendSpider chart. This reference guide explains every setting so you can customize the indicator to match your trading style.
Data Settings
These settings control what data is fetched and displayed.
Date Range
Default: 30 Days
Controls how far back to search for dark pool transactions.
| Option | Use Case |
|---|---|
| Today | Intraday scalping, seeing fresh institutional activity |
| Week | Short-term swing trades, recent positioning |
| 30 Days | Standard swing trading (recommended starting point) |
| 60 Days | Medium-term analysis |
| 90 Days | Longer swing trades, quarterly patterns |
| 6 Months | Position trading, major institutional zones |
| 1 Year | Long-term investing, historical support/resistance |
| Custom | Specific date range using the Start field |
Start (YYYYMMDD)
Default: Rolling based on Date Range selection
When Date Range is set to “Custom,” enter your desired start date in YYYYMMDD format.
Example: 20250601 = June 1, 2025
Note: Data availability extends back approximately 5 years to January 2020
Number of Prints
Default: 30
Range: 1–30
How many price levels to display on the chart. Levels are ranked by the sort criteria you select.
| Setting | Use Case |
|---|---|
| 5–10 | Clean chart, only major levels |
| 15–20 | Balanced view |
| 30 | Maximum detail, see all significant activity |
Pro Tip: Start with 10–15 to avoid chart clutter, then increase if you want more granularity.
Minimum Share Size
Default: 50,000
Range: 50,000–100,000,000
Filters out smaller transactions. Only prints with share volume ≥ this value will appear.
| Setting | Use Case |
|---|---|
| 50,000 | See more activity (good for lower-volume stocks) |
| 100,000 | Standard filter |
| 500,000 | Focus on large institutional trades only |
| 1,000,000+ | Major block trades only (best for high-volume stocks like SPY, AAPL) |
Guidance by Stock Type:
- Large-cap (SPY, QQQ, AAPL): 500K–1M minimum
- Mid-cap: 100K–500K minimum
- Small-cap: 50K–100K minimum
Table Settings
Control the on-chart data table that displays dark pool transaction details.
◆ Show Table
Default: On (checked)
Toggle the table visibility. When enabled, a table appears on your chart showing details for each displayed level.
↳ Table Sort By
Default: Shares (Largest)
Determines the order of rows in the table AND the ranking of lines on the chart.
| Option | Sorts By |
|---|---|
| Shares (Largest) | Total share volume (highest first) — recommended |
| Price (Highest) | Price level (highest first) |
| Date (Newest) | Most recent transaction first |
↳ Table Columns
Default: Standard (Rank, Price, Date, Shares)
Choose which columns appear in the table.
| Preset | Columns Displayed |
|---|---|
| Standard (Rank, Price, Date, Shares) | Rank, Price, Date, Shares |
| Minimal (Rank, Price) | Rank, Price |
| Compact (Rank, Price, Shares) | Rank, Price, Shares |
| Date Focus (Rank, Price, Date) | Rank, Price, Date |
| Value Focus (Rank, Price, Value) | Rank, Price, $ Value |
| Standard + Value | Rank, Price, Date, Shares, Value |
| No Value | Rank, Price, Date, Shares, # Trades |
| Full (All Columns) | All available columns |
| No Rank | Price, Date, Shares, Value, # Trades |
Table Properties (EDIT button)
Opens TrendSpider’s standard table editor where you can adjust:
- Position: Where the table appears (Top Left, Top Right, Bottom Left, Bottom Right)
- Font size
- Background opacity
- Border styling
Label Settings
Control the text labels that appear on each horizontal price line.
◆ Show Labels
Default: On (checked)
Toggle label visibility on the price level lines.
↳ Label Position
Default: Left
Where labels appear on each horizontal line.
| Option | Description |
|---|---|
| Left | Labels at the left edge of the line |
| Right | Labels at the right edge of the line |
Tip: Use “Left” if your chart has price action on the right side; use “Right” if you want labels near current price.
↳ Label Format
Default: Price + Size
What information to display in each label.
| Format | Example Output |
|---|---|
| Price Only | $685.50 |
| Size Only | 2.5M |
| Date Only | 12/15/2025 |
| Value Only | $1.7B |
| Price + Size | $685.50 | 2.5M |
| Price + Date | $685.50 | 12/15 |
| Price + Value | $685.50 | $1.7B |
| Size + Date | 2.5M | 12/15 |
| Size + Value | 2.5M | $1.7B |
| Date + Value | 12/15 | $1.7B |
| Price + Size + Date | $685.50 | 2.5M | 12/15 |
| Price + Size + Value | $685.50 | 2.5M | $1.7B |
| Price + Date + Value | $685.50 | 12/15 | $1.7B |
| Size + Date + Value | 2.5M | 12/15 | $1.7B |
| All Details | $685.50 | 2.5M | 12/15 | $1.7B |
Line Colors (DP Line 1–30)
Each of the 30 possible price levels has its own color swatch. This allows you to:
- Color-code by rank: Default colors often gradient from one color to another (e.g., green → yellow → red) to visually distinguish the largest prints from smaller ones
- Match your chart theme: Customize colors to fit your personal chart setup
- Highlight specific levels: Make important ranks stand out
Default Color Theme: All Yellow (as shown in screenshot)
Click any color swatch to open the color picker and customize that specific line.
Recommended Configurations
Day Trading / Scalping
- Date Range: Today or Week
- Number of Prints: 10–15
- Minimum Share Size: 100,000+
- Label Format: Price + Size
- Table: On, Compact preset
Swing Trading
- Date Range: 30 Days
- Number of Prints: 20–30
- Minimum Share Size: 50,000–100,000
- Label Format: Price + Size + Date
- Table: On, Standard preset
Position Trading / Investing
- Date Range: 6 Months or 1 Year
- Number of Prints: 30
- Minimum Share Size: 500,000+
- Label Format: All Details
- Table: On, Full preset
Clean Chart (Minimal)
- Date Range: 30 Days
- Number of Prints: 5
- Minimum Share Size: 1,000,000+
- Show Labels: Off
- Show Table: Off
Pro Tips
- Layer multiple instances: Add the indicator twice — once for “Today” and once for “30 Days” — to see fresh activity overlaid on established levels.
- Adjust minimum size by ticker: High-volume stocks (SPY, QQQ) need higher minimums; lower-volume stocks need lower minimums.
- Use table sorting strategically: Sort by “Date (Newest)” when looking for fresh institutional activity; sort by “Shares (Largest)” when identifying the strongest levels.
- Simplify labels for screenshots: Use “Price Only” or “Price + Size” for clean chart screenshots to share.
Dark Pool Levels by MobyTick Trading — Institutional Intelligence for Retail Traders