Physical Address
304 North Cardinal St.
Dorchester Center, MA 02124
Physical Address
304 North Cardinal St.
Dorchester Center, MA 02124

Institutional money moves billions through dark pools every day. A stock flow analysis tool reveals that hidden activity, giving traders visibility into where the “smart money” is positioning. This guide compares the leading tools and shows you how to use flow data in your trading.
Stock flow analysis examines the movement of capital through the market — particularly large institutional trades. Unlike traditional technical analysis that studies price patterns on charts, flow analysis focuses on actual trades being executed, particularly those large enough to signal institutional involvement.
Think of it like tracking river currents. On the surface, water moves in visible patterns. But underneath, powerful currents drive the overall direction. Stock flow analysis tools detect these underlying currents by monitoring dark pool prints — large block trades executed on private exchanges that account for approximately 30-40% of all U.S. equity volume.
Institutional investors manage trillions of dollars. When they move capital, they move it decisively — and they must do so in ways that don’t immediately reveal their intentions. Dark pools let them execute large orders privately, and those executions are reported to FINRA after the fact.
Here’s what dark pool flow data reveals:
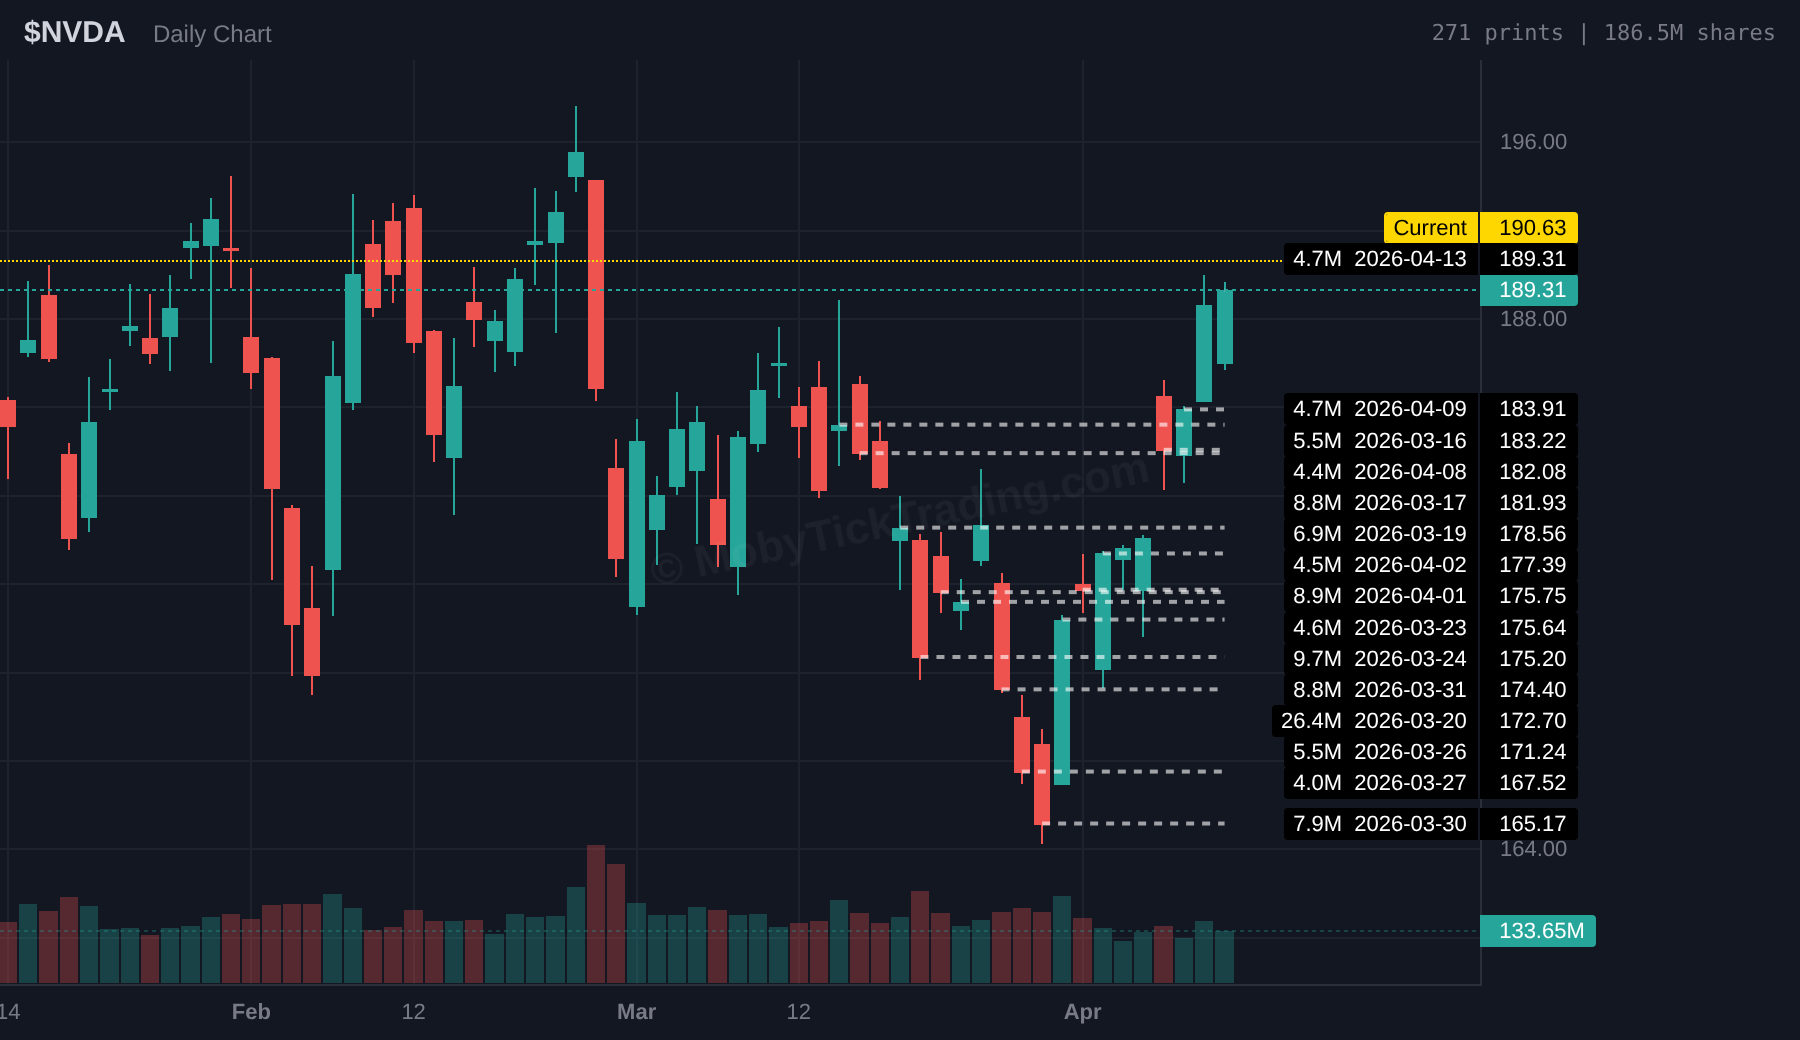
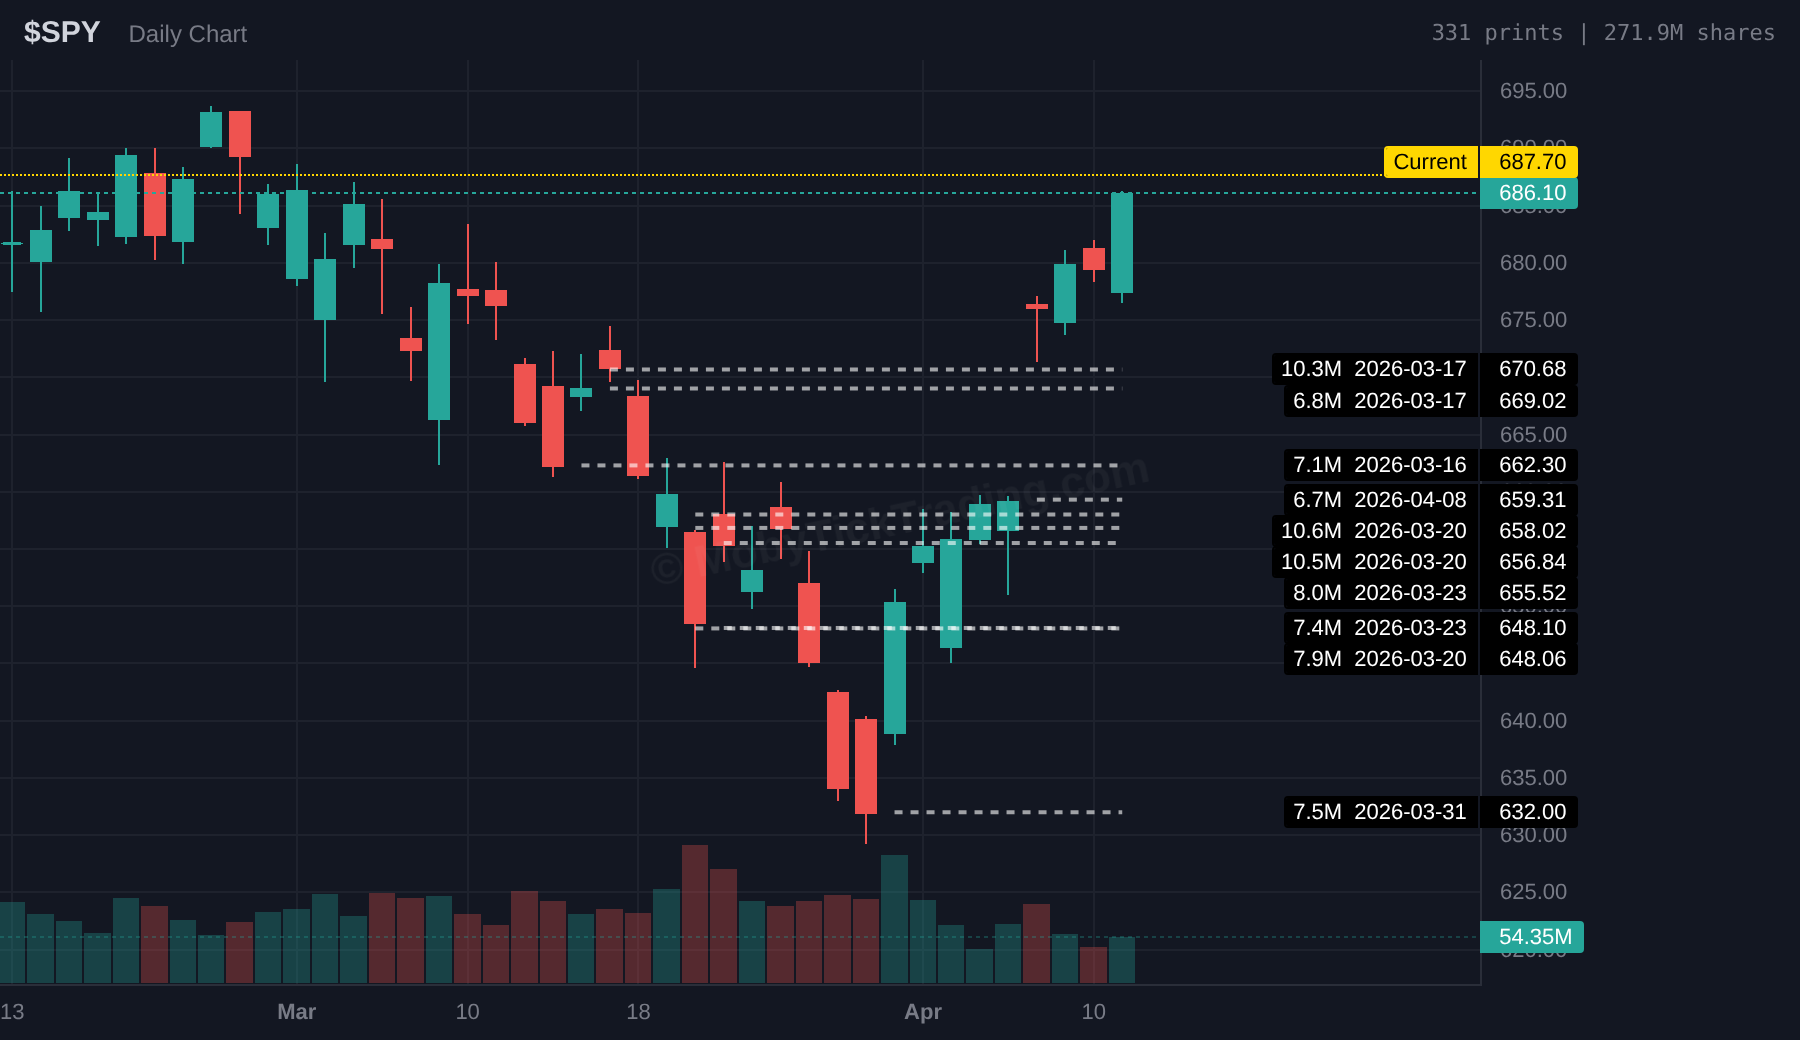
When institutions allocate significant capital to specific stocks, it reflects genuine conviction. Dark pool data from the week of March 16-24, 2026 illustrates this across key stocks:
| Ticker | Largest Print (Period) | Dollar Value | Price Level |
|---|---|---|---|
| NVDA | 26.4M shares | $4.55 billion | $172.70 |
| SPY | 10.6M shares | $6.96 billion | $658.02 |
| MSFT | 7.3M shares | $2.77 billion | $381.87 |
| AVGO | 8.2M shares | $2.64 billion | $322.79 |
| AMZN | 7.1M shares | $1.45 billion | $205.37 |
| MU | 4.5M shares | $1.92 billion | $422.90 |
These figures represent individual dark pool prints — not total daily volume. Each one signals where an institution committed significant capital in a single execution.
Flow analysis reveals broader thematic moves. During the March 16-24 window, semiconductor stocks showed concentrated institutional interest:
Combined, these four semiconductor stocks represent over $9.8 billion in dark pool prints within a single week — concentrated in the same sector. This is the kind of cross-stock pattern that flow tools reveal but no public chart can show.
When institutions execute large orders at specific price points, those levels often become support or resistance zones. A billion-dollar block trade at a particular price means real money was committed there.
For SPY, the $658 level ($6.96B on March 20) became a significant reference point during the March-April 2026 period. As of April 14, SPY trades at $687.92 — above this zone — suggesting the institutional positioning at $658 has since been tested by price action.
Flow tools aggregate data from multiple sources:
Raw trade data includes millions of daily transactions. Flow tools apply filters to isolate significant activity:
The filtered data gets presented through:
Not all dark pool tools are equal. Here’s how the leading platforms compare:
| Feature | MobyTick | Unusual Whales | FlowAlgo | Cheddar Flow |
|---|---|---|---|---|
| Stocks Tracked | 10,000+ | ~3,000 | ~2,000 | ~2,500 |
| Historical Data | 6+ years | Limited | Limited | Limited |
| Real-Time Alerts | ✅ | ✅ | ✅ Voice | ✅ |
| Opening/Closing Filters | ✅ | ⚠️ Limited | ⚠️ Limited | ⚠️ Limited |
| Accumulation Signals | ✅ | ⚠️ Basic | ❌ | ❌ |
| Starting Price | $19.99/mo | $50/mo | $149/mo | $85-99/mo |
MobyTick specializes in institutional flow tracking through dark pool and block trade data:
Stock flow analysis tools have transformed retail traders’ ability to see what was once invisible — institutional money movement. The data is verifiable: institutions move billions through alternative venues every trading day. SPY alone saw a $6.96B dark pool print on a single day. NVDA showed a $4.55B print.
The question isn’t whether institutions are moving money. They always are. The question is whether you can see where.
Ready to track institutional flow? Start your free trial at MobyTick and see dark pool activity across 10,000+ stocks.
Data verified against MobyTick API as of April 14, 2026. All dollar values represent aggregate dark pool print values from FINRA Trade Reporting Facility data.