Physical Address
304 North Cardinal St.
Dorchester Center, MA 02124
Physical Address
304 North Cardinal St.
Dorchester Center, MA 02124

Verified SPCX IPO stats, dark pool concentration levels, and what SpaceX's first trading day revealed about institutional positioning.
SpaceX’s IPO was the biggest public-market debut on record. The headline number was the roughly $75 billion raise. The more useful trading takeaway was what happened once SPCX actually started trading: large off-exchange prints clustered at a handful of very specific price levels.
SPCX priced at $135, opened at $150.00, traded as high as $176.52, fell as low as $149.34, and closed its first session at $160.95 on volume of roughly 519.2 million shares. That left the stock up about 19.2% versus the IPO price on day one.
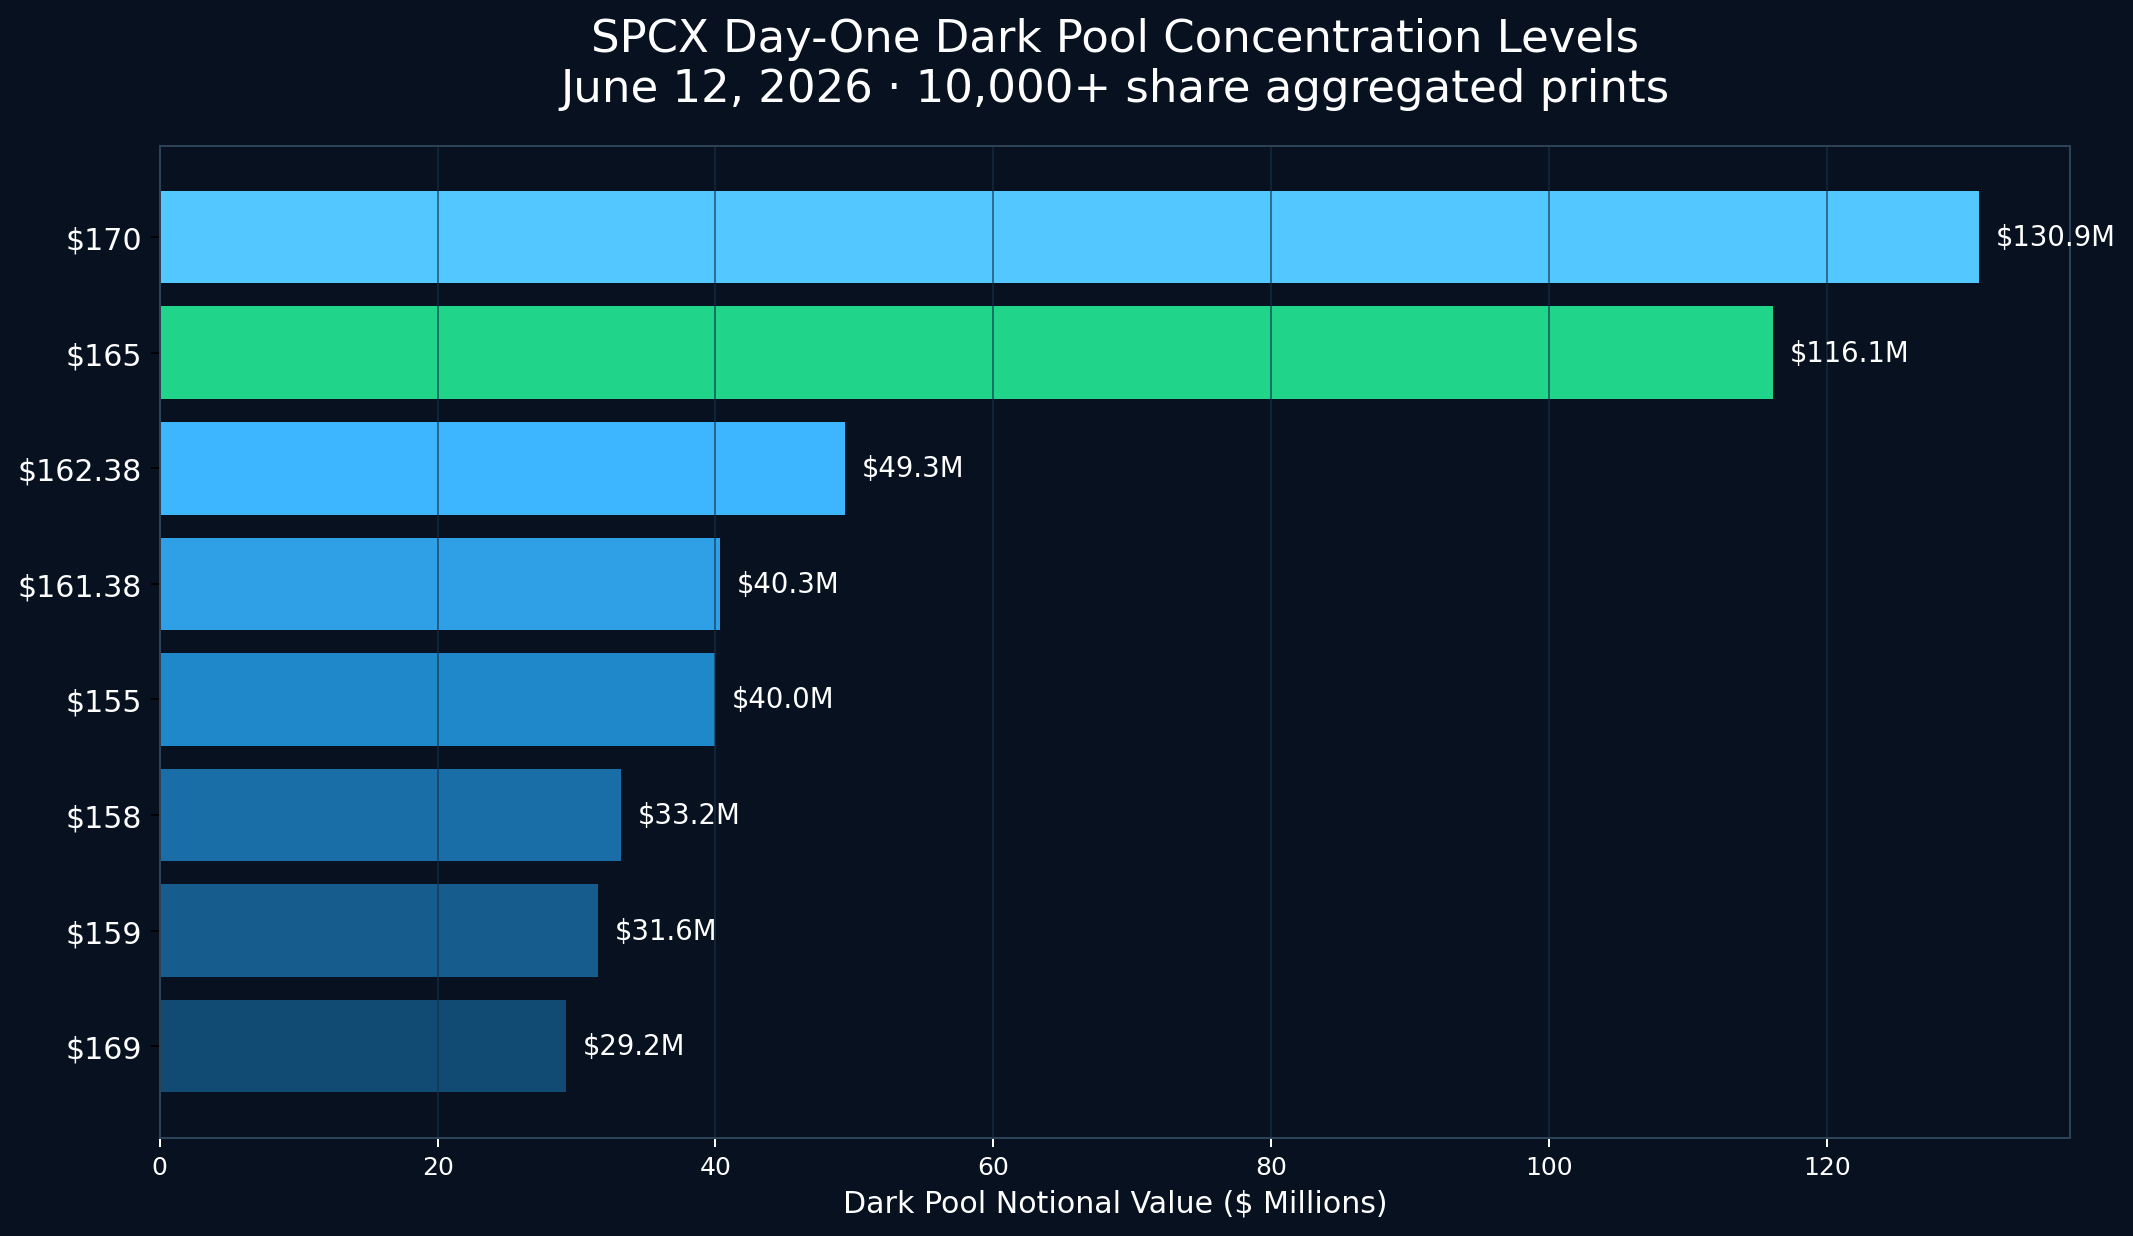
Behind that lit-market volatility, MobyTick’s dark pool data for June 12 showed 4,027,612 shares traded in aggregated 10,000+ share dark pool blocks, representing roughly $660.7 million in notional value. The heaviest concentrations were at $170.00 and $165.00.
CNBC reported ahead of the debut that SpaceX set its IPO price at $135, targeted an initial valuation near $1.77 trillion, generated about $18.7 billion in 2025 revenue, and posted a multibillion-dollar operating loss. In other words: a historic listing, but one still being valued more on future expectations than traditional present-day fundamentals.
The debut also pushed Elon Musk into a new headline category. CNBC reported that with SpaceX opening on the Nasdaq, Musk became the world’s first trillionaire based on the combined value of his SpaceX and Tesla holdings. The celebrity angle got most of the mainstream attention. For traders, though, the more actionable story was the price map institutions built once the stock opened.
While the public chart swung between $150 and the upper $170s, institutions also moved meaningful size off-exchange. For June 12 alone, MobyTick’s aggregated dark pool data showed 21 distinct price clusters in 10,000+ share blocks. Two levels stood far above the rest.
| Level | Shares | Notional Value | Print Count |
|---|---|---|---|
| $170.00 | 770,254 | $130.94M | 5 |
| $165.00 | 703,673 | $116.11M | 7 |
| $162.38 | 303,700 | $49.31M | 1 |
| $161.38 | 250,000 | $40.35M | 1 |
| $155.00 | 258,000 | $39.99M | 4 |
| $158.00 | 210,000 | $33.18M | 2 |
| $159.00 | 198,600 | $31.58M | 2 |
| $169.00 | 172,951 | $29.23M | 1 |
The day-one tape effectively concentrated most of the biggest off-exchange activity into a fairly tight upper range. Into the after-hours session, SPCX was trading back near the middle of that cluster, around the mid-$160s. That does not tell us intent with certainty. It does tell us where large participants were willing to negotiate real size.
One honest caveat we always insist on: dark pool prints are unsigned. A large block at $165 or $170 tells you where size changed hands, not whether the initiating party was aggressively buying or selling. The edge is in seeing where institutional inventory traded — not pretending the tape is a crystal ball.
A dark pool is a private venue where large orders are matched away from the public exchanges. The point is not secrecy for its own sake. The point is to reduce market impact. A fund trying to move a nine-figure order on the open book would push price against itself and telegraph its intentions to everyone else. Off-exchange matching helps reduce that footprint.
For any IPO, the first trading session is only part of the story. The other part is supply. Newly public names begin with a tradable float, while much larger insider and early-holder stakes typically remain subject to prospectus-based lock-up restrictions and scheduled unlock windows. For traders, that means the first-week tape is only the opening phase of price discovery.
That’s one reason dark pool data matters so much in fresh listings. As the float evolves and more inventory becomes eligible to move, off-exchange prints can help reveal where large positions are actually changing hands instead of where social media happens to be excited.
SPCX was not being priced in one place only. On day one, traders had the lit Nasdaq market, off-exchange block activity, extended-hours trading, and broader derivatives-driven sentiment all reacting at once. That is normal for a mega-cap debut with this much attention. The result is a chart that looks noisy on the surface and a much cleaner size map underneath it.
Fresh IPO data can change quickly as additional reporting settles in, so the important thing is not treating day one like a final verdict. It is using the first session to identify where institutions showed up with real size.
SPCX’s debut rewrote the record books, but the most practical trading takeaway was simpler: more than $660 million in large off-exchange SPCX prints concentrated most heavily at $170 and $165 on the first day of trading. The headlines will keep focusing on the IPO spectacle and Musk’s net worth. Traders are usually better served by watching where size actually traded.
If you want to monitor evolving institutional levels in fresh listings and other high-attention names, dark pool data fills in the part of the market that standard charts miss.
Sources used for fact-checking: Yahoo Finance chart data for June 12 OHLC/volume, MobyTick dark pool prints API for SPCX aggregated 10,000+ share blocks, CNBC reporting on the IPO pricing and day-one trading, and major press coverage of Musk’s trillionaire milestone. For educational and informational purposes only. Not investment advice.