Physical Address
304 North Cardinal St.
Dorchester Center, MA 02124
Physical Address
304 North Cardinal St.
Dorchester Center, MA 02124
Reading time: 8 minutes
So, are dark pools bad for retail traders?
The honest answer is more nuanced than most headlines suggest.
Dark pools can make markets harder to interpret. They reduce pre-trade transparency. They fragment liquidity. They can leave you looking at a public chart that does not show the full trading picture.
But dark pools also serve a legitimate purpose. Large institutions need ways to execute substantial orders without immediately advertising their presence to the entire market.
The real retail advantage is not pretending to see inside every transaction. It is learning how to use available post-trade information responsibly.
A dark pool is a type of alternative trading system, or ATS, where buy and sell orders are not publicly displayed before execution.
Traditional exchanges show visible bid and ask prices. Market participants can see displayed orders and available size. Dark pools operate differently. The orders remain private until a trade occurs.
This does not mean the trades disappear.
According to FINRA’s explanation of dark pools, listed stock transactions executed through ATSs must be reported to a FINRA Trade Reporting Facility and published on the consolidated tape after execution.
That distinction matters:
This is why dark-pool analytics are best understood as post-trade intelligence.
They can help you investigate what happened. They cannot guarantee what happens next.
Large funds, asset managers, pension funds, and other institutions may trade positions involving hundreds of thousands or millions of shares.
If the full order were displayed publicly, other market participants could react. The price could move before the institution completes its transaction. That creates market impact and can lead to worse execution.
Dark pools can help institutions:
Consider a hypothetical institution that wants to trade 500,000 shares. Displaying the entire order on a public exchange could attract attention and move the price.
A dark venue may provide another execution path.
That does not automatically make the venue unfair or abusive. It reflects a market structure designed, in part, to handle large orders more efficiently.
However, the trade-off is reduced transparency for everyone watching from the outside.
Dark pools generally do not publish pre-trade orders in the same way as public exchanges.
You may see the visible bid, ask, and volume on your trading platform. But those figures may not represent every available source of liquidity.
That can create uncertainty around:
This does not mean every sudden move is caused by dark-pool activity. News, algorithms, market orders, earnings, macroeconomic data, and liquidity conditions can all move price.
It means your public chart may be incomplete if you ignore off-exchange activity entirely.
Price discovery is the process through which buyers and sellers establish the market price.
When trading is spread across multiple venues, no single order book shows the entire market. Off-exchange activity can make analysis more difficult, especially in volatile or thinly traded stocks.
For active traders, fragmentation may show up as:
This is a market-structure challenge. It is not proof that dark pools are specifically targeting retail traders.
Professional firms often have access to sophisticated routing systems, execution algorithms, data feeds, and research teams.
Retail traders generally do not have the same tools or direct access.
That information gap is real. But the answer is not to treat every large print as a secret prediction. The answer is to use clean, well-organized data as one part of a broader trading process.
Dark pool and block-trade data can help you identify areas that deserve further investigation.
For example, you may be able to examine:
This information can help you build a research question:
“Why did significant volume appear near this price, and how is the market responding?”
That is a useful question.
It is very different from saying:
“This print proves institutions are buying, so the stock must rise.”
A large print may represent many different circumstances. It could be part of a buy-side transaction, a sell-side transaction, a matched institutional transfer, a hedge, a portfolio rebalance, or another execution process.
The print alone does not establish intent.
This point is critical.
A large off-exchange print does not automatically tell you:
Use the data as context. Then confirm with the market itself.
Look at price structure, volume, trend, volatility, key levels, and follow-through.
Dark-pool analytics are not a crystal ball.
They generally cannot reveal with certainty:
This is why responsible traders avoid simplistic labels such as “smart money is buying” based on one isolated print.
A better interpretation is:
“A significant reported transaction occurred near this price. I will monitor how the market reacts.”
That language keeps the analysis grounded.
Before focusing on one stock, understand the market environment.
Is the S&P 500 trending? Are index futures volatile? Is the sector strong or weak? Are major economic releases scheduled?
A block-trade level can behave differently in a trending market than in a broad risk-off session.
A print near a major prior high, low, consolidation zone, or breakout point deserves more attention than a print in the middle of an empty chart.
Price location provides context.
The same reported transaction can have different significance depending on whether the stock is holding a level, rejecting it, or moving through it with volume.
One print is only one data point.
Look for repeated activity at similar prices or clusters of reported transactions over time. Then compare those areas with historical price reactions.
This does not prove that the level will hold again. It simply gives you more information than an isolated event.
Confirmation can include:
Do not enter solely because an alert appeared.
A data point is not a trade plan.
Before entering, determine:
The objective is not to predict every institutional transaction. The objective is to make decisions with better context.
Moby Tick Trading is built for traders who want to monitor institutional-scale activity without manually searching through thousands of symbols.
The platform tracks more than $200 billion in daily dark pool and block trades across 9,000+ U.S. stocks. Its tools help you move from broad market discovery to focused research.
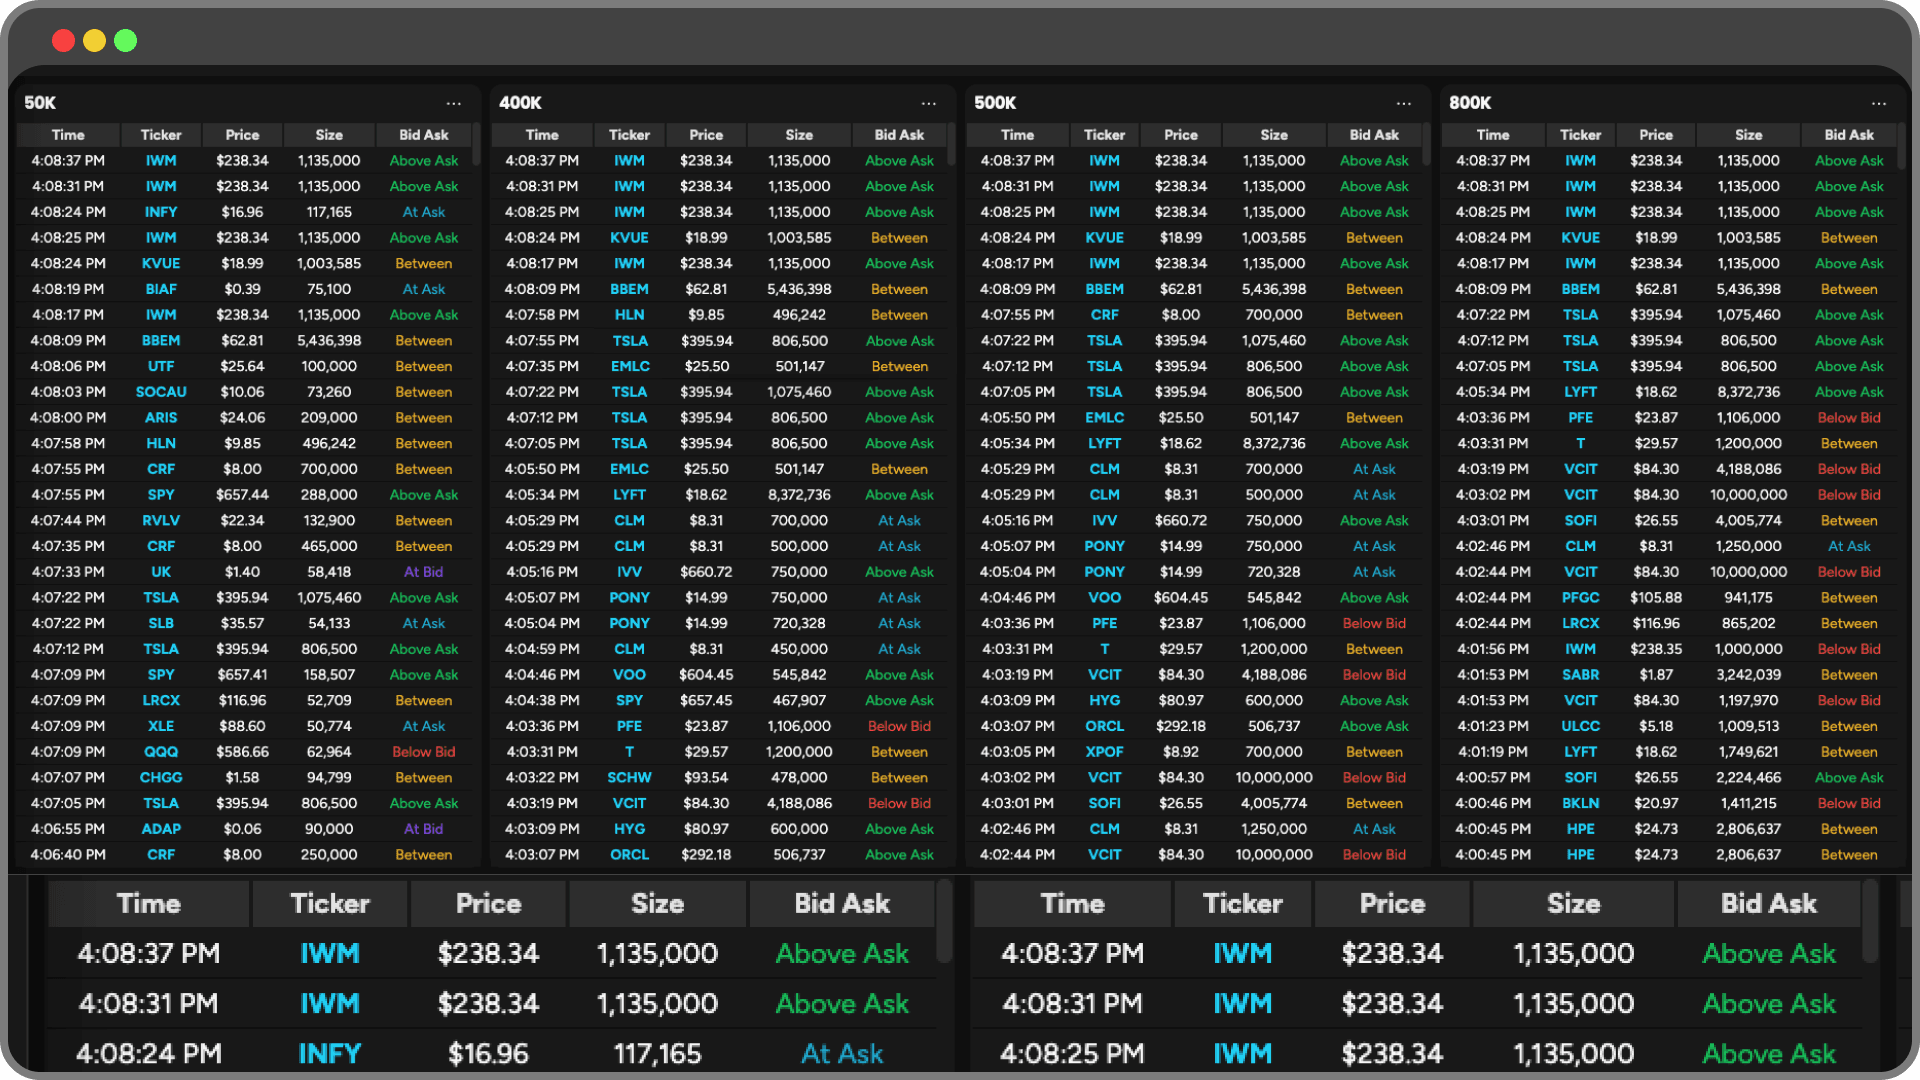
The Block Trade Indicator lets you customize filters by share size, price, ticker, and watchlist. You can monitor activity across the market or focus on symbols that fit your strategy.
The goal is not to turn every print into a trade. It is to help you identify where further analysis may be worthwhile.
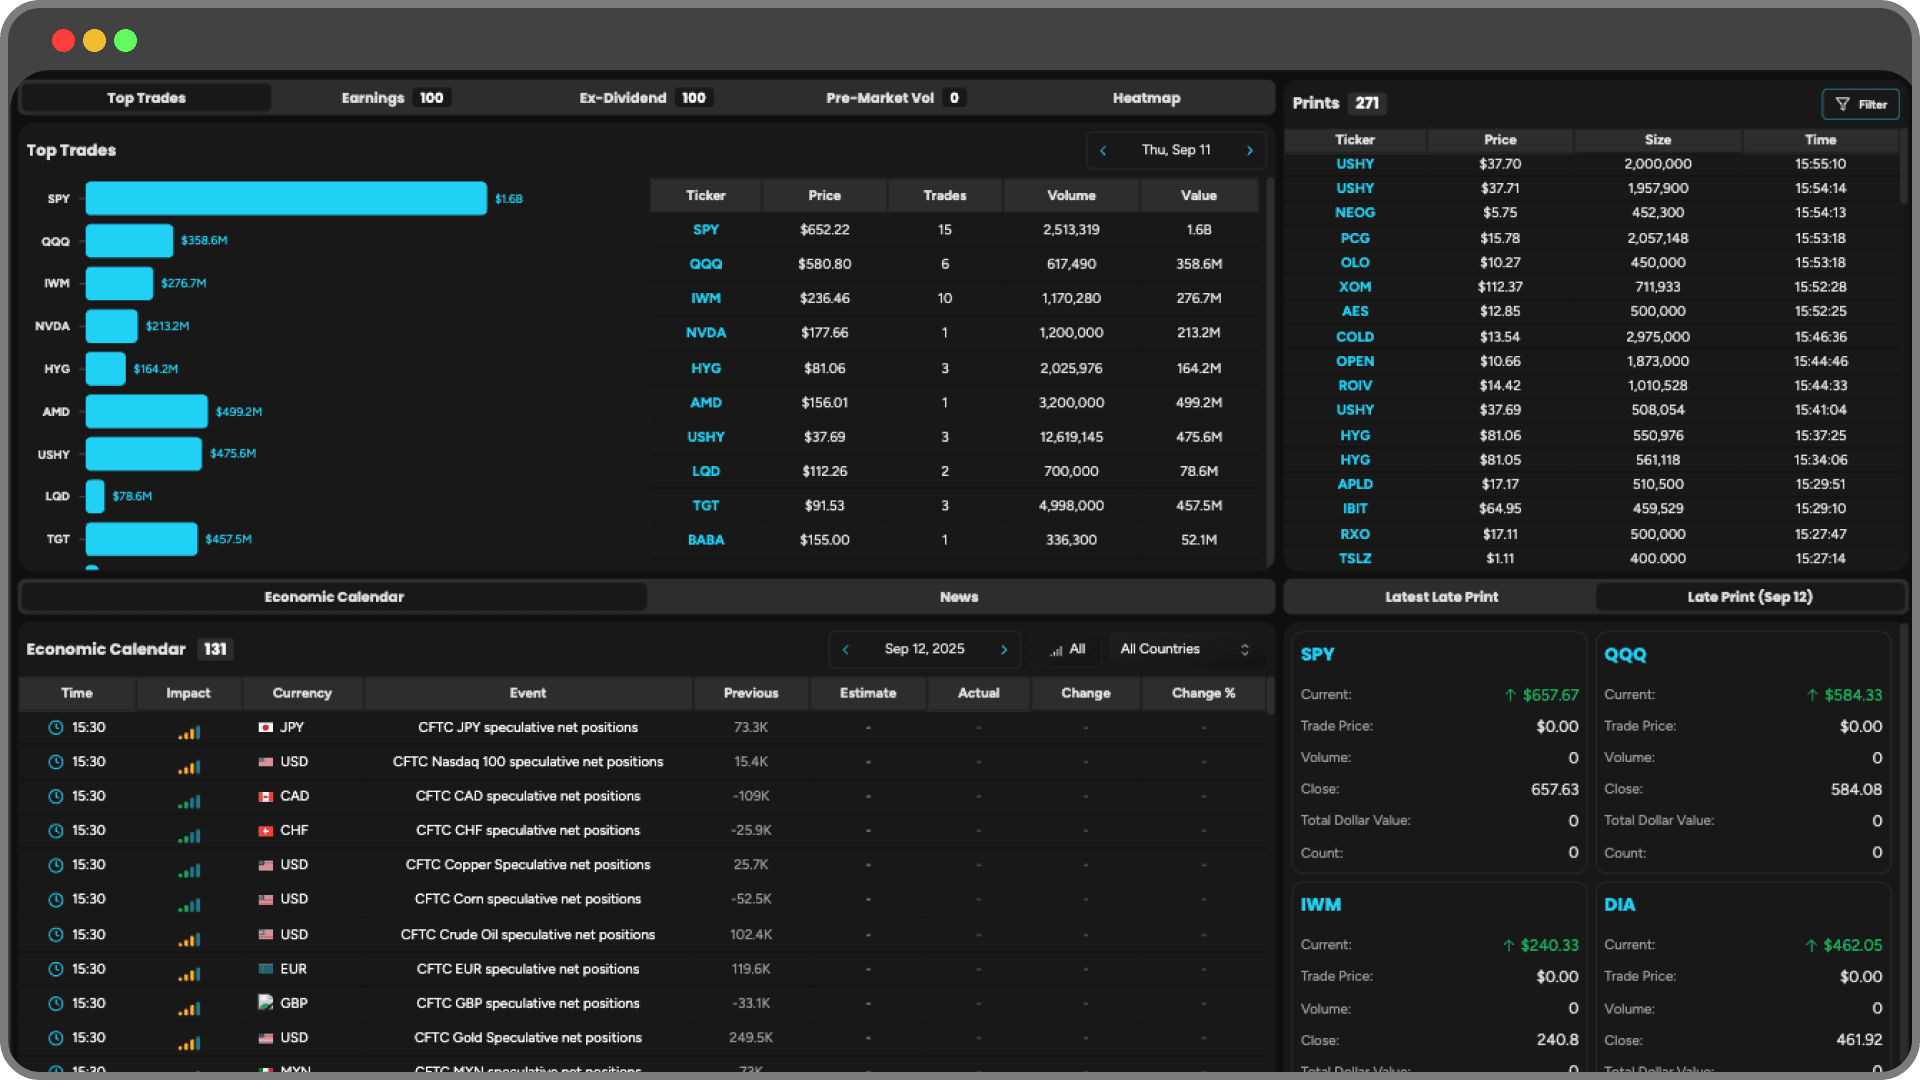
The Market Dashboard provides a broader view of the session, including market activity, volume leaders, movers, events, and reported prints.
You can then use historical research and chart context to investigate individual symbols.

With tools such as Print Lookup, chart overlays, customizable Watchlists, and alerts, you can organize the process around your own trading style.
That saves time. More importantly, it can reduce the temptation to react to disconnected alerts without context.
Dark pools are not automatically “bad” for retail traders.
They create legitimate concerns around transparency, fragmented liquidity, and unequal access to market infrastructure. At the same time, they serve an important function for large orders and operate within a regulated market structure.
Your edge comes from understanding the difference between:
Use dark-pool and block-trade data to ask better questions. Combine it with price action, volume, market structure, and disciplined risk management.
That is how you turn hidden activity into informed context: without confusing a large print for a promise.
This article is for educational purposes only and is not financial advice. Trading involves risk, and past market activity does not guarantee future results.