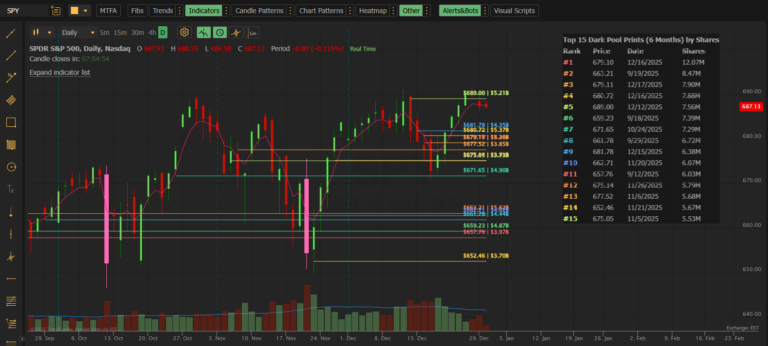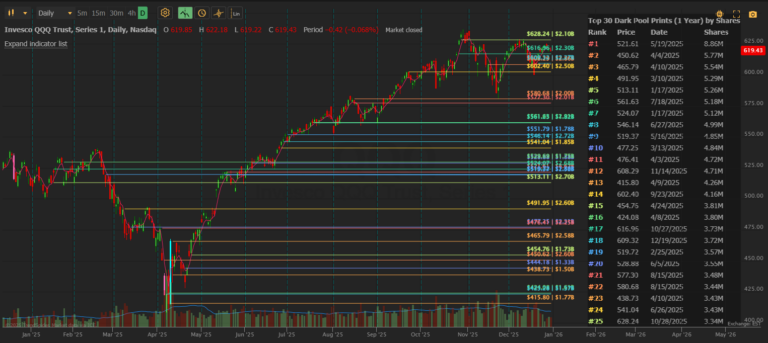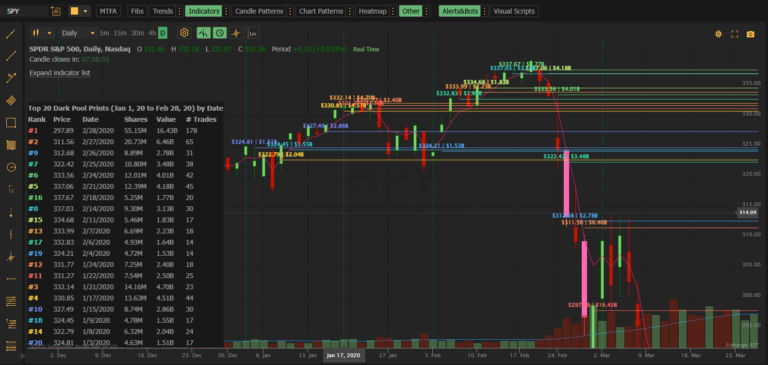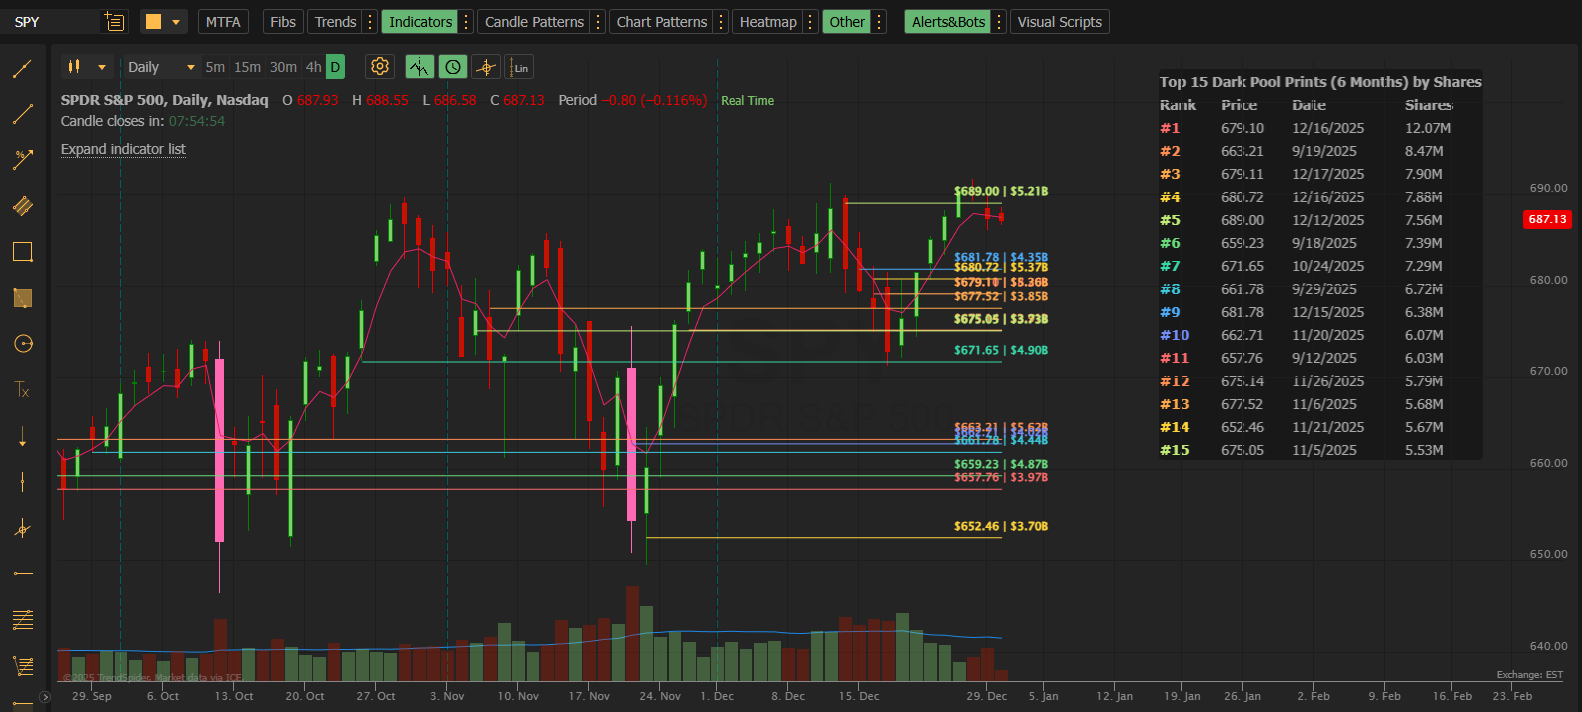
A detailed guide to every configuration option in the MobyTick Dark Pool Levels PRO indicator
Overview
Dark Pool Levels PRO is the advanced version of our institutional dark pool indicator for TrendSpider. PRO unlocks 60-second data refresh, 50 price levels, 5+ years of historical data, and custom date range analysis.
This reference guide explains every setting so you can maximize the power of PRO.
PRO vs. Standard: Key Differences
Before diving into settings, here’s what makes PRO different:
| Feature | Standard | PRO |
|---|---|---|
| Data Refresh | 5 minutes | 60 seconds |
| Max Levels | 30 | 50 |
| Lookback Period | 1 year | 5+ years (Jan 2020) |
| Custom End Date | ❌ | ✅ |
| Historical Analysis | ❌ | ✅ |
| Price | $39.95/mo | $59.95/mo |
Data Settings
These settings control the date range and filtering of dark pool data.
Start Date Range
Default: 30 Days
Controls how far back to begin searching for dark pool transactions.
| Option | Use Case |
|---|---|
| Today | Intraday only — fresh prints from today’s session |
| Week | Past 7 days of institutional activity |
| 30 Days | Standard swing trading lookback |
| 60 Days | Extended swing analysis |
| 90 Days | Quarterly patterns |
| 6 Months | Medium-term positioning |
| 1 Year | Long-term institutional zones |
| 2 Years | Extended historical analysis |
| 3 Years | Multi-year institutional patterns |
| 4 Years | Near-full historical coverage |
| 5 Years | Maximum lookback (Jan 2020) |
| All | All available data from Jan 1, 2020 |
| Custom | Specific start date using Custom Start field |
End Date Range
Default: Today
Controls where the date range ends. This is a PRO-exclusive feature that enables historical analysis.
| Option | Use Case |
|---|---|
| Today | Current data up to now (most common) |
| Week | End the range 1 week ago |
| 30 Days | End the range 30 days ago |
| 60 Days | End the range 60 days ago |
| 90 Days | End the range 90 days ago |
| 6 Months | End the range 6 months ago |
| 1 Year | End the range 1 year ago |
| 2 Years | End the range 2 years ago |
| 3 Years | End the range 3 years ago |
| 4 Years | End the range 4 years ago |
| 5 Years | End the range 5 years ago |
| All | Same as Today — up to current |
| Custom | Specific end date using Custom End field |
Why Custom End Dates Matter:
| Scenario | Start Date | End Date |
|---|---|---|
| Analyze Q4 2024 only | Oct 1, 2024 | Dec 31, 2024 |
| Study pre-earnings period | 30 days before earnings | Earnings date |
| Research a specific correction | Top of range | Bottom of range |
| COVID crash analysis | Mar 1, 2020 | Mar 23, 2020 |
| Compare two time periods | Run separate analyses | Different end dates |
Custom Start (YYYYMMDD)
Default: Rolling based on Start Date Range
When Start Date Range is set to “Custom,” enter your desired start date.
Format: YYYYMMDD (e.g., 20200315 = March 15, 2020)
Range: January 1, 2020 to today
Custom End (YYYYMMDD)
Default: Today’s date
When End Date Range is set to “Custom,” enter your desired end date.
Format: YYYYMMDD (e.g., 20240630 = June 30, 2024)
Range: January 1, 2020 to today
Note: If Custom End is set to a date before Custom Start, the indicator will automatically correct to today’s date.
Number of Prints
Default: 30
Range: 1–50 (PRO exclusive: 31–50)
How many price levels to display on the chart. PRO extends the maximum from 30 to 50.
| Setting | Use Case |
|---|---|
| 10–20 | Clean chart, major levels only |
| 25–35 | Balanced view |
| 40–50 | Maximum detail for high-volume stocks |
When to use 40–50 levels:
- Analyzing SPY, QQQ, AAPL, TSLA, or other high-volume stocks
- Looking at extended time periods (90+ days)
- Identifying multiple institutional clusters across a wide price range
- Research and historical analysis
Minimum Share Size
Default: 50,000
Range: 50,000–100,000,000
Filters out smaller transactions. Only prints with share volume ≥ this value will appear.
| Setting | Use Case |
|---|---|
| 50,000 | See more activity (lower-volume stocks) |
| 100,000 | Standard filter |
| 500,000 | Large institutional trades only |
| 1,000,000+ | Major block trades (high-volume stocks) |
Guidance by Stock Type:
- Mega-cap (SPY, QQQ, AAPL, MSFT): 500K–1M+ minimum
- Large-cap: 200K–500K minimum
- Mid-cap: 100K–200K minimum
- Small-cap: 50K–100K minimum
Table Settings
Control the on-chart data table that displays dark pool transaction details.
◆ Show Table
Default: On (checked)
Toggle the table visibility. When enabled, a table appears on your chart showing details for each displayed level.
↳ Table Sort By
Default: Shares (Largest)
Determines the order of rows in the table AND the ranking of lines on the chart.
| Option | Sorts By | Best For |
|---|---|---|
| Shares (Largest) | Total share volume (highest first) | Finding highest-conviction levels |
| Price (Highest) | Price level (highest first) | Viewing levels from resistance down |
| Date (Newest) | Most recent transaction first | Spotting fresh institutional activity |
↳ Table Columns
Default: Standard (Rank, Price, Date, Shares)
Choose which columns appear in the table.
| Preset | Columns Displayed |
|---|---|
| Standard (Rank, Price, Date, Shares) | Rank, Price, Date, Shares |
| Minimal (Rank, Price) | Rank, Price |
| Compact (Rank, Price, Shares) | Rank, Price, Shares |
| Date Focus (Rank, Price, Date) | Rank, Price, Date |
| Value Focus (Rank, Price, Value) | Rank, Price, $ Value |
| Standard + Value | Rank, Price, Date, Shares, Value |
| No Value | Rank, Price, Date, Shares, # Trades |
| Full (All Columns) | All available columns |
| No Rank | Price, Date, Shares, Value, # Trades |
Table Properties (EDIT button)
Opens TrendSpider’s standard table editor where you can adjust:
- Position: Top Left, Top Right, Bottom Left, Bottom Right
- Font size
- Background opacity
- Border styling
Label Settings
Control the text labels that appear on each horizontal price line.
◆ Show Labels
Default: On (checked)
Toggle label visibility on the price level lines.
↳ Label Position
Default: Left
Where labels appear on each horizontal line.
| Option | Description |
|---|---|
| Left | Labels at the left edge of the line |
| Right | Labels at the right edge of the line |
Tip: Use “Left” if your chart has price action on the right side; use “Right” if you want labels near current price.
↳ Label Format
Default: Price + Size
What information to display in each label.
| Format | Example Output |
|---|---|
| Price Only | $685.50 |
| Size Only | 2.5M |
| Date Only | 12/15/2025 |
| Value Only | $1.7B |
| Price + Size | $685.50 | 2.5M |
| Price + Date | $685.50 | 12/15 |
| Price + Value | $685.50 | $1.7B |
| Size + Date | 2.5M | 12/15 |
| Size + Value | 2.5M | $1.7B |
| Date + Value | 12/15 | $1.7B |
| Price + Size + Date | $685.50 | 2.5M | 12/15 |
| Price + Size + Value | $685.50 | 2.5M | $1.7B |
| Price + Date + Value | $685.50 | 12/15 | $1.7B |
| Size + Date + Value | 2.5M | 12/15 | $1.7B |
| All Details | $685.50 | 2.5M | 12/15 | $1.7B |
Line Colors (DP Line 1–50)
Each of the 50 possible price levels has its own color swatch. PRO extends this from 30 to 50 lines.
Default: Gradient color scheme (varies by rank)
Looking at the screenshot, PRO uses a rainbow gradient by default:
- Lines 1–8: Warm tones (orange, yellow)
- Lines 9–15: Cool tones (cyan, blue)
- Lines 16–22: Purple tones
- Lines 23–29: Green tones
- Lines 30–36: Mixed tones
- Lines 37–43: Blue-purple range
- Lines 44–50: Cyan-green range
Click any color swatch to open the color picker and customize that specific line.
Color Strategy Tips:
- Gradient approach: Visual distinction between largest (#1) and smallest (#50) prints
- Uniform color: All levels same color for cleaner appearance
- Threshold coloring: Make lines 1–10 red (major levels), 11–30 yellow (medium), 31–50 green (minor)
PRO-Specific Use Cases
Historical Research: COVID Crash
Analyze where institutions bought the March 2020 bottom:
| Setting | Value |
|---|---|
| Start Date Range | Custom |
| Custom Start | 20200301 |
| End Date Range | Custom |
| Custom End | 20200323 |
| Number of Prints | 50 |
| Minimum Share Size | 500,000 |
Historical Research: 2022 Bear Market
Study institutional distribution during the 2022 decline:
| Setting | Value |
|---|---|
| Start Date Range | Custom |
| Custom Start | 20220101 |
| End Date Range | Custom |
| Custom End | 20221015 |
| Number of Prints | 50 |
| Minimum Share Size | 1,000,000 |
Real-Time Day Trading
Catch institutional flow as it happens:
| Setting | Value |
|---|---|
| Start Date Range | Today |
| End Date Range | Today |
| Number of Prints | 30 |
| Minimum Share Size | 100,000 |
| Table Sort By | Date (Newest) |
Pre-Earnings Analysis
See institutional positioning 30 days before an earnings report:
| Setting | Value |
|---|---|
| Start Date Range | 30 Days |
| End Date Range | Custom |
| Custom End | Day before earnings (YYYYMMDD) |
| Number of Prints | 40 |
| Minimum Share Size | 200,000 |
Comparing Two Periods
Period 1 (Before Fed Meeting):
- Custom Start: 2 weeks before FOMC
- Custom End: Day before FOMC
Period 2 (After Fed Meeting):
- Custom Start: FOMC day
- Custom End: 2 weeks after FOMC
Compare the prints to see how institutional behavior changed around the event.
Recommended Configurations by Trading Style
Day Trading (PRO Optimized)
| Setting | Value |
|---|---|
| Start Date Range | Today |
| End Date Range | Today |
| Number of Prints | 25–35 |
| Minimum Share Size | 100,000+ |
| Table Sort By | Date (Newest) |
| Label Format | Price + Size |
Swing Trading (PRO Optimized)
| Setting | Value |
|---|---|
| Start Date Range | 60 Days |
| End Date Range | Today |
| Number of Prints | 40–50 |
| Minimum Share Size | 100,000–200,000 |
| Table Sort By | Shares (Largest) |
| Label Format | Price + Size + Date |
Position Trading / Investing
| Setting | Value |
|---|---|
| Start Date Range | 1 Year or longer |
| End Date Range | Today |
| Number of Prints | 50 |
| Minimum Share Size | 500,000+ |
| Table Sort By | Shares (Largest) |
| Label Format | All Details |
Historical Research
| Setting | Value |
|---|---|
| Start Date Range | Custom |
| End Date Range | Custom |
| Number of Prints | 50 |
| Minimum Share Size | Varies |
| Table Columns | Full (All Columns) |
| Label Format | All Details |
Pro Tips for PRO Users
- Layer current + historical: Add the indicator twice — once for “Today” (fresh prints) and once for “90 Days” (established levels) — to see both on the same chart with different colors.
- Use custom end dates for backtesting: Set an end date in the past to see what the indicator would have shown you at that point in time. This helps validate your strategy.
- Research before earnings: Set Custom End to the day before earnings to see institutional positioning without post-earnings noise.
- Compare time periods: Run the same analysis with different date ranges to see how institutional behavior evolved.
- Maximize levels for high-volume stocks: SPY, QQQ, and mega-caps benefit from 40–50 levels. Smaller stocks often only need 20–30.
- Sort by Date for real-time trading: When day trading, switch Table Sort By to “Date (Newest)” to see fresh prints at the top.
Related Documentation
- Dark Pool Levels — Main Product Page
- Dark Pool Levels — Quick Start Guide
- Dark Pool Levels — Standard Settings Reference
- Dark Pool Levels — FAQ & Troubleshooting
Dark Pool Levels PRO by MobyTick Trading — 50 levels. 6 years of history. The complete institutional edge.