Physical Address
304 North Cardinal St.
Dorchester Center, MA 02124
Physical Address
304 North Cardinal St.
Dorchester Center, MA 02124

Standard stop losses fail during crashes — they're based on percentages and chart patterns from a different market regime. Dark pool data shows you where institutional money has committed real capital, giving you data-driven stop levels based on $2.5 billion in real trades, not guesswork.
Reading Time: 8 Minutes
Most traders set stop losses the same way: a percentage below their entry, a technical level on a chart, or the old standby — “I’ll know when it’s time to get out.”
In a normal market, these approaches work well enough. But when volatility spikes — like we’re seeing right now with the Iran conflict rattling global markets — standard stop losses become a liability. They either trigger too early (shaking you out before a bounce) or sit too far away (letting a manageable loss turn into a catastrophe).
The problem isn’t the stop loss itself. The problem is what it’s based on.
A moving average doesn’t know that $500 million in institutional money just showed up at a specific price level. A 5% trailing stop doesn’t know whether the stock is falling into a zone of heavy institutional activity or dropping through empty space with no floor in sight.
Dark pool data gives you something technical indicators can’t: a map of where the biggest players in the market have committed real capital. And during a crash, that map becomes your most valuable risk management tool.
During normal conditions, support and resistance levels based on price history work reasonably well. But crashes aren’t normal conditions. Here’s what changes:
Volatility expands. A stock that normally moves 1-2% per day might swing 5-8% in a crash. A stop set at -3% (perfectly reasonable in calm markets) gets triggered by intraday noise, not by a genuine breakdown.
Technical levels get overrun. Moving averages, trendlines, and previous support levels were set during a different regime. In a geopolitical crisis, the market reprices entire sectors in hours. Last week’s support is this week’s speed bump.
Volume spikes create false signals. Panic selling generates massive volume at every level, making traditional volume-based support analysis unreliable. You can’t distinguish institutional activity from retail panic on a standard chart.
This is where dark pool data changes the equation. Institutional block trades — the kind that move $100 million or more in a single transaction — don’t happen in a panic. They’re planned, calculated, and executed at specific price levels for specific reasons. When a pension fund executes a $340 million dark pool trade at $283, they’ve done the analysis. That level means something to them.
Instead of setting stops based on percentages or chart patterns alone, dark pool data lets you anchor your risk management to institutional price levels. Here’s the framework:
Look for clusters of dark pool prints within a tight price range over the past 30 days. Single prints can be noise. Multiple prints at similar levels — especially from different days — indicate a zone that matters to institutional money.
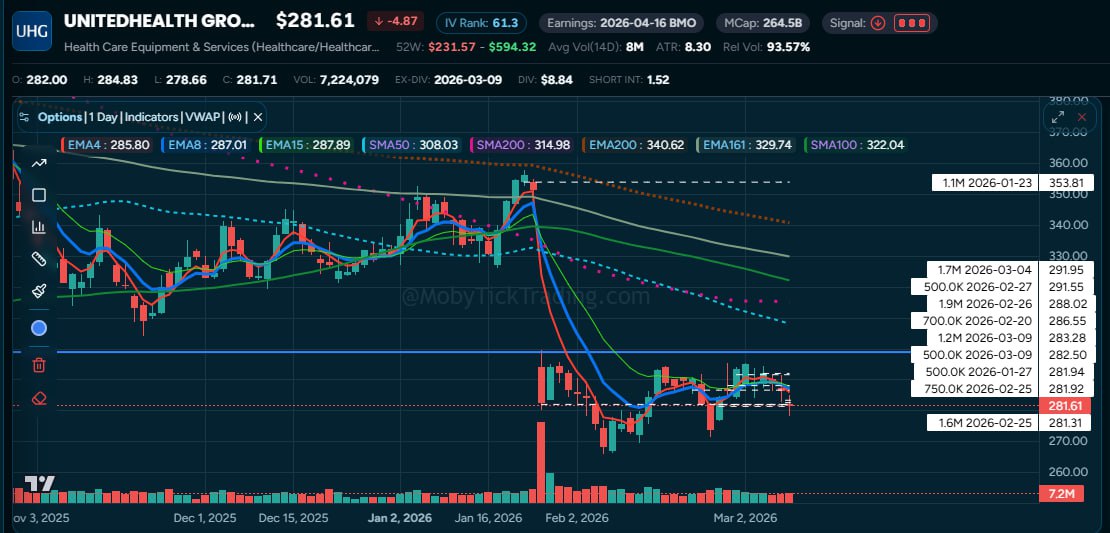
Today alone, UNH has nearly $600 million in dark pool prints. But zoom out 30 days and the picture gets even clearer:
| Date | Shares | Price | Value |
|---|---|---|---|
| Feb 20 | 700K | $286.55 | $201M |
| Feb 25 | 1.65M | $281.31 | $463M |
| Feb 25 | 750K | $281.92 | $211M |
| Feb 26 | 1.91M | $288.02 | $550M |
| Feb 27 | 500K | $291.55 | $146M |
| Mar 4 | 1.70M | $291.95 | $496M |
| Mar 9 | 500K | $282.50 | $141M |
| Mar 9 | 1.20M | $283.28 | $340M |
The institutional zone: $281–$292. Over $2.5 billion in prints within an $11 range over 30 days. That’s not random. That’s a level where serious capital has been repeatedly deployed.
If you own UNH and you’re trying to manage risk during this crash, a standard approach might place a stop at -5% from today’s price. At $283, that’s about $269.
But the dark pool data tells you something specific: the bottom of the institutional zone is around $281. Prints at $281.31 and $281.92 from February 25 mark the lowest significant institutional activity.
A dark pool-informed stop might sit at $279 or $280 — just below the institutional floor. Here’s why:
The difference is significant. A percentage-based stop at $269 might survive a crash that a dark pool stop at $279 wouldn’t — but it also risks a much larger loss if the stock truly breaks down. The dark pool stop gives you a reason for the level, not just a number.
Not all dark pool zones are equal. The density of prints matters for how much room your stop needs.
Dense zone = tighter stop. UNH has $2.5 billion in prints across $281–$292. That’s an extremely dense cluster. If price breaks below $281, it’s breaking through serious institutional commitment. A stop just below the zone is well-justified.
Sparse zone = wider stop. Compare that to a stock with one or two prints at a level. A single $50 million print at $40 might be meaningful, but it’s not the same conviction signal as five prints totaling $500 million at $40. Give sparse zones more breathing room.
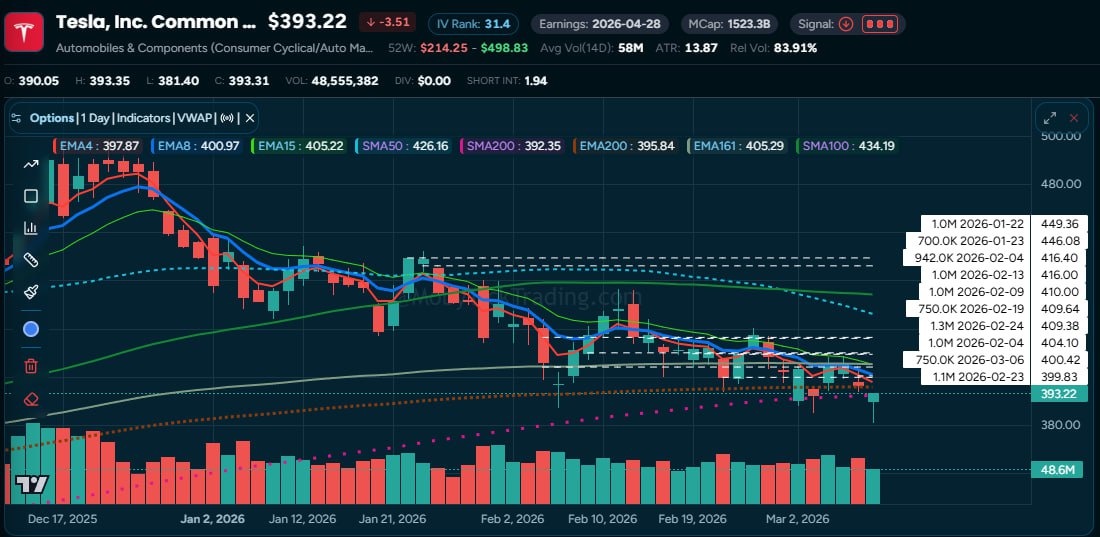
Tesla is down -1.6% today at $393, with $245 million in dark pool prints. Let’s map the full 30-day institutional landscape:
Upper Zone ($409–$449):
Lower Zone ($399–$404):
Today ($385–$390):
Here’s what a trader using dark pool data for risk management sees:
The major institutional zone is $399–$449, with billions of dollars committed. Today’s prints at $385–$390 are below that zone. If you entered TSLA based on the $399–$400 level and set a stop below it at, say, $395, you’d already be stopped out — and the dark pool data would have told you that was the right decision. The stock broke below the institutional floor.
On the other hand, if you’re looking at TSLA now, today’s $385–$390 prints represent a new potential level being established. But it’s thin — only $245 million versus the billions at $400+. A stop at these levels needs to be wider because the zone hasn’t been tested or reinforced yet.
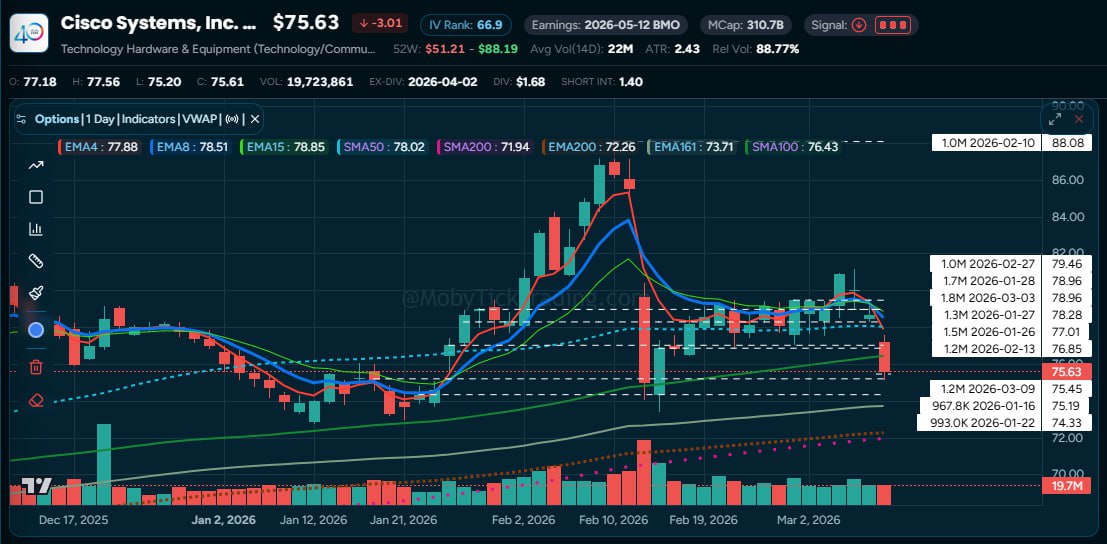
Cisco is down -3% today at $75.63. Looks ugly on a chart. But the dark pool data shows a remarkably consistent institutional zone:
| Date | Shares | Price | Value |
|---|---|---|---|
| Feb 10 | 1.00M | $88.08 | $88M |
| Feb 13 | 1.20M | $76.85 | $92M |
| Jan 28 | 1.70M | $78.96 | $134M |
| Feb 27 | 1.00M | $79.46 | $80M |
| Mar 3 | 1.84M | $78.96 | $145M |
| Mar 9 | 1.25M | $75.45 | $94M |
The prints paint a clear picture. The Feb 10 print at $88.08 is an outlier at the top. Everything else clusters in two zones:
Today’s print at $75.45 sits right at the bottom edge of the institutional range. If you’re long CSCO, a dark pool-informed stop sits below this level — maybe $74.50 or $75. If $75 breaks with no new prints showing up to defend it, the institutional floor has failed and you want out.
But as long as institutions keep printing in the mid-$75 range (which they are, today), the zone is holding.
Before setting any stop during high-volatility conditions:
1. Pull 30-day dark pool data for your position. Look at the Moby Tick Block Trade Indicator for prints above 50,000 shares. Smaller prints are noise during a crash.
2. Map the zones. Group prints by price (within 2-3% bands). Add up the total dollar volume at each level. The zone with the most capital committed is your primary institutional level.
3. Identify the floor. What’s the lowest price with significant, repeated institutional activity? That’s your anchor. One print isn’t enough — look for multiple prints or a print that’s been “tested” (price returned to the level and more prints appeared).
4. Set your stop below the floor, not inside the zone. The whole point is to stay in the trade while institutions are active at your level, and exit when that level breaks. Stops inside the zone will get triggered by normal volatility.
5. Reassess daily. During a crash, new prints appear constantly. Today’s data might establish new levels that didn’t exist yesterday. CMCSA went from zero significant prints at $30.50 to $275 million in a single morning. The landscape changes fast.
Let’s be clear about the limitations:
They won’t catch the exact bottom. No stop loss method does. Dark pool levels are zones, not magic numbers.
They don’t tell you direction. A cluster of institutional prints at $280 tells you that level matters. It doesn’t tell you whether the stock bounces from there or consolidates before falling further. Your stop is a risk management tool, not a prediction.
They require data access. You can’t do this with a basic brokerage chart. You need dark pool print data with price, size, and date information — which is exactly what Moby Tick provides.
They work best on liquid stocks. Mega-cap and large-cap stocks with heavy institutional ownership generate enough dark pool prints to form reliable zones. Micro-cap stocks with one print every few weeks don’t give you enough data to work with.
In a crash, everyone’s looking for the floor. Most traders guess. Some use technical levels that were drawn in a different market regime. A few use dark pool data to see where institutional money — the money that actually moves markets — has been committed.
Setting stops based on institutional zones doesn’t guarantee profits. But it gives your risk management something most traders’ stops don’t have: a reason based on real capital deployment, not just lines on a chart.
On a day like today, with billions of dollars printing across every major name, that data has never been more valuable.
Moby Tick Trading tracks institutional dark pool activity across 10,000+ stocks with over 5 years of historical data. Use the Block Trade Indicator to map institutional zones and manage your risk with data the crowd can’t see.
Start with our free Weekly Dark Pool Report to see institutional levels on the week’s biggest movers, or explore our plans for real-time access.