Physical Address
304 North Cardinal St.
Dorchester Center, MA 02124
Physical Address
304 North Cardinal St.
Dorchester Center, MA 02124

“Follow the money.” You hear it everywhere — from trading YouTube channels to Wall Street documentaries. But what does it actually mean? And more importantly, how do you do it?
Most retail traders interpret “follow the money” as watching volume bars or checking what hedge funds reported in their 13F filings three months ago. That’s not following the money — that’s reading yesterday’s newspaper.
Real money leaves a trail. Every day, billions of dollars flow through dark pools — private exchanges where institutions trade massive blocks of shares away from public markets. These trades are reported after execution, and that data is available to anyone who knows where to look.
At MobyTick Trading, we’ve tracked over 10,000 stocks across 5+ years of dark pool data. This article will show you exactly what “following the money” looks like in practice — with real data, real examples, and real results.
When we say “the money,” we’re talking about institutional capital — hedge funds, pension funds, sovereign wealth funds, and market makers. These are entities managing billions of dollars. When they want to buy or sell a significant position, they can’t just hit “buy” on a trading app. A single order for 2 million shares of a $50 stock is a $100 million trade. Placing that on a public exchange would move the price against them before they could fill it.
That’s where dark pools come in.
Dark pools are private trading venues operated by major financial institutions. They exist for one reason: to let large traders execute massive orders without immediately impacting the public market price.
Here’s what makes dark pool data powerful: while the trades happen privately, they must be reported to the consolidated tape after execution. This means we can see:
We can’t see who made the trade or whether they were buying or selling directly. But the price level, size, and timing tell us a remarkable amount about institutional intent — if you know how to read it.
A “print” is our term for a dark pool trade that meets a minimum size threshold. At MobyTick, we track prints of 50,000+ shares. Here’s the framework for reading them:
The most important question isn’t “how big was the trade?” — it’s “where did the trade happen relative to the stock’s price action?”
Prints at LOCAL LOWS: When large trades execute near the bottom of a price range, institutions are likely building a position. They need shares at favorable prices. This is often the beginning of a move higher.
Prints at LOCAL HIGHS: When large trades execute after a significant run-up, institutions are likely taking profits. They’ve ridden the move and are now distributing their position into retail demand.
Prints at KEY LEVELS: When dark pool activity clusters around specific price levels, those levels become significant support or resistance. Institutions have skin in the game at those prices.
Here’s something most retail traders don’t understand: after a large institutional print, price often moves in the OPPOSITE direction first.
Think about it from the institution’s perspective. If they’re accumulating a massive position at $50, they don’t want price to immediately go to $55 — they want to buy MORE at $50 or lower. So after their initial block trade, price often pulls back. This accomplishes two things:
The reverse is equally true for institutional selling. When they’re distributing a position at $100, price often pushes HIGHER first. Why? Because they need buyers. A rising price attracts bullish retail traders who happily buy at $102, $104, $106 — absorbing the institutional sell orders. Then price rolls over.
This is why price can be considered a lagging indicator. The decision was already made in the dark pool. The price movement you see on the chart is often the result of institutional positioning that happened days or weeks earlier.
Not every dark pool print is a massive block trade. Institutions also use smaller trades strategically to nudge price in their desired direction. These “positioning trades” are used to:
The large prints set the boundaries. The smaller prints guide price between them. When you see a cluster of medium-sized prints pushing price toward a level where a massive block trade previously executed, that’s institutions engineering their entry or exit.
Large institutions often have access to information — upcoming earnings surprises, merger talks, regulatory decisions, macro shifts — before it becomes public knowledge. This isn’t necessarily insider trading in the legal sense. It’s the result of having teams of analysts, relationships with company management, and the resources to process information faster than anyone else.
Dark pool prints frequently appear before major news events. An unusual cluster of large prints in an otherwise quiet stock, days before a surprise announcement, is a pattern we see repeatedly. By the time the news hits CNBC, the institutional positioning is already done.
This is one of the most powerful reasons to track dark pool data. You’re not predicting the news — you’re seeing the fingerprints of people who already know what’s coming.
Institutions don’t build positions in a day. They plan months ahead. Here’s how to read their timeline using dark pool prints:
1. 12-6 months out: The LARGEST prints define the boundaries — where institutions see the floor and ceiling. These are your long-term support and resistance levels.
2. 90-60 days out: Medium-sized prints start to show DIRECTION. Institutions are nudging price toward their target. Look for which side of the range is getting more activity.
3. 30 days to now: This is POSITIONING. Are they loading up (adding shares) or distributing (selling into strength)? The density and price level of recent prints tell the story.
The pattern: Big prints set boundaries → Medium prints show direction → Recent prints show positioning → A catalyst (earnings, news) moves price toward the institutional target.
Here’s a concept that changes how you look at the market: institutions manage billions. At that scale, they don’t react to the market — they often ARE the market. They have the capital to influence price direction, access to information and research that retail traders don’t have, and the patience to let their thesis play out over weeks or months.
When you see a massive dark pool print, the question isn’t “is this a good or bad trade?” — the question is “what are they doing, and can I position alongside them?”
Understanding these patterns — the counter-moves, the nudge trades, the information advantage — doesn’t guarantee you’ll win every trade. But it dramatically increases your chances of being on the right side of a move. You’re not guessing. You’re reading the footprints of the biggest, most informed players in the market.
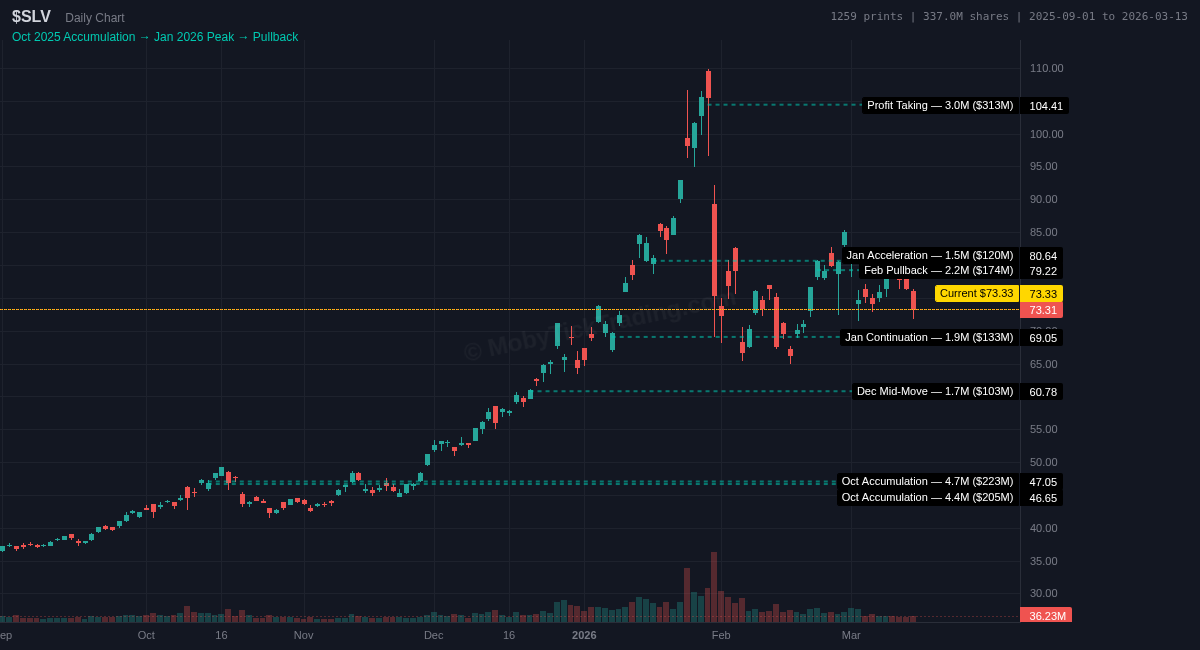
SLV 6-month: Oct accumulation at $46-47 → pullback to shake out retail → Jan run to $104 → profit-taking at the top
The Data (September 2025 – March 2026):
The Story:
In October 2025, massive prints began appearing for SLV between $43-$47. In a single week (Oct 13-17), we saw five prints over $140 million each — totaling nearly $1 billion in dark pool volume at the $43-$47 range.
This was classic accumulation at the lows. Price was trading near multi-month lows, and institutions were loading heavily.
After the October accumulation, SLV actually pulled back briefly — exactly what you’d expect. Institutions wanted MORE shares at better prices. Retail traders saw the dip and sold. Institutions absorbed those shares.
Then SLV ran from $47 to over $100 by late January 2026 — a 110%+ move.
On January 29, 2026, a single 3,000,000-share print hit at $104.41 — worth $313 million. At the highs. After a massive run. That’s profit-taking. The same institutions that accumulated at $47 were now selling into the euphoria — to retail traders buying the breakout.
The best single print we tracked: January 9 @ $71.54, and within ten trading days SLV was at $98.34 — a 37% move. That print was a mid-move continuation signal that the institutional thesis was still intact.
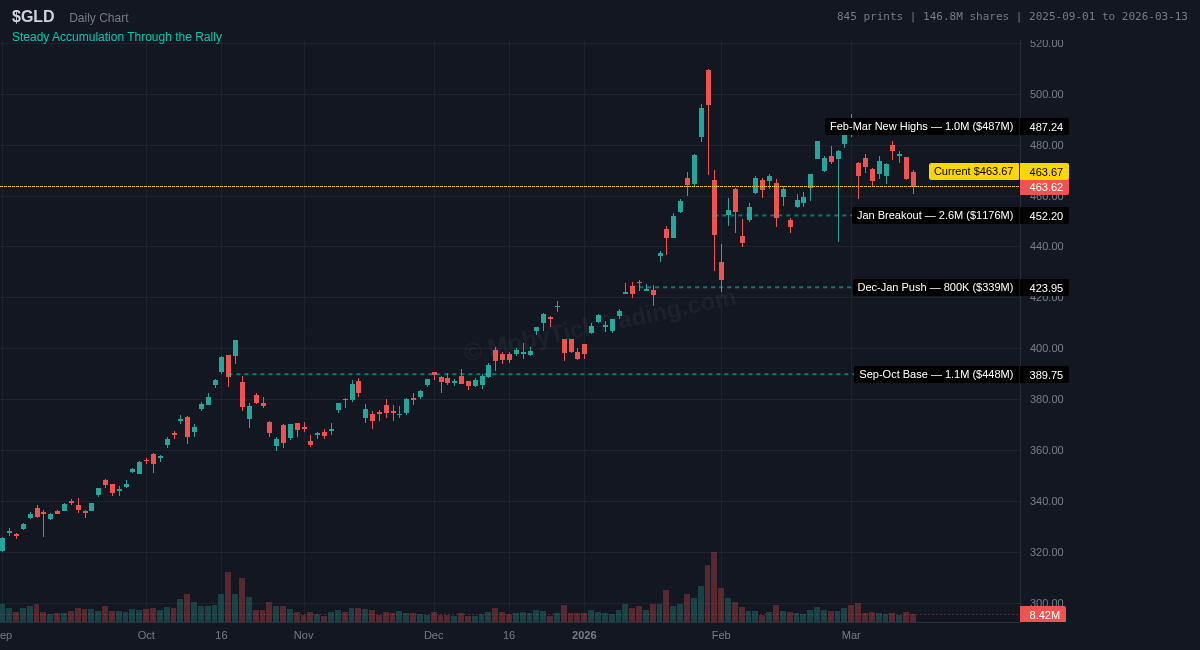
GLD 6-month: Institutions bought every dip — prints at lows consistently preceded higher prices
The Data (November 2025 – March 2026):
Key Insight:
Institutions were consistently more active when gold dipped — prints at the day’s lower half significantly outperformed prints at the highs. This is the accumulation pattern in action: every pullback was met with institutional buying, and those temporary dips were used to pick up shares from retail traders who panicked on the red candles.
Example: January 21, a large print at $441.00 during a pullback. Five days later, GLD was at $494.56 — a 12% move. The institution bought the dip while retail sold it.
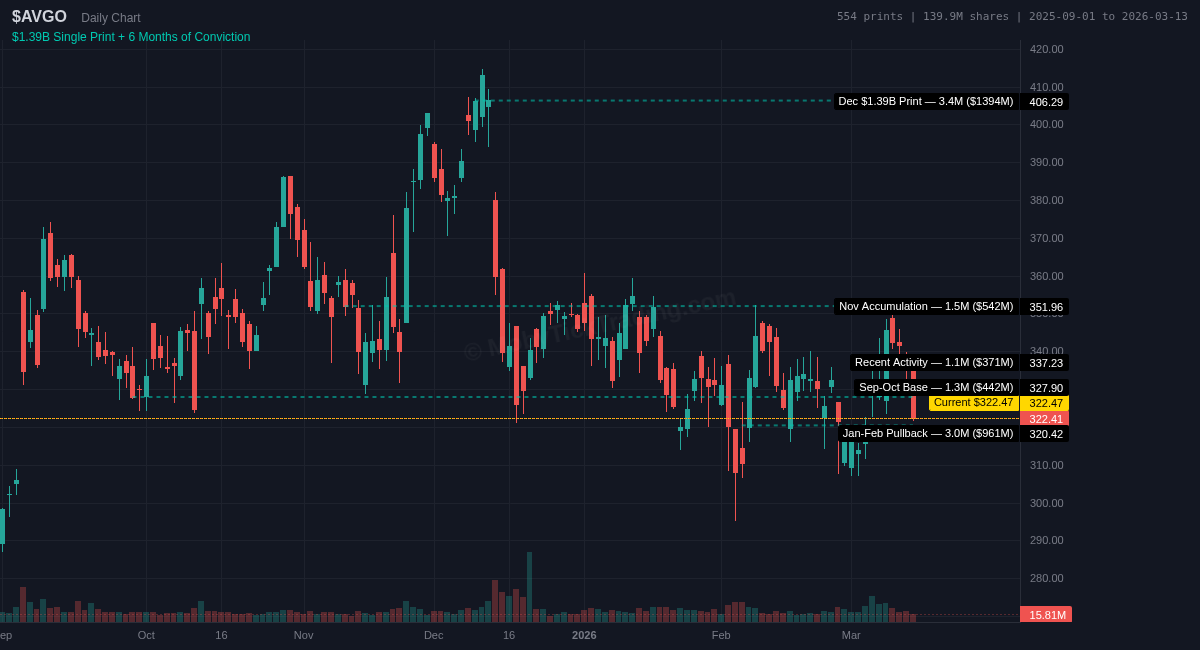
AVGO 6-month: $1.39B Dec print at $406 → pullback → $961M add at $320 (buying the dip)
The Data (September 2025 – March 2026):
What stood out about AVGO was the sheer scale. On December 9, 2025, a single dark pool print of 3,430,534 shares executed at $406.29 — a $1.39 BILLION trade. That’s not a retail trader.
After that massive December print at $406, price pulled back to $320 by early February. A retail trader might panic — “someone dumped $1.4 billion worth!” But on February 5, another 3,000,000-share print appeared at $320.42 — $961 million. The institution was using the pullback to add to their position at a better price. Smaller prints throughout January and February nudged price around while the institution built their full position.
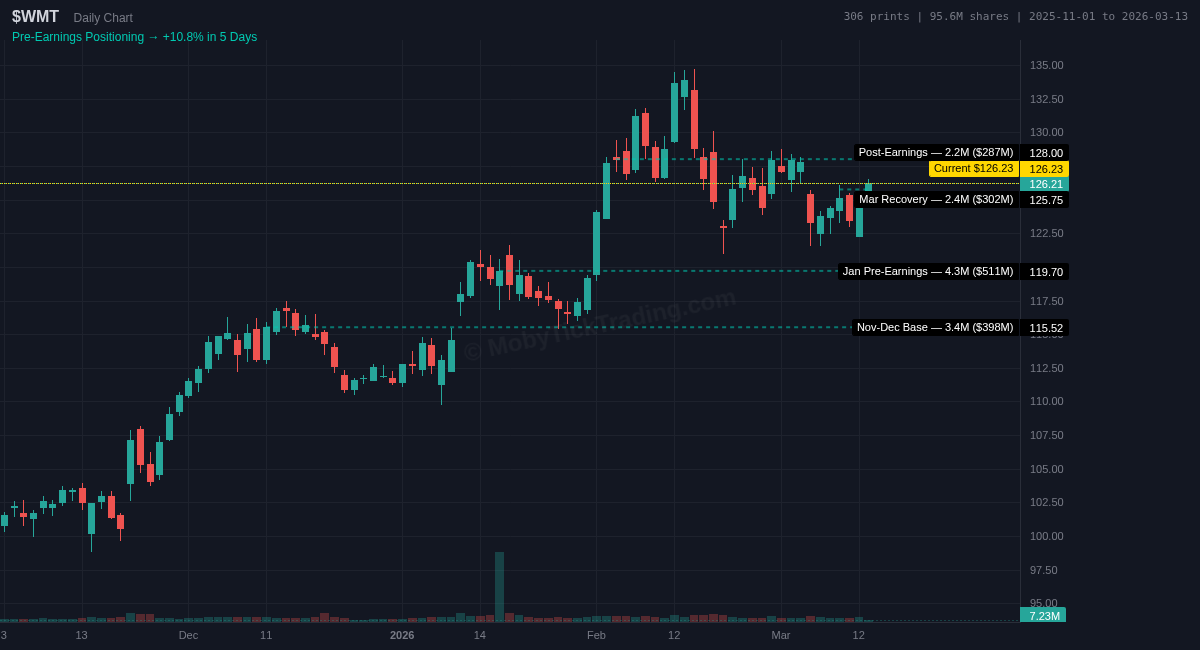
WMT 4-month: $511M pre-earnings print at $119.70 → +10.8% on earnings
The Data (November 2025 – March 2026):
The Standout Print:
January 30 — a 4,300,000-share print at $119.70, worth $511 million. This was days before Walmart’s earnings report. By February 6, WMT was at $131.18 — a 10.8% move.
Was it a coincidence that institutions positioned heavily right before a strong earnings report? When you manage billions, you have teams of analysts modeling every scenario. You have conversations with company management. You have supply chain data, credit card data, and foot traffic data that retail traders don’t have access to.
The dark pool print before earnings wasn’t a guess. It was informed conviction. And it was visible in the data days before the news hit.
It’s not about direction. We never say “institutions are buying” or “this is bullish.” A large print at $50 is a data point. The context — price action, timing, clustering — tells the story. The data speaks for itself.
It’s not a crystal ball. Not every trade works out. But understanding institutional positioning — the counter-moves, the nudge trades, the accumulation patterns — dramatically increases your chances of being on the right side. You’re making informed decisions, not gambling.
It’s not 13F filings. 13F filings show what hedge funds owned 3 months ago. Dark pool data shows what they’re doing right now.
It’s not about one trade. A single print can be anything — a rebalance, a hedge, an error. The real signal is in clustering: multiple large prints at the same price level across different days.
1. Identify unusual activity. Look for stocks with dark pool volume significantly above their average. If a stock normally sees $50M in dark pool activity and suddenly sees $200M, something is happening.
2. Check the price level. Where did the prints execute relative to the stock’s recent range? Prints at the lows = potential accumulation. Prints at the highs after a run = potential distribution.
3. Look for clustering. One print is noise. Five prints at the same price level across three days is a signal. Institutions build positions over time.
4. Compare to current price. If institutional VWAP is $50 and the stock is trading at $45, you’re below where the smart money entered. If it’s at $60, they’re likely in profit.
5. Be patient. Institutions don’t trade for the next hour — they trade for the next quarter. Give your thesis time to play out.
For the first time in market history, retail traders have access to the same dark pool data that was previously reserved for institutional desks. This is a genuine edge.
At MobyTick Trading, we’ve built a platform that tracks over 10,000 stocks with 5+ years of historical dark pool data. Our tools identify unusual activity, map institutional levels, and help you see what the big players are doing — in real time.
Following the money isn’t about predicting the future. It’s about positioning yourself alongside the entities that have the capital, the research, and the patience to move markets.
The data is there. The edge is real. The question is: are you paying attention?
Ready to follow the money?
Start your free trial at mobyticktrading.com
Get our FREE weekly dark pool report
Disclaimer: This content is for educational purposes only and should not be considered financial advice. Trading involves substantial risk of loss. Past performance is not indicative of future results.