Physical Address
304 North Cardinal St.
Dorchester Center, MA 02124
Physical Address
304 North Cardinal St.
Dorchester Center, MA 02124

This week's dark pool data reveals where institutions positioned $47+ billion across major ETFs. Our sector rotation analysis shows Consumer Staples received 7.5x more dark pool flow than Consumer Discretionary - a textbook risk-off signal amid the Iran/Hormuz oil crisis.
The U.S. stock market staged a powerful four-day rally to close the week, with the S&P 500 gaining 3.4%, the Nasdaq surging 4.4%, and the Dow adding 3.0%. Despite Friday’s Good Friday market closure, the shortened trading week delivered meaningful upside as geopolitical tensions around the Iran/Hormuz situation showed early signs of easing.
The dominant market narrative was the Iran conflict and its impact on global oil markets. Brent crude spiked above $112 per barrel as the Strait of Hormuz — through which roughly 20% of global oil flows — faced disruption. The IEA called it the largest supply disruption in the history of global oil markets. Iranian state media reported the country was working on a deal with Oman to allow some ships through the strait, sparking a recovery rally mid-week.
On the economic front, March payrolls came in far stronger than expected at 178,000 jobs (vs. 50,000 forecast) and unemployment dipped to 4.3%. Average hourly earnings rose just 0.2% MoM — the lowest annual reading (3.5% YoY) since May 2021 — easing some inflation concerns.
| Index | Mon Open | Thu Close | Weekly |
|---|---|---|---|
| S&P 500 (SPY) | $638.94 | $658.20 | +3.4% |
| Nasdaq 100 (QQQ) | $564.29 | $586.05 | +4.4% |
| Russell 2000 (IWM) | $243.04 | $252.37 | +3.8% |
| Dow Jones (DIA) | ~$38,400 | ~$39,200 | +3.0% |
This week’s dark pool data reveals a striking sector rotation pattern. While the market rallied, institutional dark pool flow tells a more nuanced story — one of hedging, selective accumulation, and clear sector preferences.
The most notable signal: Consumer Discretionary (XLY) received the LEAST dark pool flow ($151M) while Consumer Staples (XLP) received the MOST ($1.14B) — a 7.5:1 split that is a textbook risk-off rotation signal.
| ETF | Shares | Total Value | # Prints |
|---|---|---|---|
| SPY | 40,535,426 | $26.28B | 24 |
| QQQ | 11,302,792 | $6.50B | 8 |
| IVV | 10,101,555 | $6.65B | 4 |
| VOO | 8,444,588 | $5.09B | 2 |
| IWM | 1,706,008 | $426M | 1 |
| Sector (ETF) | Dark Pool Value | # Prints | Signal |
|---|---|---|---|
| XLP (Consumer Staples) | $1.14B | 23 | STRONGEST — Defensive rotation |
| XLE (Energy) | $974M | 54 | Iran/Hormuz oil play |
| XLF (Financials) | $928M | 59 | Rate uncertainty |
| XLI (Industrials) | $416M | 12 | Infrastructure |
| XLK (Technology) | $411M | 14 | Selective tech |
| XLU (Utilities) | $324M | 37 | Defensive demand |
| XLV (Healthcare) | $181M | 12 | Moderate |
| XLB (Materials) | $171M | 14 | Commodities |
| XLRE (Real Estate) | $166M | 10 | Rate-sensitive |
| XLY (Consumer Disc.) | $151M | 7 | LOWEST — Consumer caution |
| XLC (Communications) | $108M | 4 | Lightest flow |
Key Insight: Energy (XLE $974M) dominated as oil spiked on Iran tensions, while Consumer Staples (XLP $1.14B) received more flow than any sector. Consumer Discretionary (XLY) was dead last — institutions are not confident in consumer spending amid $112+ oil and tariff headwinds.
9 of 13 bullish triggers hit | 23 bullish targets triggered
5 of 13 bearish triggers hit | 5 bearish targets triggered
Highlight: META smashed through 6 bull targets to $592.55. MU had the wildest range — triggered both sides (bull T0, bear T3 to $311).
| Ticker | Bull Trigger | Weekly High | Bear Trigger | Weekly Low |
|---|---|---|---|---|
| SPY | $648.00 | $658.52 [T4 HIT] | $630.00 | $637.98 |
| QQQ | $570.00 | $587.74 [T5 HIT] | $560.00 | $564.21 |
| IWM | $252.50 | $252.44 | $240.00 | $242.24 |
| TSM | $350.00 | $348.68 | $322.50 | $321.14 [Bear T0] |
| TER | $305.00 | $316.81 [T2 HIT] | $290.00 | $277.93 [Bear T2] |
| MU | $372.50 | $377.89 [T0 HIT] | $350.00 | $311.49 [Bear T3] |
| BP | $47.00 | $48.27 [T2 HIT] | $44.75 | $45.56 |
| AVGO | $312.50 | $315.79 [T1 HIT] | $297.50 | $296.34 [Bear T0] |
| TERN | $53.25 | $52.89 | $50.00 | $52.65 |
| MCD | $312.50 | $311.68 | $304.75 | $303.03 [Bear T0] |
| UNH | $272.50 | $279.04 [T2 HIT] | $257.00 | $262.61 |
| META | $550.00 | $592.55 [T6 HIT] | $517.50 | $546.77 |
| NVDA | $173.00 | $177.49 [T1 HIT] | $165.00 | $166.96 |
| Ticker | Trigger | T1 | T2 | T3 | T4 | T5 | T6 | T7 |
|---|---|---|---|---|---|---|---|---|
| SPY | $660 | $662.50 | $665 | $675 | $680 | |||
| QQQ | $587.50 | $590 | $592.50 | $595 | $600 | $605 | $607 | $610 |
| IWM | $253 | $255 | $257 | $260 | $265 | $270 | ||
| FBIN | $38 | $39 | $40 | $42.50 | $44 | $45 | $47.50 | $50 |
| EFX | $185 | $187.50 | $190 | $192.50 | $195 | $197.50 | ||
| NKE | $45 | $47.50 | $50 | $52.50 | $55 | $56.25 | $57.50 | $60 |
| CRM | $187.50 | $190 | $192.50 | $195 | $197.50 | $200 | $202.50 | $205 |
| UNH | $285 | $287.50 | $290 | $295 | $300 | $310 | $312.50 | |
| NVDA | $180 | $182.50 | $185 | $187.50 | $190 | |||
| SNDK | $712.50 | $720 | $730 | $750 | $770 | $780 | $800 | |
| ACN | $205 | $207.50 | $210 | $212.50 | $215 | |||
| PYPL | $46.50 | $47.50 | $50 | $51.25 | $52.50 | $55 |
| Ticker | Trigger | T1 | T2 | T3 | T4 | T5 | T6 | T7 |
|---|---|---|---|---|---|---|---|---|
| SPY | $645 | $642.50 | $640 | $635 | $632.50 | $630 | $625 | |
| QQQ | $577 | $575 | $572.50 | $570 | $565 | $562.50 | $560 | $555 |
| IWM | $246 | $243 | $240 | $237.50 | $235 | $230 | ||
| FBIN | $36 | $35 | $34 | $33 | $32 | $31 | $30 | |
| EFX | $175 | $172.50 | $170 | $167.50 | $165 | $162.50 | $160 | |
| NKE | $42.50 | $40 | $37.50 | $35 | $32.50 | $30 | $27.50 | $25 |
| CRM | $183 | $180 | $177.50 | $175 | $172.50 | $170 | $167.50 | $165 |
| UNH | $265 | $262.50 | $260 | $255 | $250 | $245 | $240 | |
| NVDA | $172.50 | $170 | $167.50 | $165 | $162.50 | $160 | $157.50 | $155 |
| SNDK | $640 | $630 | $610 | $600 | $572.50 | $550 | ||
| ACN | $196 | $195 | $192.50 | $190 | $187.50 | $185 | ||
| PYPL | $44 | $43 | $42 | $41 | $40 | $37.50 | $35 |
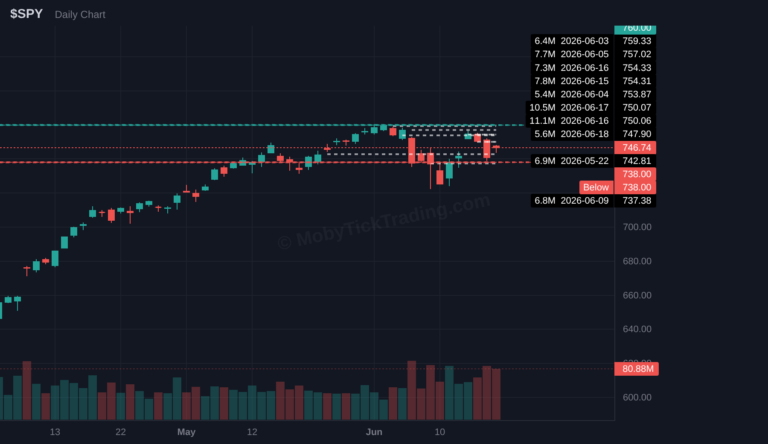
Dark Pool Print: $26.28B total dark pool flow | 40.5M shares | 24 prints
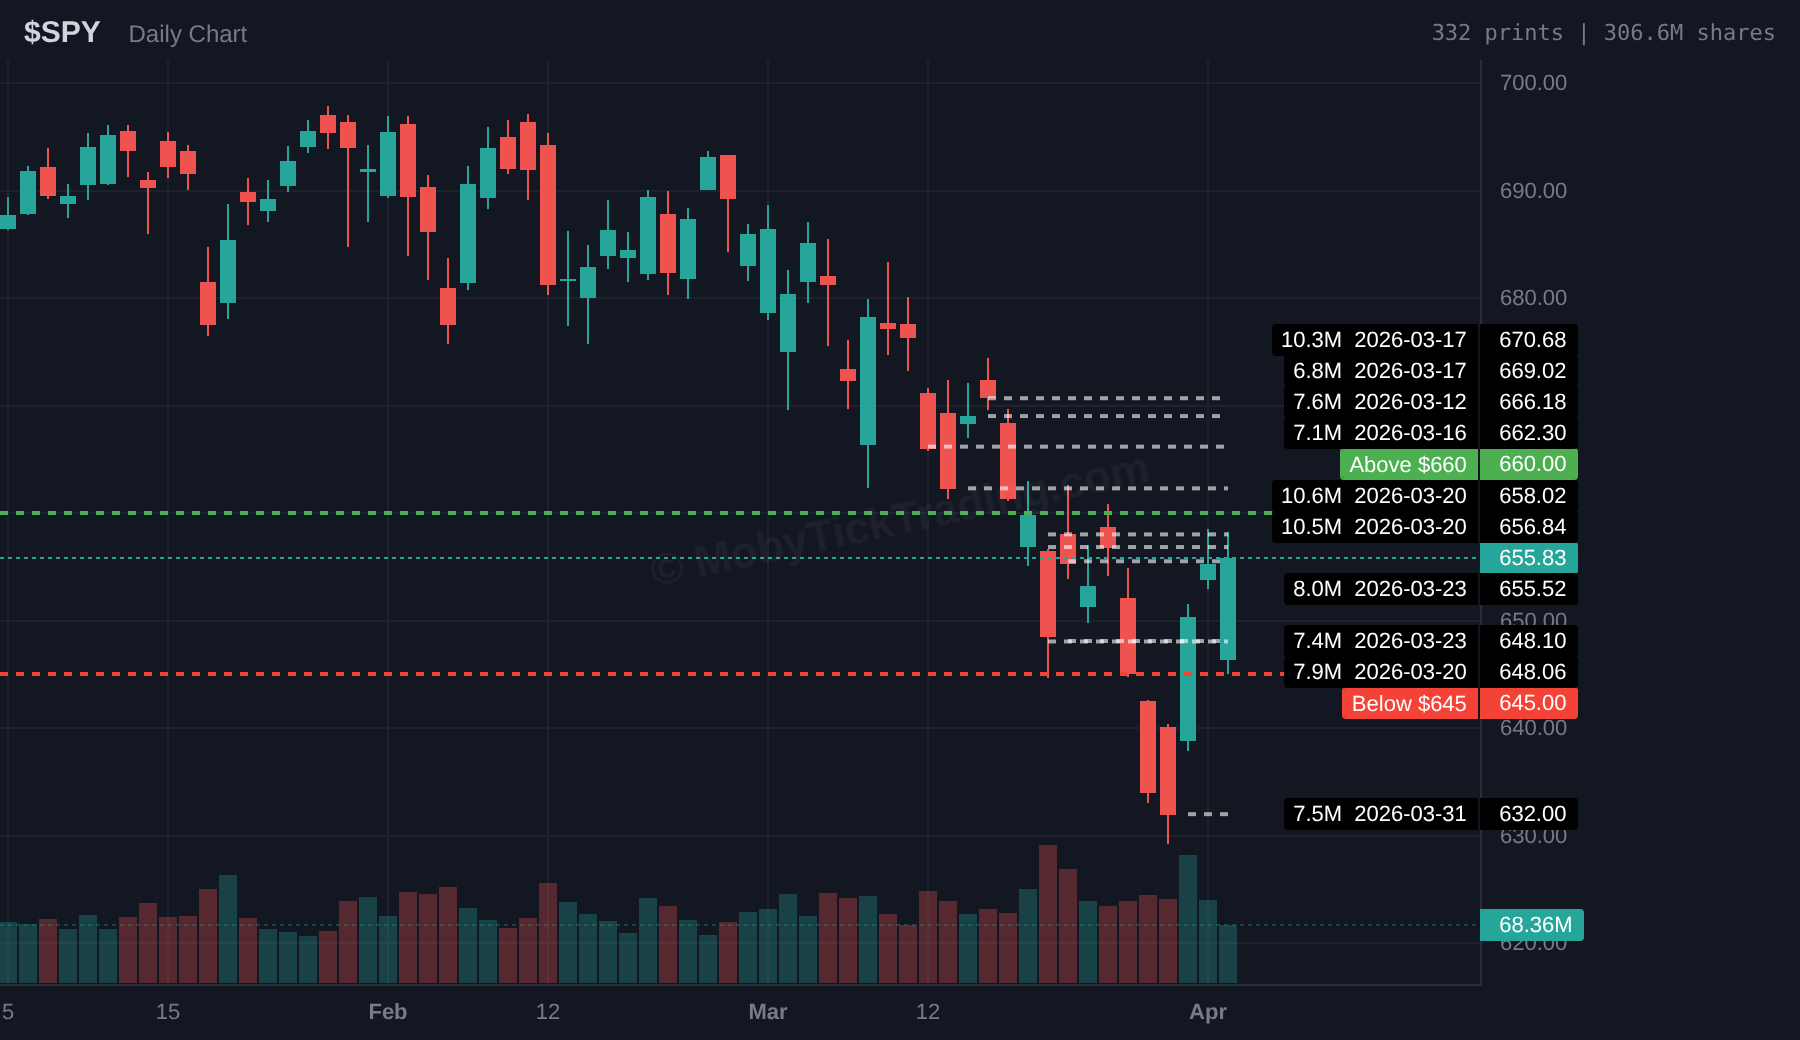
SPY saw $26.28 billion in dark pool prints this week — one of the most active weeks on record. Prints ranged from $632 to $670, with institutions buying the dip aggressively in the $632–$655 range.
▲ Bullish above $660 → Targets: $662.50, 665, 675, 680
▼ Bearish below $645 → Targets: $642.50, 640, 635, 632.50, 630, 625
Dark Pool Print: $6.50B total dark pool flow | 11.3M shares | 8 prints
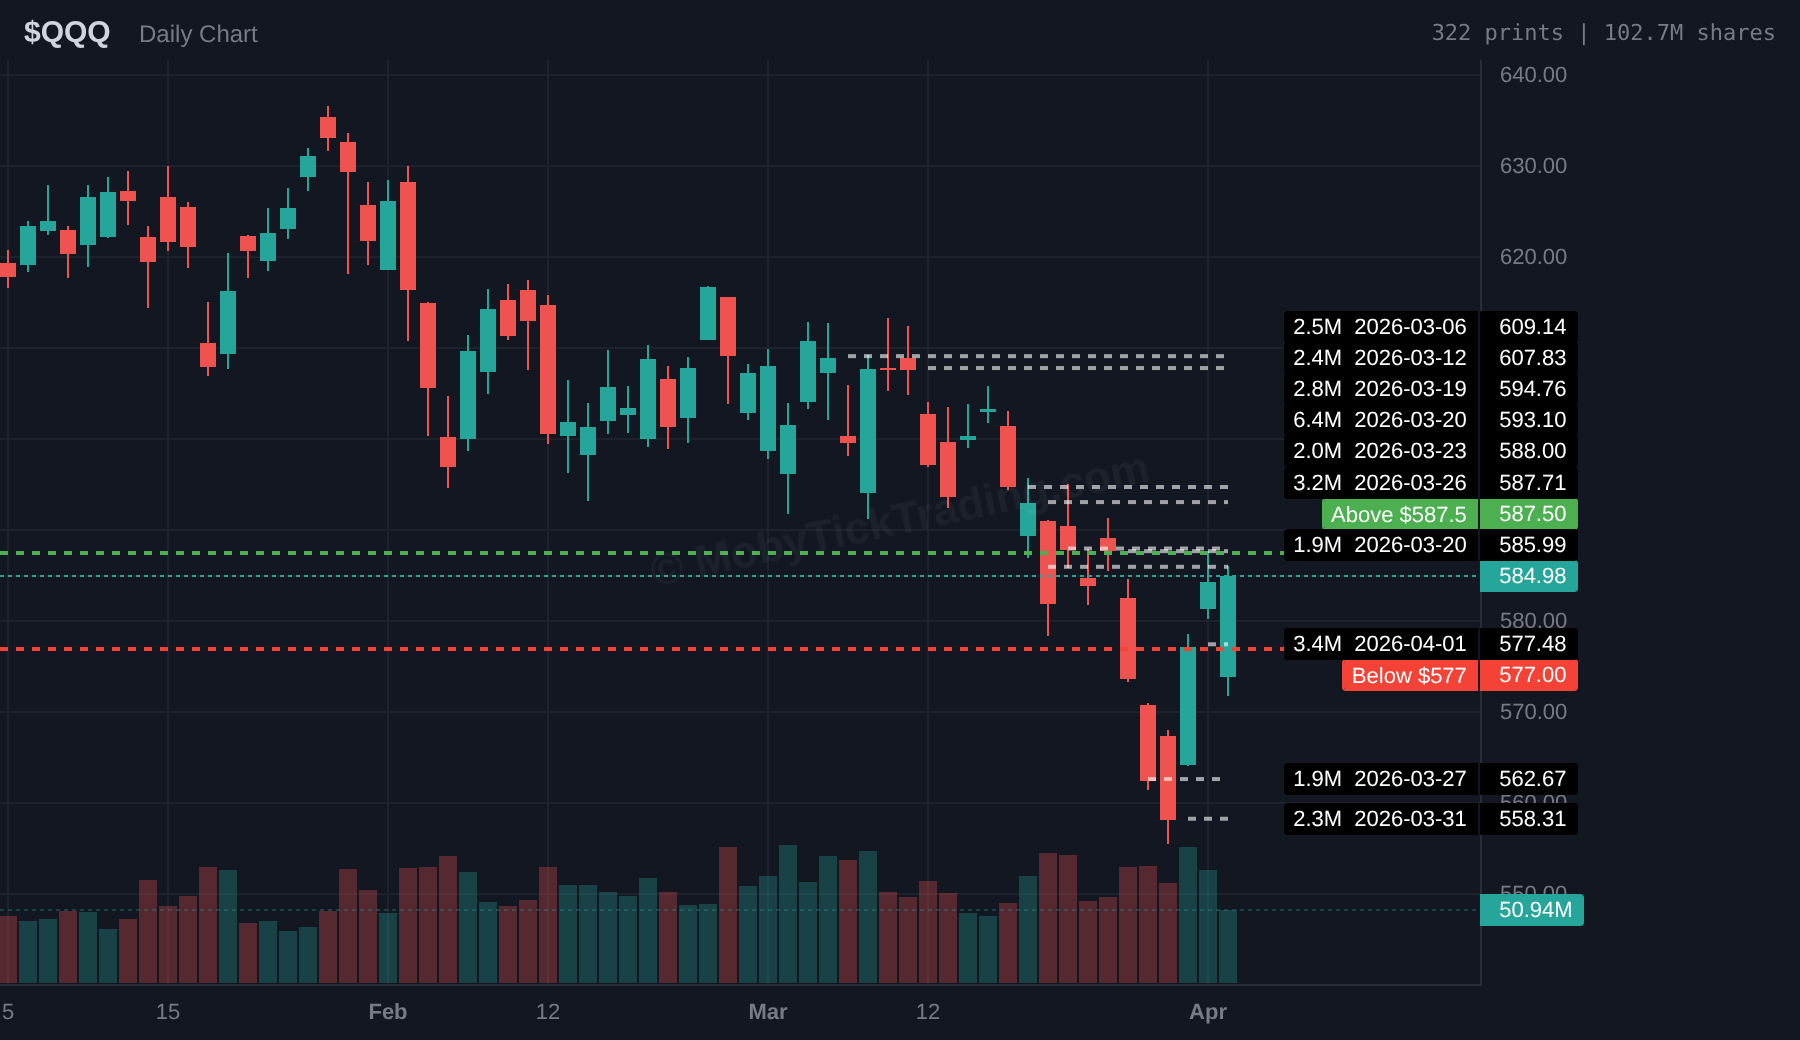
The Nasdaq led the rally with a 4.4% gain. QQQ’s largest print ($749M) crossed on Mar 31 at $575.90. Sector rotation data shows XLK received $411M — selective rather than broad tech accumulation.
▲ Bullish above $587.50 → Targets: $590, 592.50, 595, 600, 605, 607, 610
▼ Bearish below $577 → Targets: $575, 572.50, 570, 565, 562.50, 560, 555
Dark Pool Print: $426M total dark pool flow | 1.7M shares | 1 print
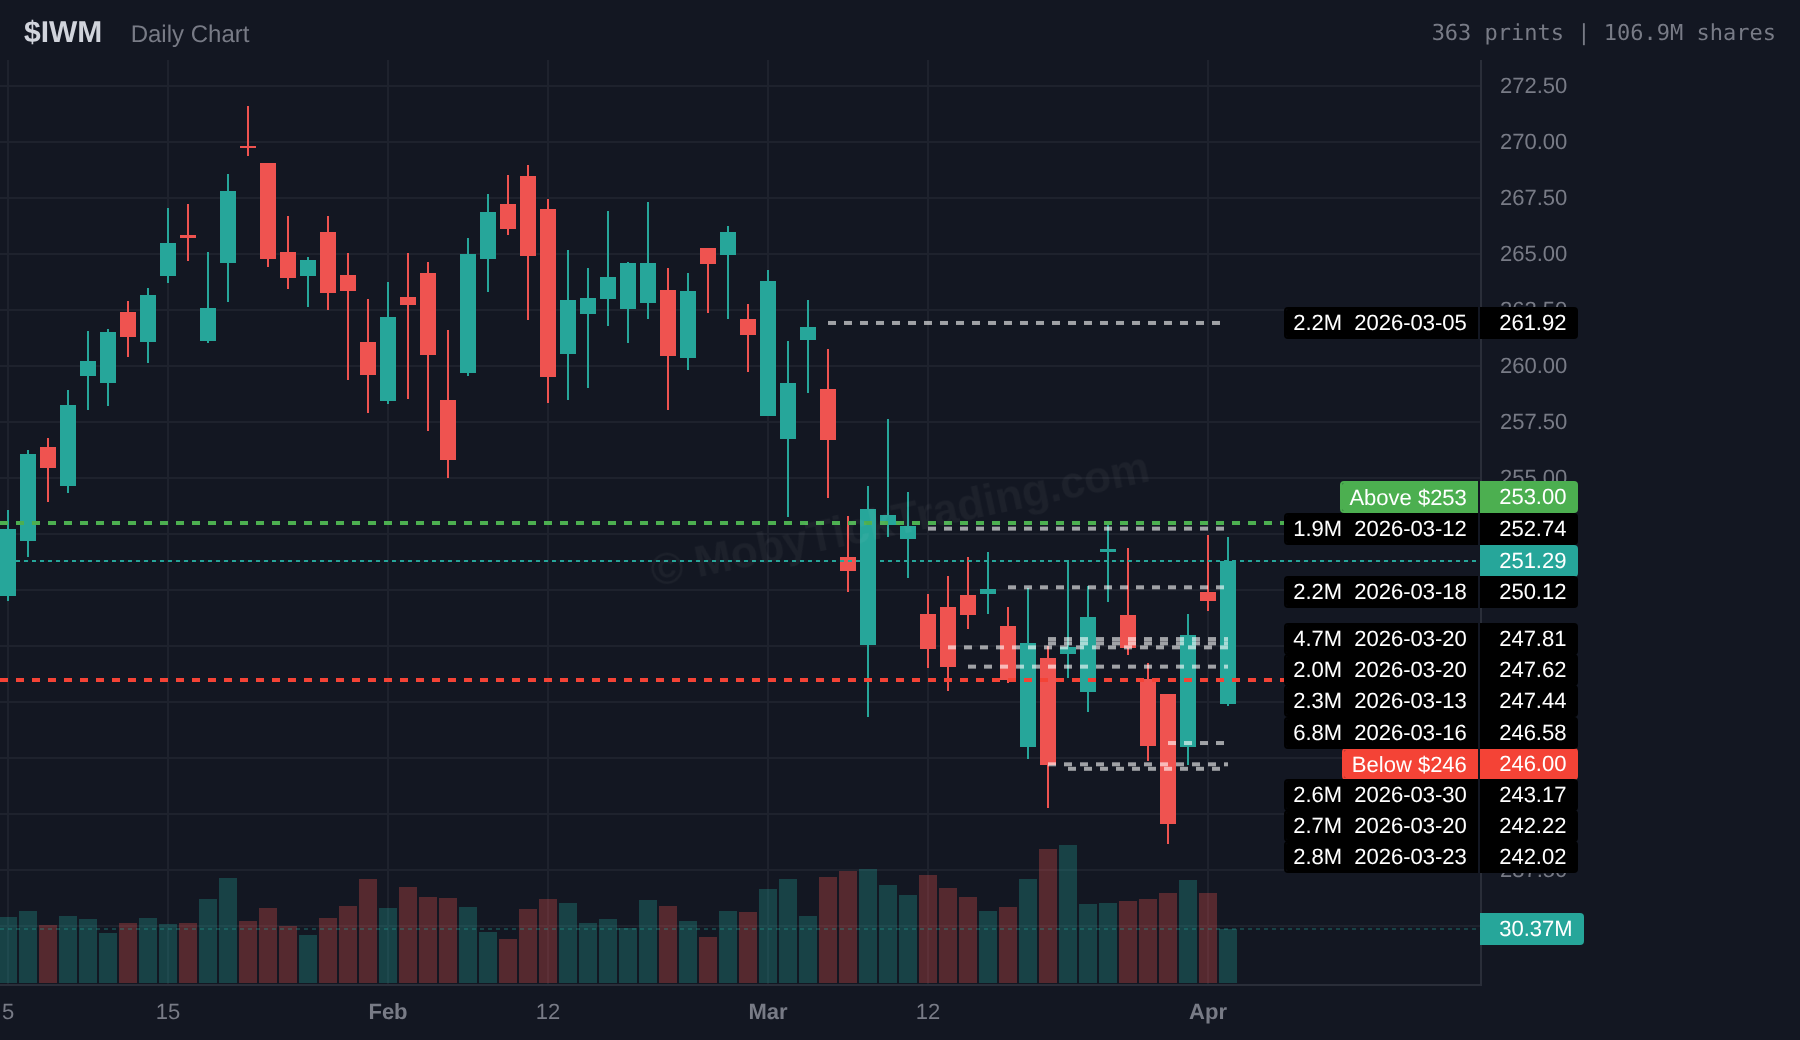
IWM received the lightest ETF flow at $426M. Small caps lagged the broad rally, consistent with the defensive sector rotation. The Iran ceasefire narrative favors large-cap multinationals.
▲ Bullish above $253 → Targets: $255, 257, 260, 265, 270
▼ Bearish below $246 → Targets: $243, 240, 237.50, 235, 230
Dark Pool Print: $420M — 11,346,600 shares at $37.03 | 353% of ADV30 | NEW 52-WEEK LOW
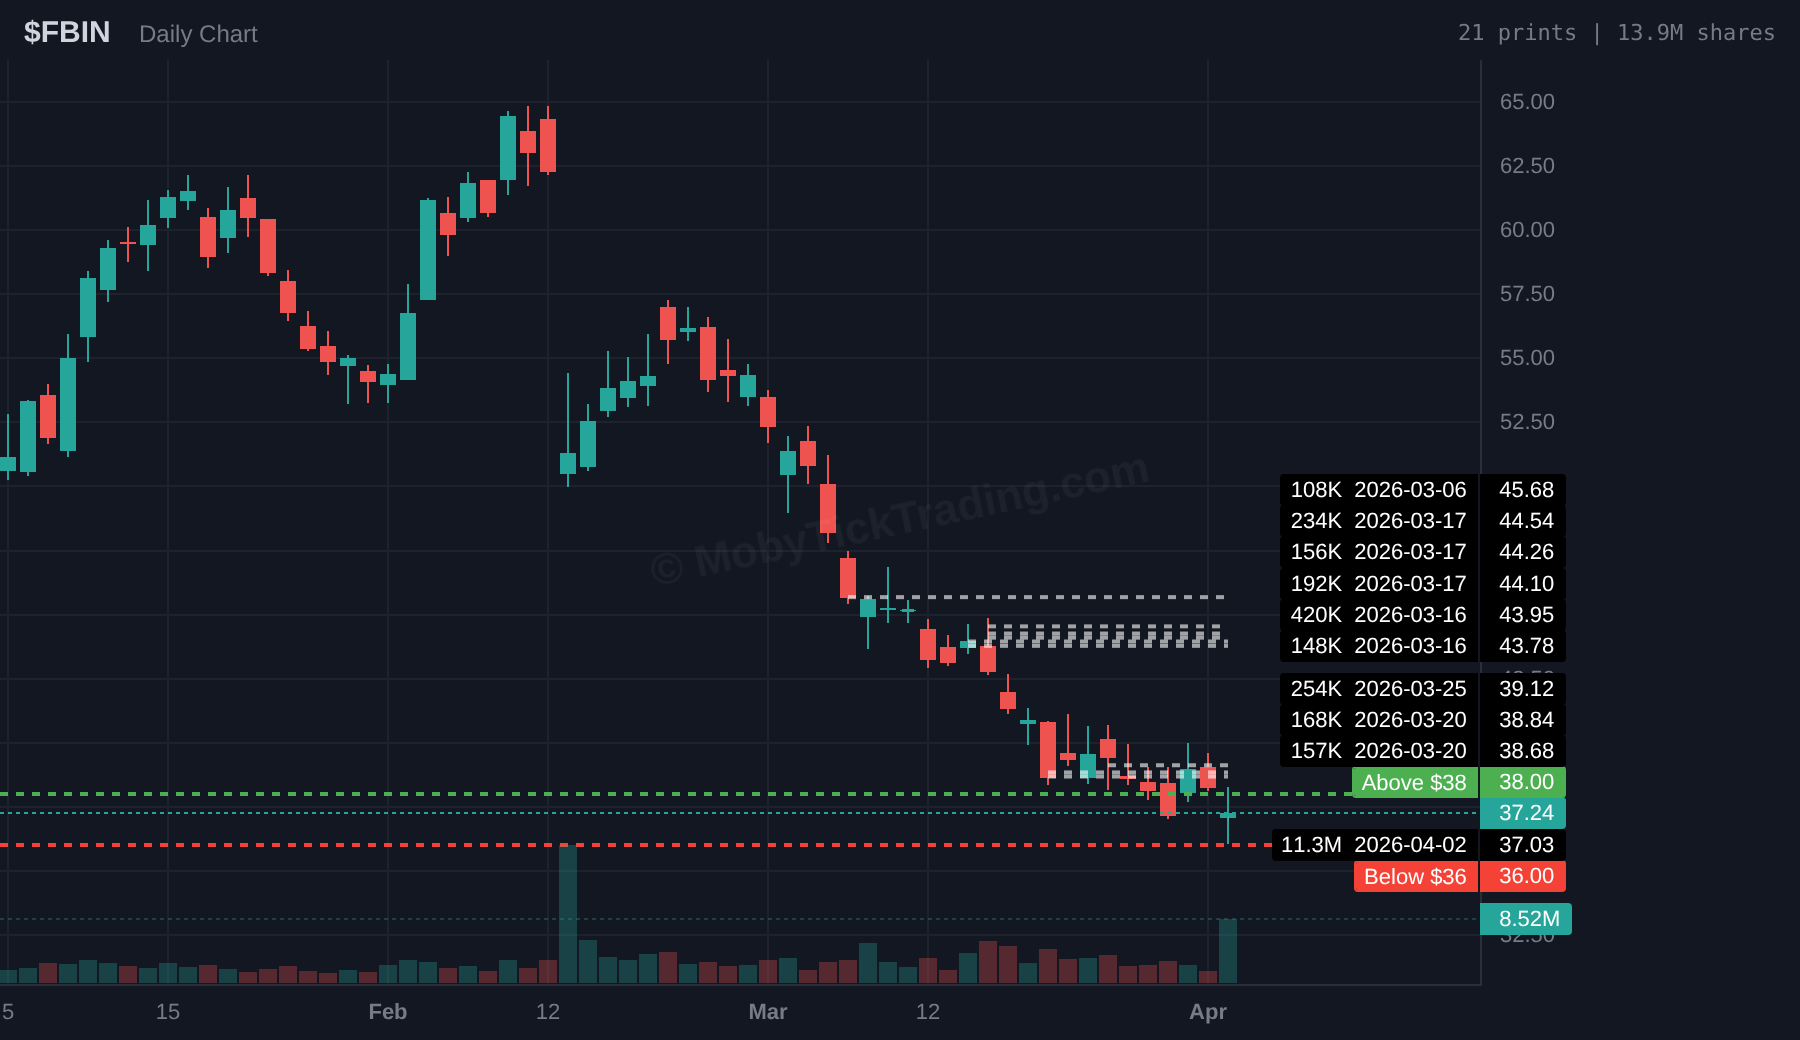
The standout under-the-radar signal of the week. FBIN hit a new 52-week low at $36.93 — and 11,346,600 shares crossed at $37.03 for $420M. That is 23 times larger than any print in the prior 90 days. Volume ratio of 353% makes this the most significant relative signal.
▲ Bullish above $38 → Targets: $39, 40, 42.50, 44, 45, 47.50, 50
▼ Bearish below $36 → Targets: $35, 34, 33, 32, 31, 30
Dark Pool Print: $412M — 2,310,700 shares at $178.20 | 142% of ADV30
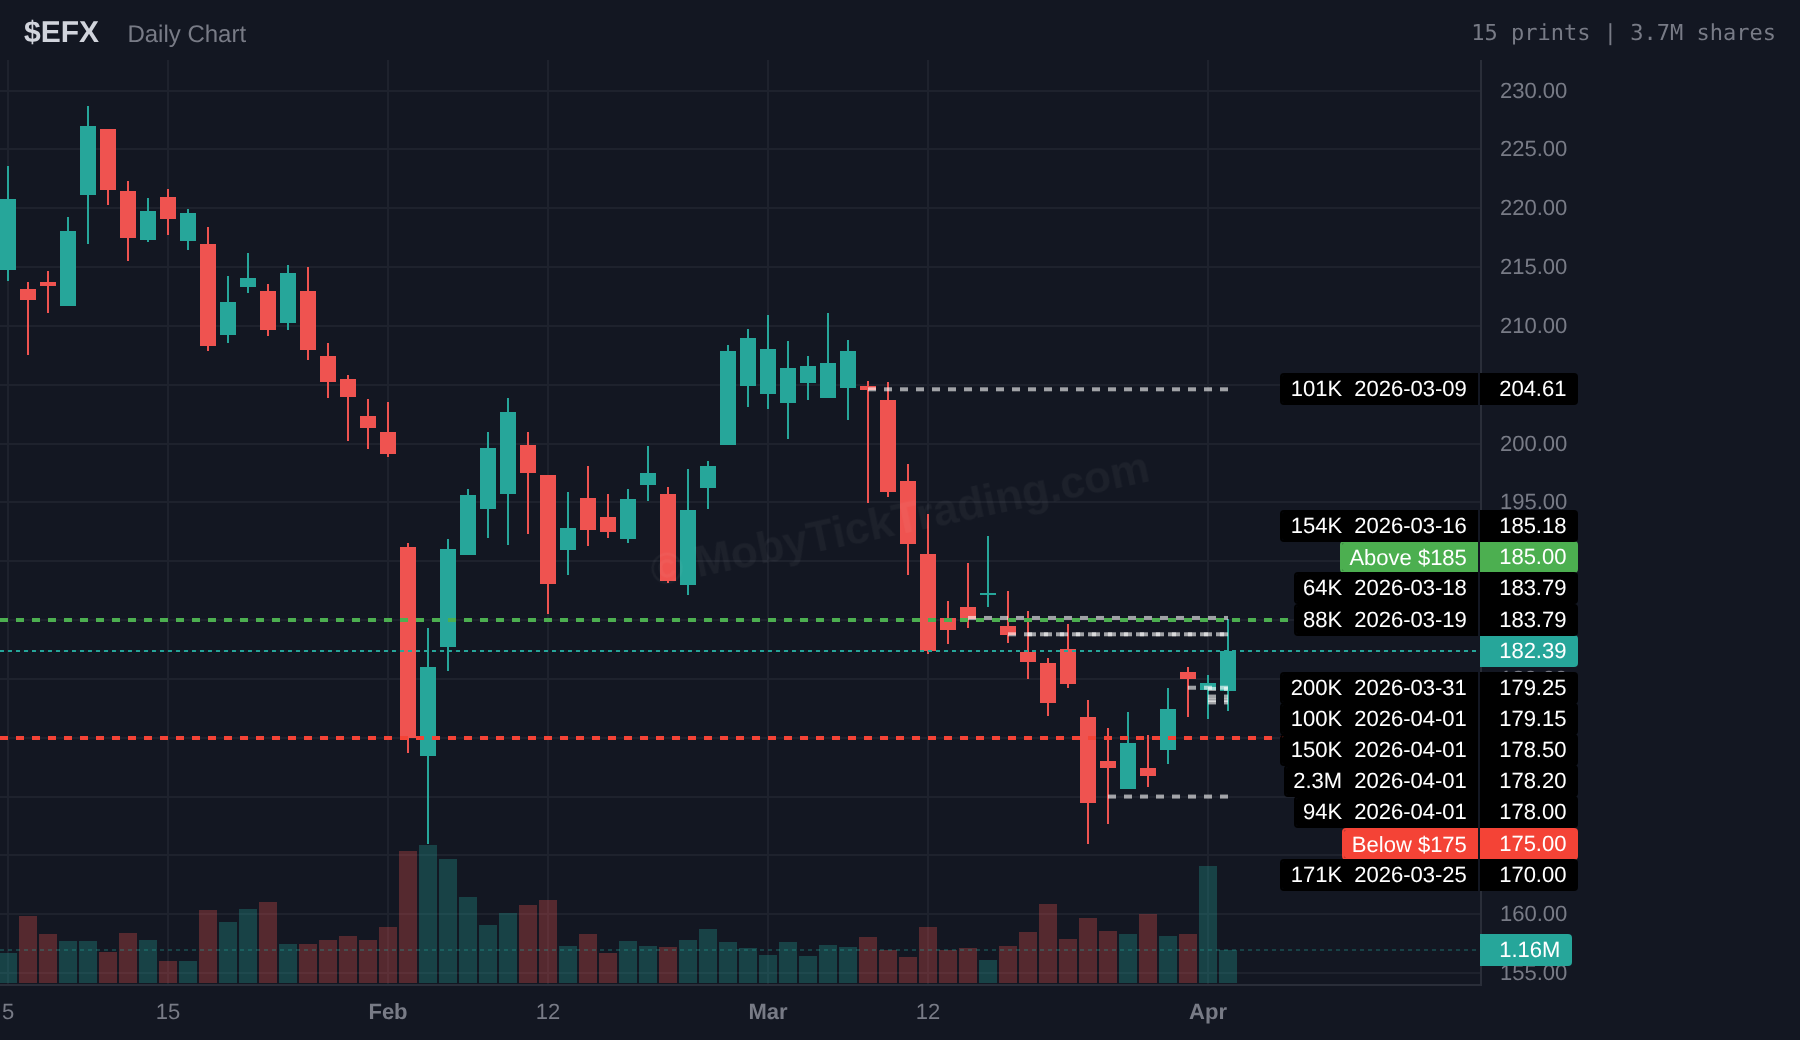
The 2,310,700-share print at $178.20 is four times larger than any print in the prior 90 days. This print appears related to M&A activity — the size relative to EFX’s typical dark pool activity warrants attention regardless of the catalyst.
▲ Bullish above $185 → Targets: $187.50, 190, 192.50, 195, 197.50
▼ Bearish below $175 → Targets: $172.50, 170, 167.50, 165, 162.50, 160
Dark Pool Print: $311M — 7,130,000 shares at $43.62 | LARGEST NKE PRINT EVER
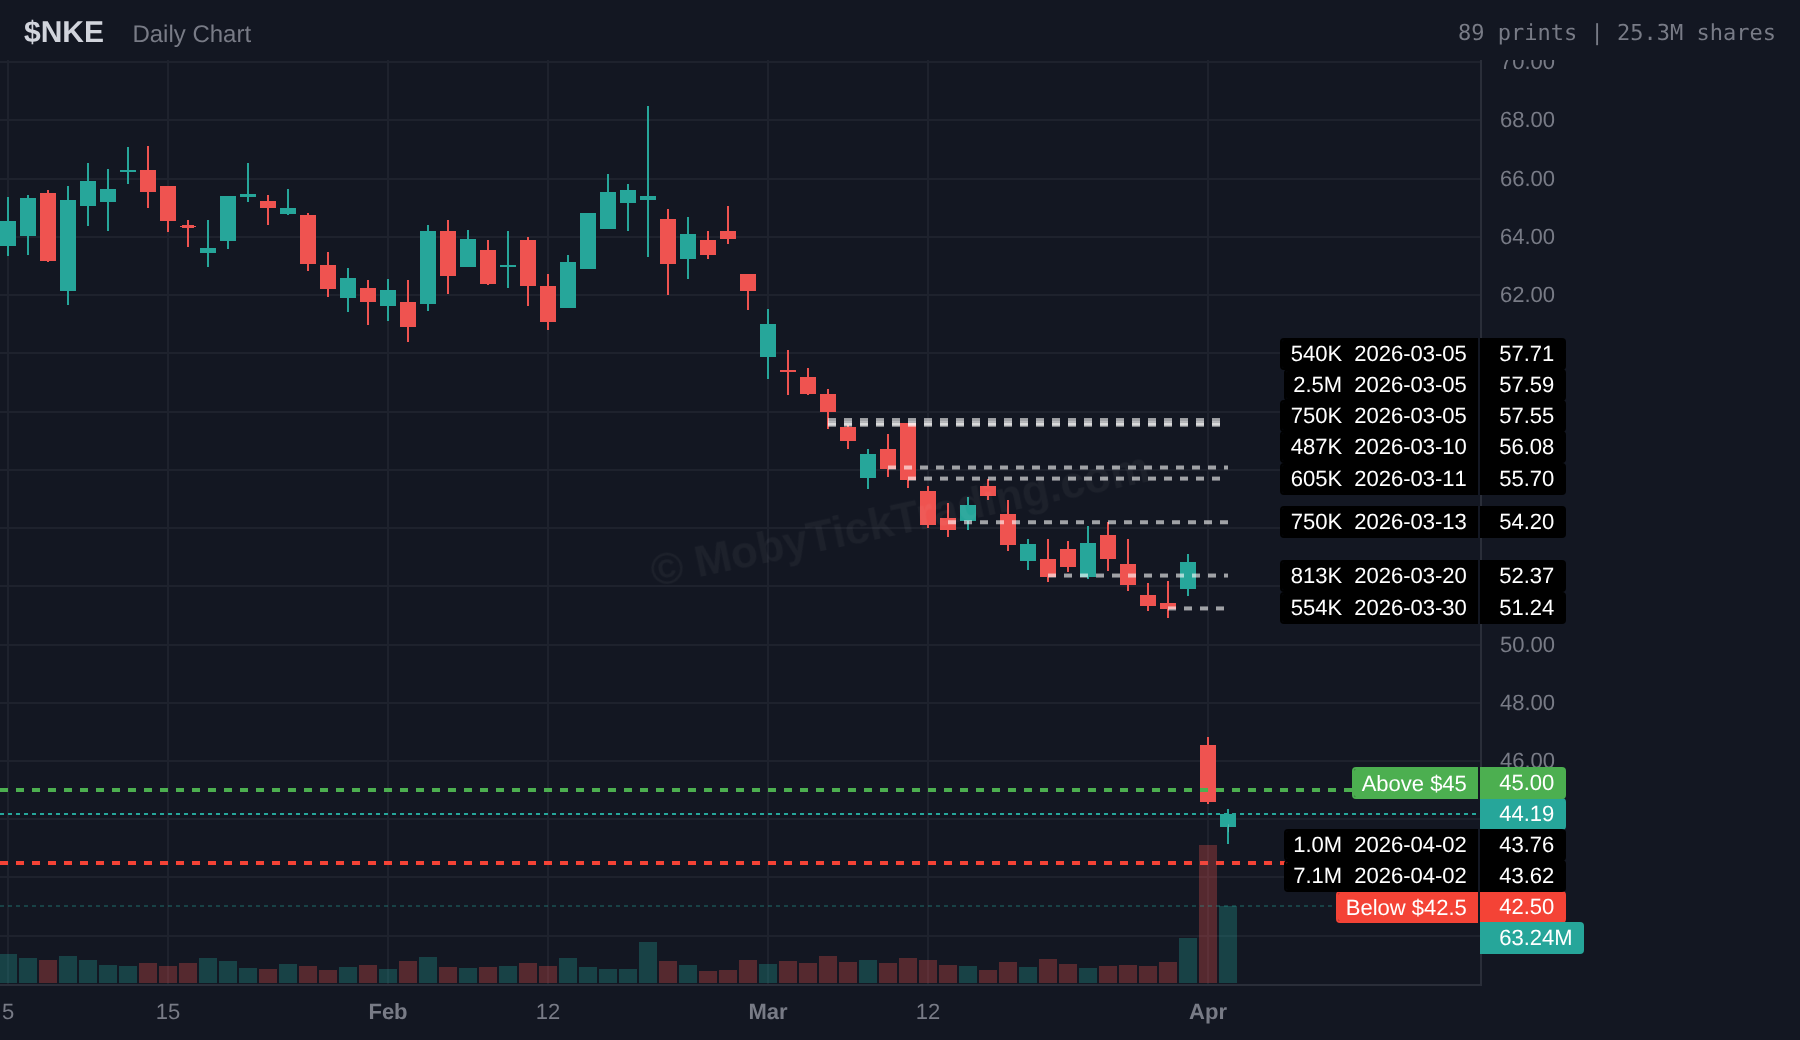
The highest-conviction signal this week. A 7,130,000-share print at $43.62 — verified $0.57 below close — is the largest NKE dark pool print ever. Nike reported Q3 with net income down 35% YoY. 20+ analysts cut price targets. Volume 220% above average. Verified NOT a closing cross.
▲ Bullish above $45 → Targets: $47.50, 50, 52.50, 55, 56.25, 57.50, 60
▼ Bearish below $42.50 → Targets: $40, 37.50, 35, 32.50, 30, 27.50, 25
Dark Pool Print: $1.04B+ this week — Multiple prints | 18% of ADV30
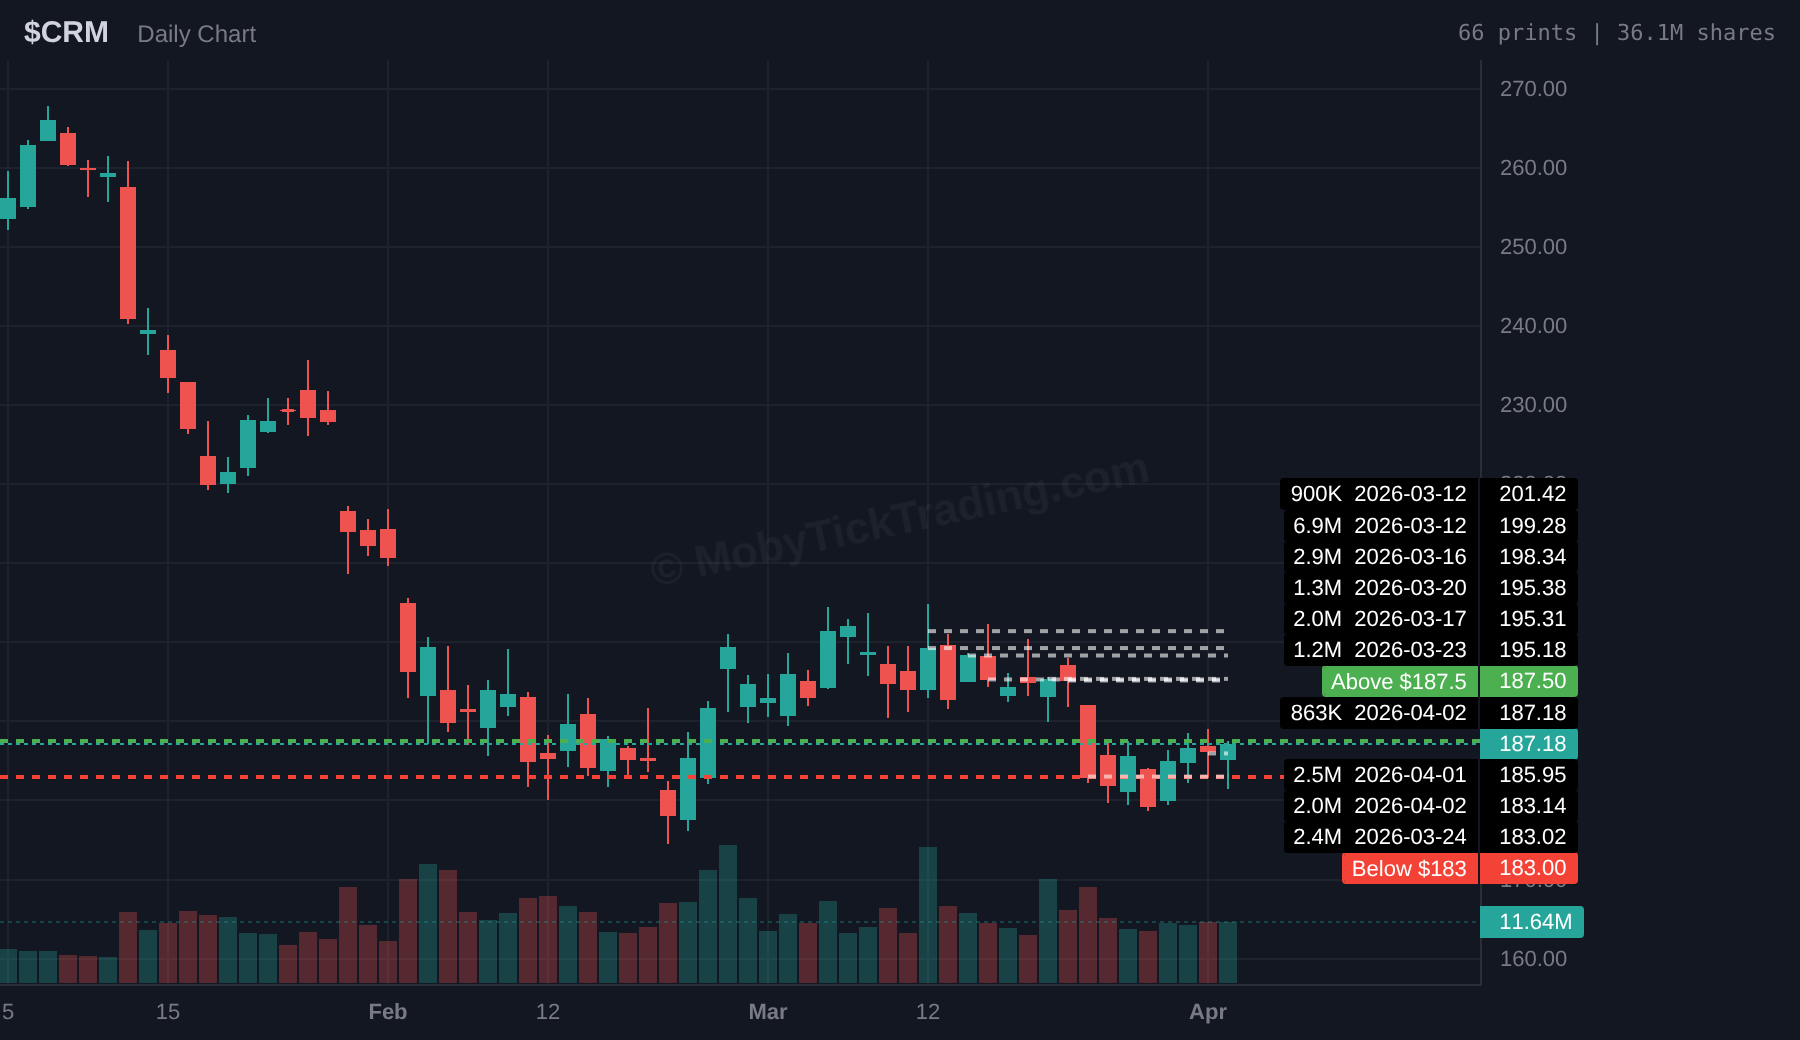
Down 26.2% YTD, but dark pool data shows 4 prints totaling over $1 billion this week. The Apr 2 print at $183.14 ($366M) is verified $4 below close. $50 billion buyback active. New Buy rating on Apr 2.
▲ Bullish above $187.50 → Targets: $190, 192.50, 195, 197.50, 200, 202.50, 205
▼ Bearish below $183 → Targets: $180, 177.50, 175, 172.50, 170, 167.50, 165
Dark Pool Print: $928M+ this week — Multiple prints | 17% of ADV30
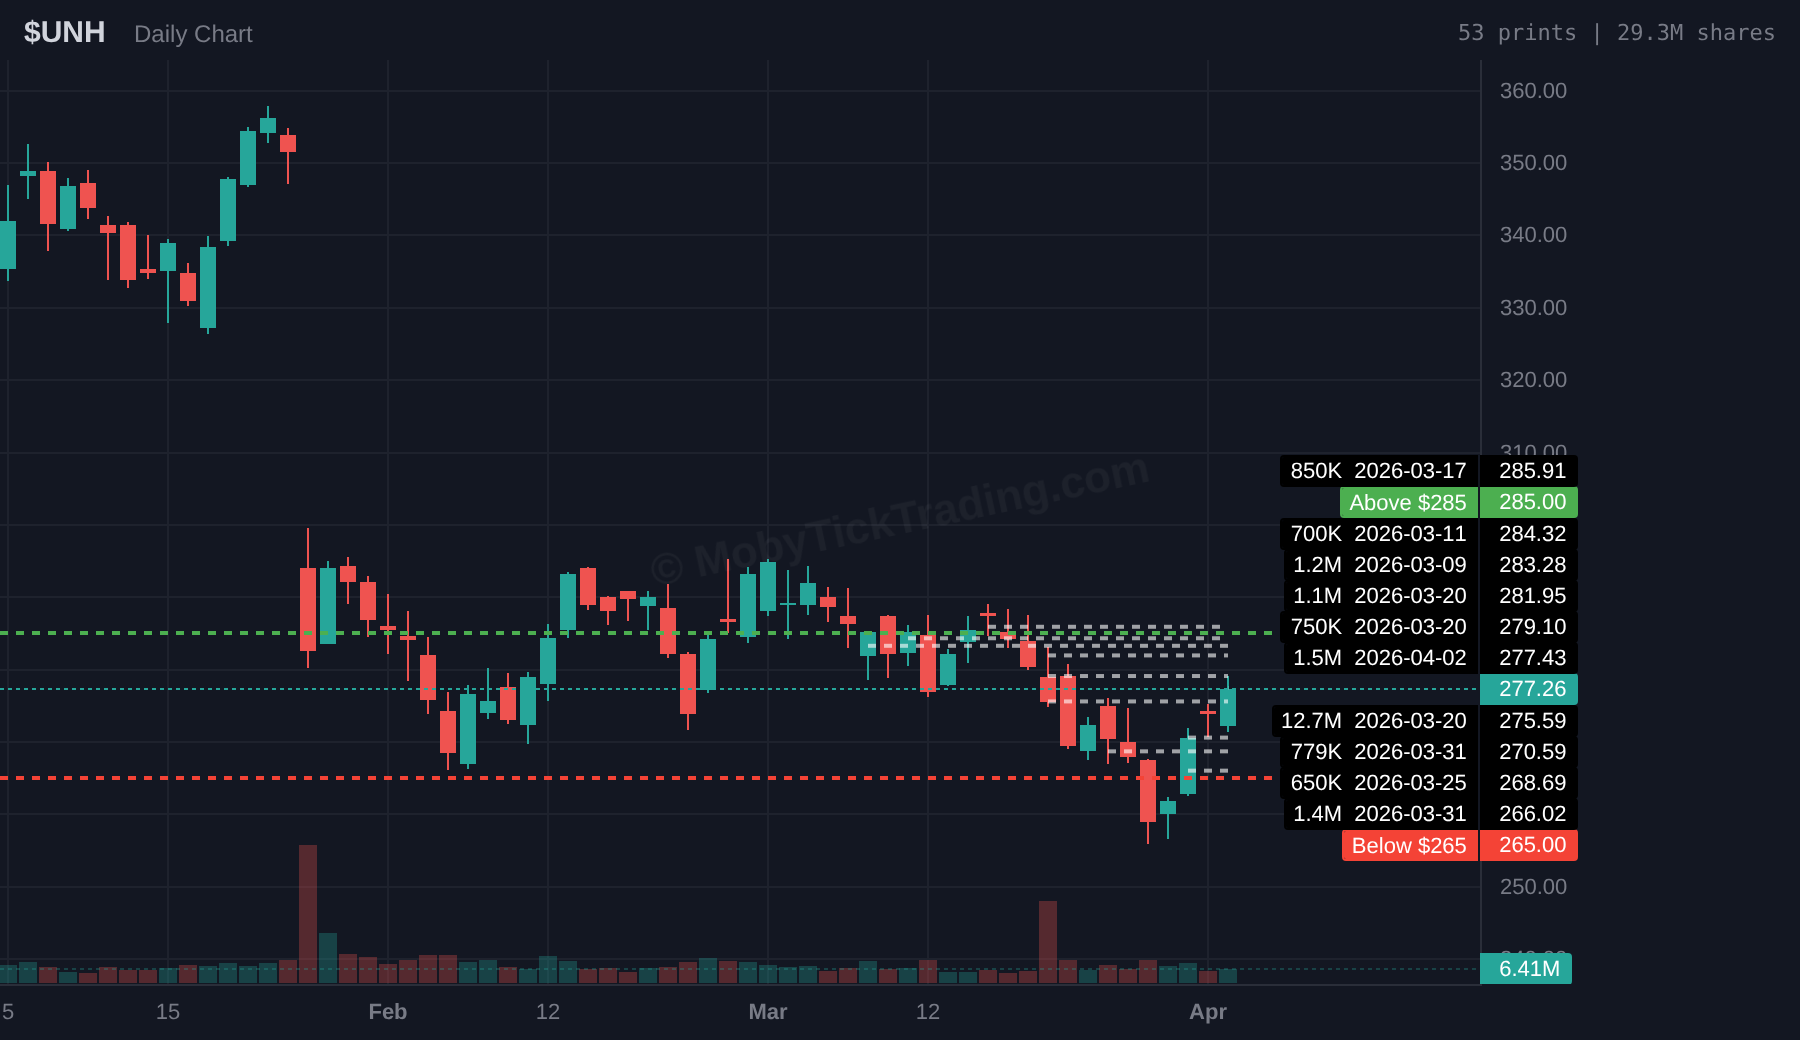
Down from $353 (January) to $277. The 90-day pattern shows prints at $288-292 in Feb, $281-285 in March, and $266-277 this week — a clear step-down accumulation pattern at progressively lower prices.
▲ Bullish above $285 → Targets: $287.50, 290, 295, 300, 310, 312.50
▼ Bearish below $265 → Targets: $262.50, 260, 255, 250, 245, 240
Dark Pool Print: ~$1.83B this week — 10.5M shares at $174-177
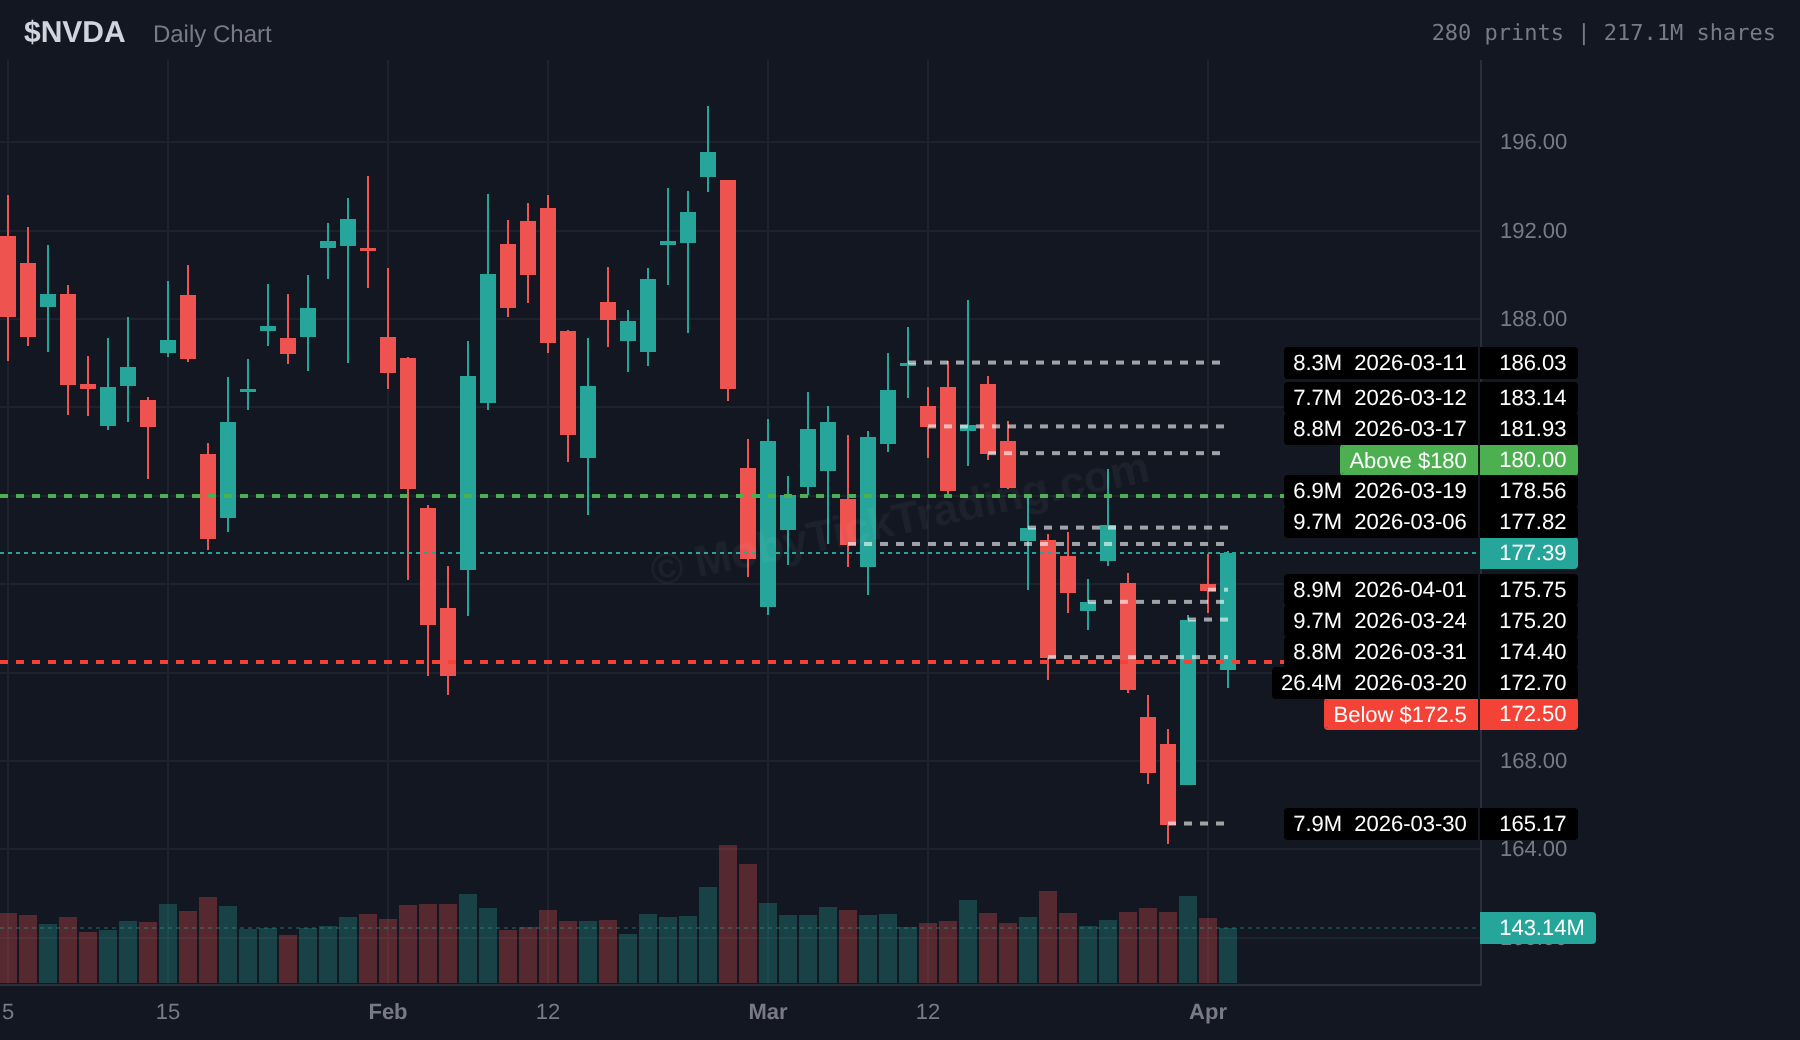
Consistent institutional dark pool activity in the $174-177 consolidation zone. The 90-day pattern shows NVDA consolidating between $165 and $190, with consistent accumulation at $175. Feb 5 had a $1.5B print at $176.
▲ Bullish above $180 → Targets: $182.50, 185, 187.50, 190
▼ Bearish below $172.50 → Targets: $170, 167.50, 165, 162.50, 160, 157.50, 155
Dark Pool Print: $541M — 780,000 shares at $693 | Apr 2
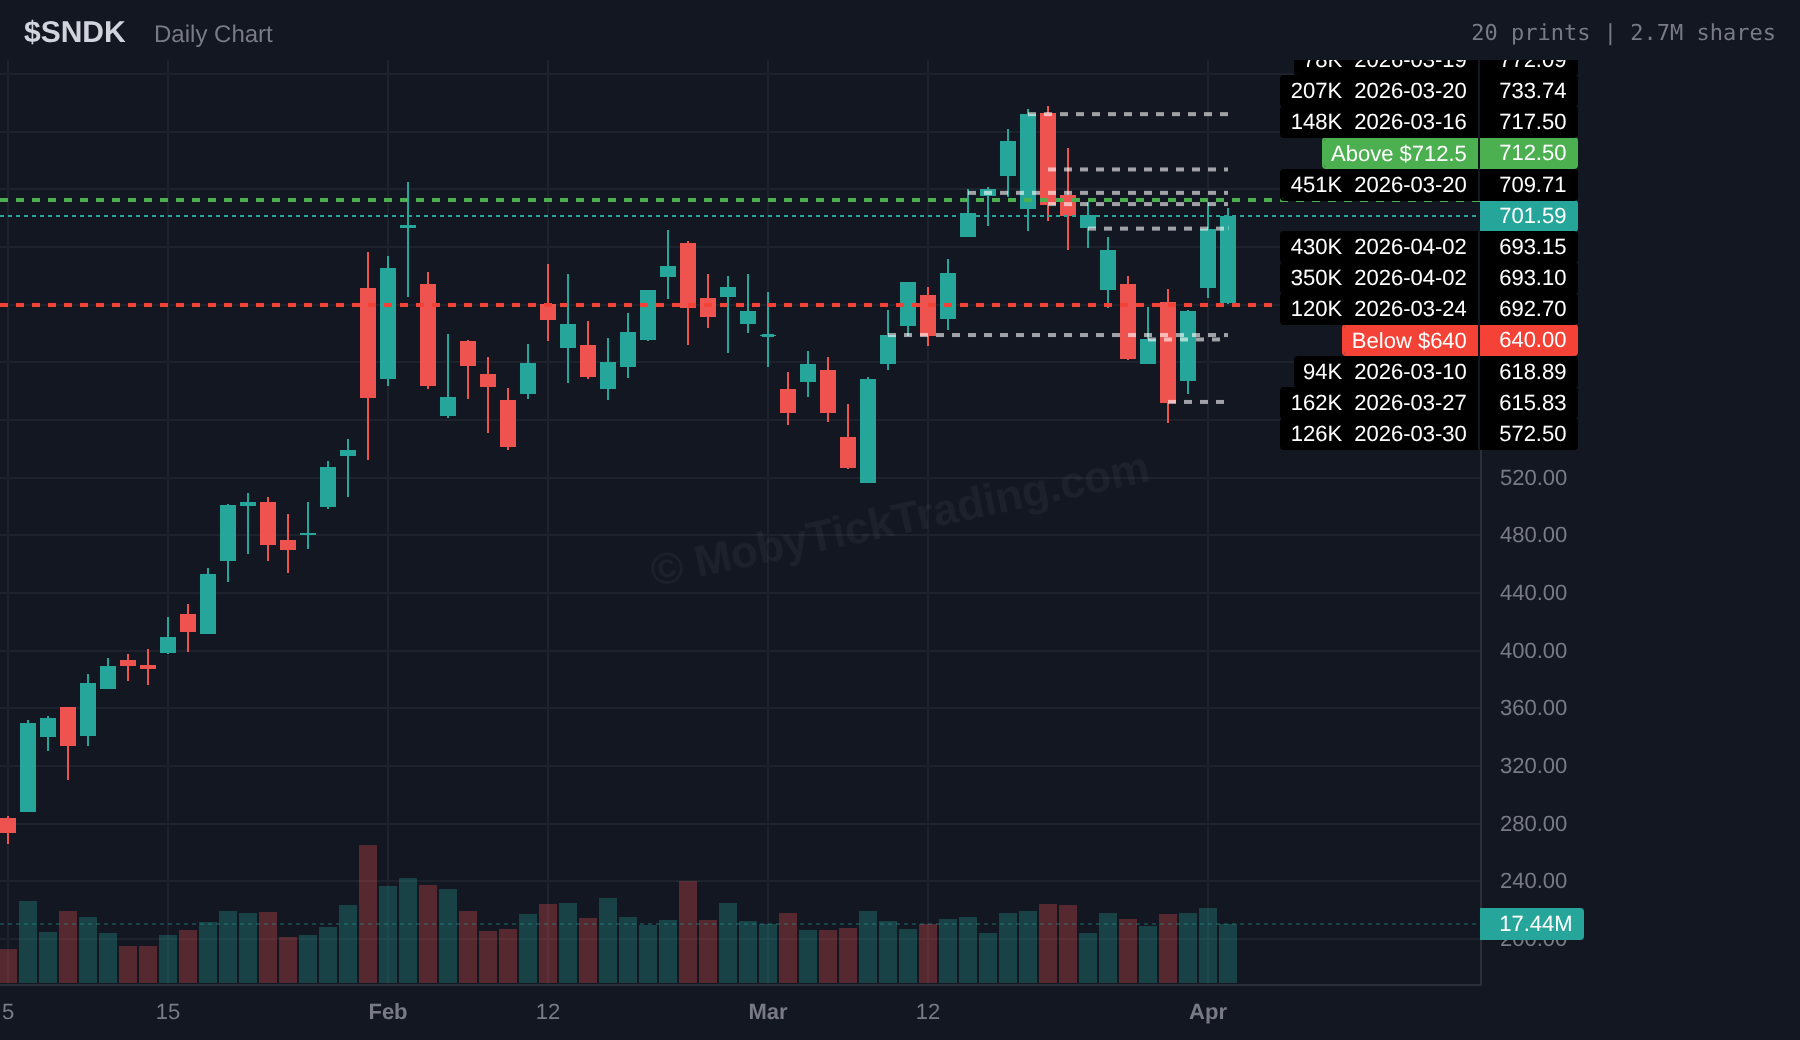
780,000 shares crossed at $693 — $541 million in a single day. The stock has surged from $472 (January) to $693, up ~47%. The AI infrastructure buildout is driving demand for data center storage.
▲ Bullish above $712.50 → Targets: $720, 730, 750, 770, 780, 800
▼ Bearish below $640 → Targets: $630, 610, 600, 572.50, 550
Dark Pool Print: $290M — 1,461,644 shares at $198.29 | 18% of ADV30
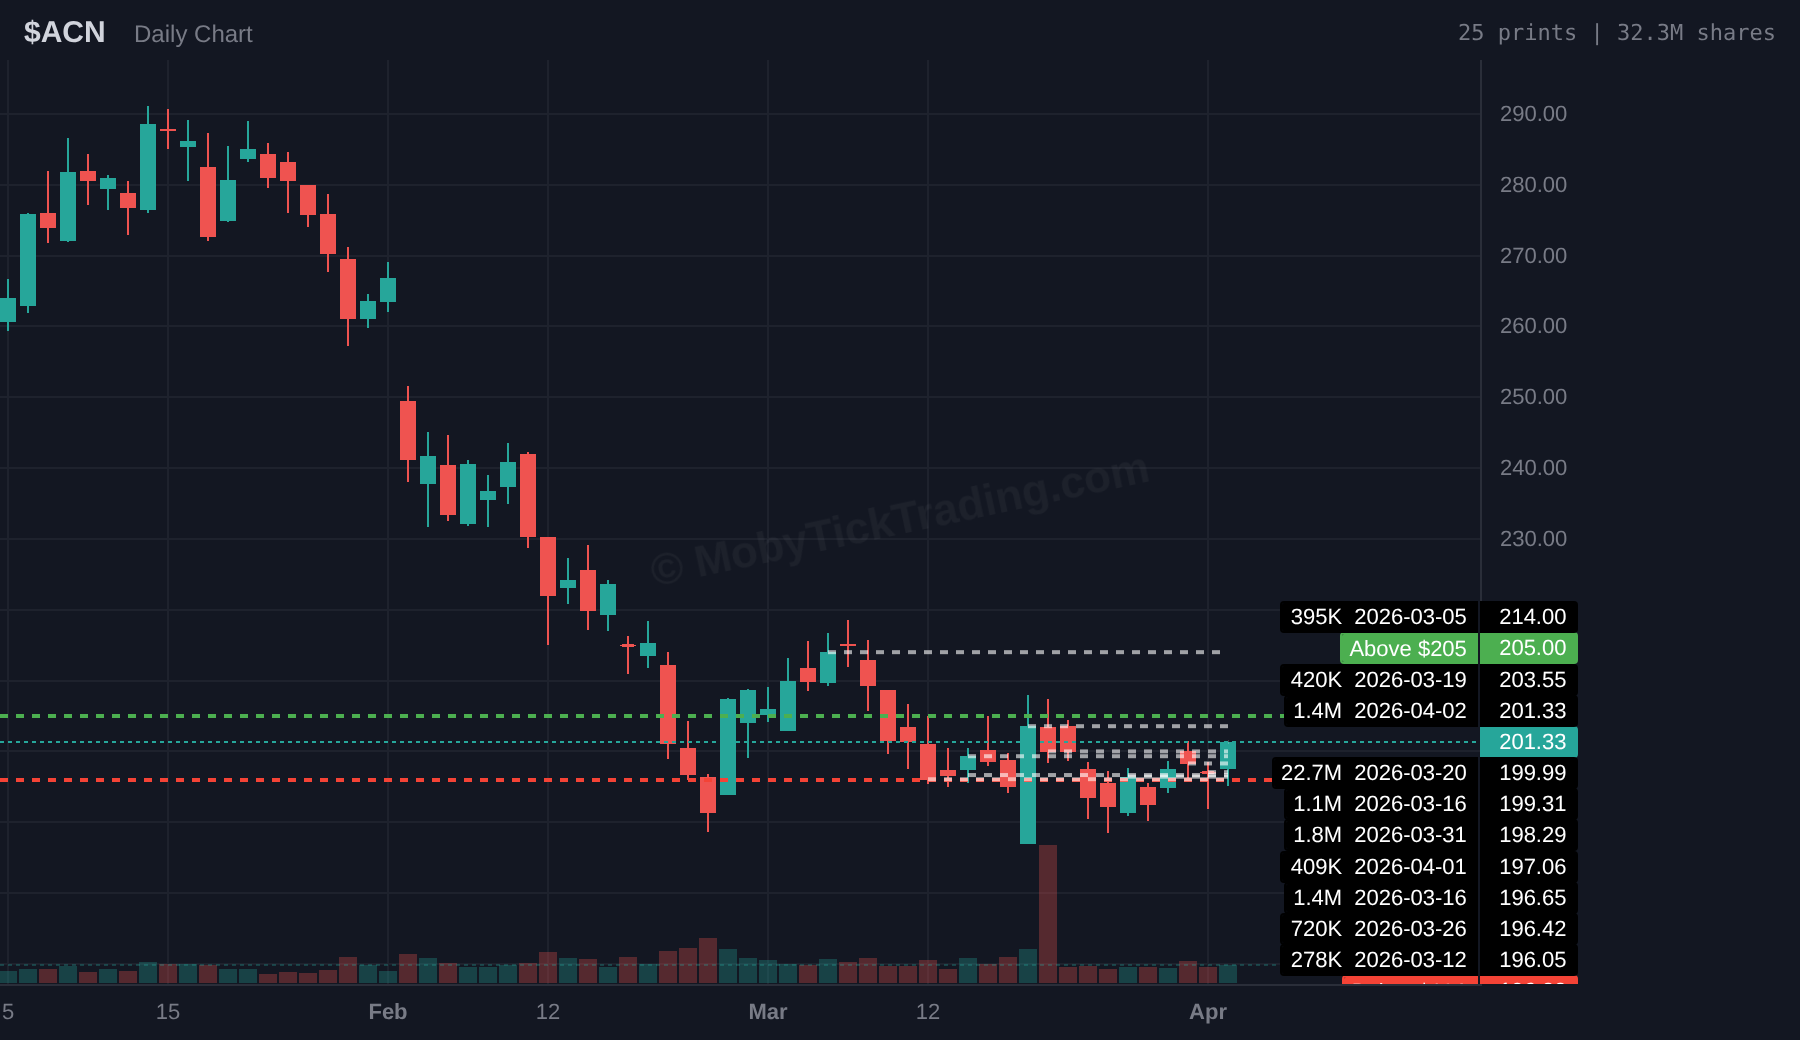
A 1,461,644-share print at $198.29 — verified $3 below close. Down from $274 (January) to $198. The 90-day pattern shows prints stepping down: $274, $206, $199, $198. Textbook accumulation at progressively lower levels.
▲ Bullish above $205 → Targets: $207.50, 210, 212.50, 215
▼ Bearish below $196 → Targets: $195, 192.50, 190, 187.50, 185
Dark Pool Print: $90M — 2,000,000 shares at $44.90 | 90-Day Accumulation
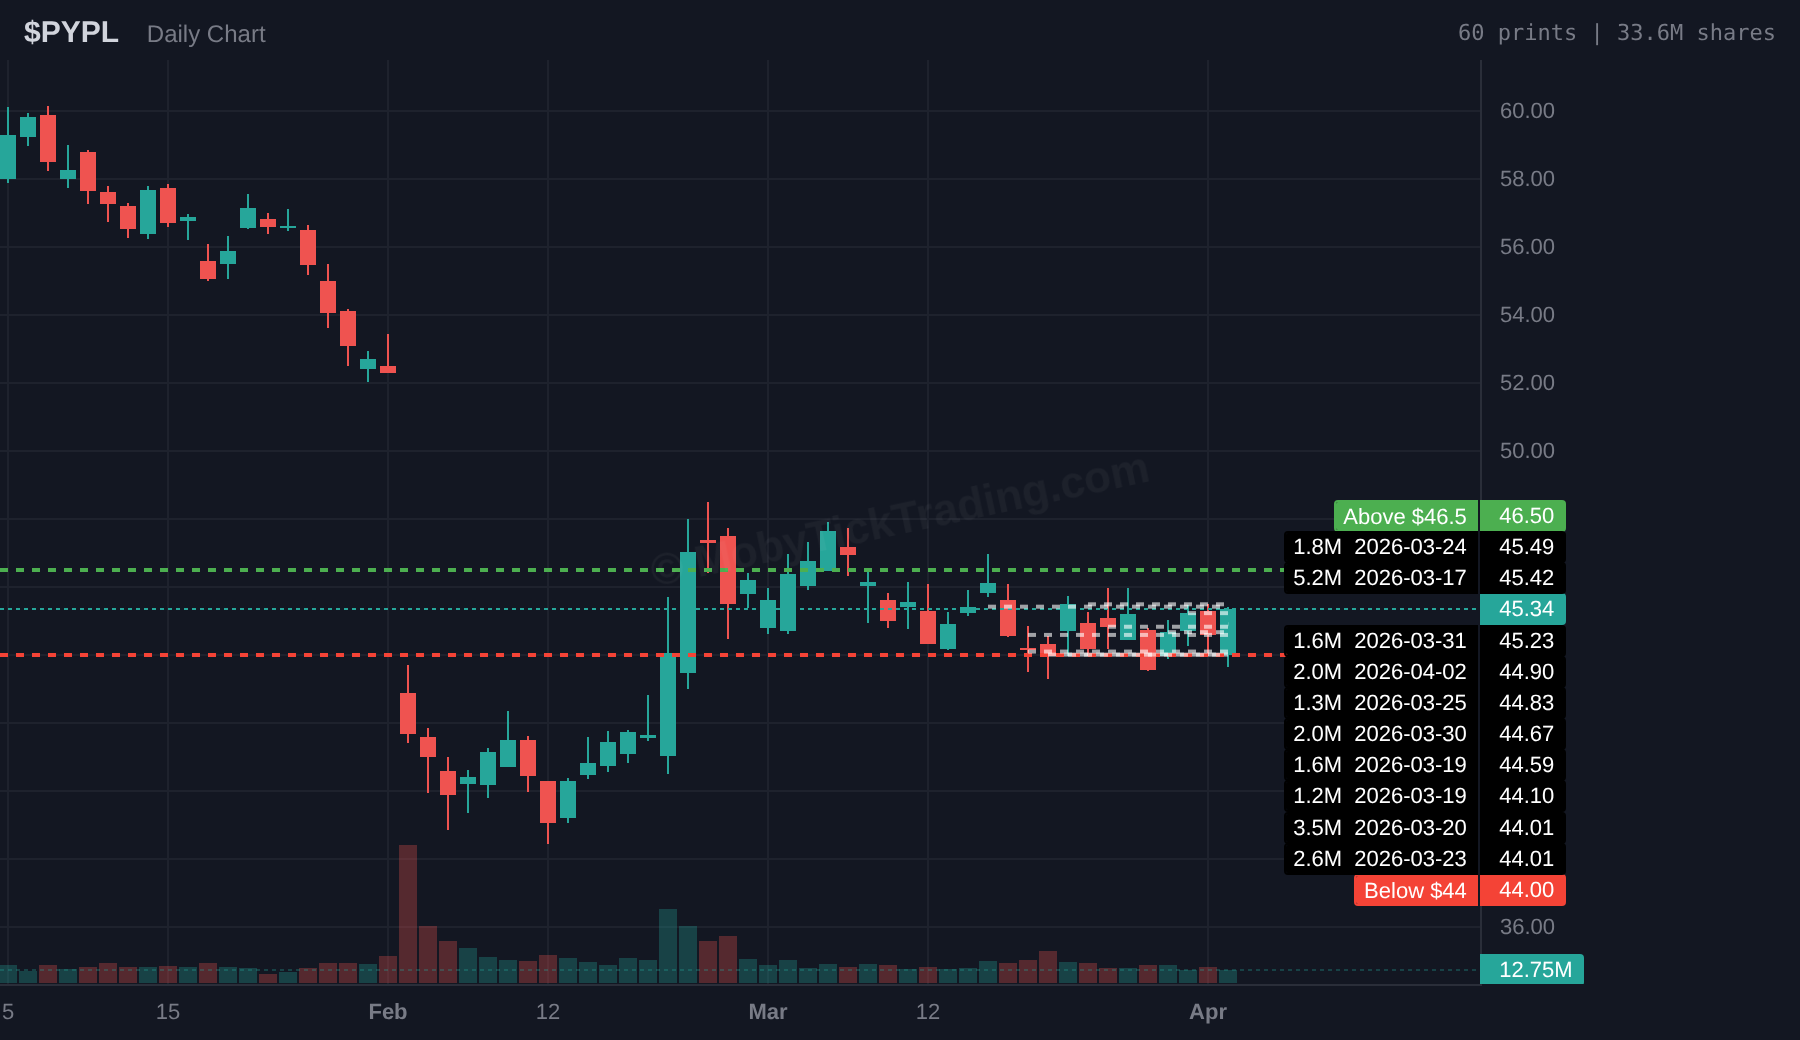
One of the most consistent dark pool accumulation stories over 90 days. Multiple 1M+ prints every two weeks, all clustering at $40-47. The Apr 2 print at $44.90 is verified $0.44 below close.
▲ Bullish above $46.50 → Targets: $47.50, 50, 51.25, 52.50, 55
▼ Bearish below $44 → Targets: $43, 42, 41, 40, 37.50, 35
One of the most powerful uses of dark pool data is identifying sector rotation before it becomes obvious in price charts. This week’s data provides a textbook case study.
When institutional investors reposition across sectors, they do so quietly in dark pools — often days or weeks before the price action confirms the rotation. By tracking which sector ETFs receive the most and least dark pool flow, you can get a forward-looking view of how the smart money is positioning.
This week, the data was unambiguous: XLP (Consumer Staples) received $1.14 billion in dark pool prints while XLY (Consumer Discretionary) received only $151 million. That’s a 7.5:1 split in favor of defensive consumer names.
What does this tell us? Institutions are not confident in consumer spending resilience at current oil prices and with ongoing tariff headwinds. They are hedging into staples which are less sensitive to economic cycles.
How to use this: Compare sector dark pool flow across weeks. A sector consistently in the top 3 over 4+ weeks is likely in an accumulation phase. A sector consistently at the bottom is likely being distributed. When you see a sudden spike in a sector that was previously quiet, it often signals an institutional thesis change.
Moby Tick tracks dark pool prints across all 11 S&P 500 sectors, giving retail traders the same institutional positioning data that was previously only available to hedge funds and prop desks.
Stop guessing. Start tracking where the smart money is. → Get Moby Tick
Dark pool prints represent off-exchange trade reports filed with FINRA. Moby Tick aggregates and analyzes this data for informational purposes only. This report is for educational use. It is not financial advice. All investments involve risk. Past performance does not guarantee future results.
Data sources: Moby Tick Dark Pool API, FINRA Trade Reporting Facility. All prices as of market close April 2, 2026 unless otherwise noted. Copyright 2026 Moby Tick Trading LLC.