Physical Address
304 North Cardinal St.
Dorchester Center, MA 02124
Physical Address
304 North Cardinal St.
Dorchester Center, MA 02124
A comprehensive guide to understanding dark pool data, the counter-intuitive "splash" pattern, and how institutional block trades create actionable levels in the market.
TL;DR: Dark pools execute ~40% of US equity volume—but the data is delayed, fragmented, and often misunderstood. This tutorial explains what dark pool data actually shows, how to interpret the “splash” (large prints and their market impact), and the counter-intuitive patterns that reveal true institutional intent.
Dark pools are private trading venues that don’t display orders to the public before execution. They were originally designed for institutional investors—pension funds, hedge funds, mutual funds—to execute large orders without alerting the market and causing price slippage.
When a mutual fund wants to buy 5 million shares of Apple, they can’t just hit the “buy” button. That order would send prices soaring before they finished filling it. Dark pools allow them to match large orders privately, away from public exchanges, keeping their intentions hidden.
Today, roughly 50+ dark pools operate in the US, handling approximately 40% of all equity trading volume. These include:
The key characteristic: no pre-trade transparency. Orders aren’t displayed in an order book. They match internally or route to other venues after execution. This opacity is the entire point—institutions need privacy to execute without moving the market against themselves.
Dark pool “prints” are reported trades that have already executed. By law, these must be reported to the consolidated tape (the same feed that shows NYSE and NASDAQ trades), but they can be reported with delays ranging from milliseconds to hours.
Each print contains:
Important: Dark pool data does NOT tell you:
This is crucial: you’re seeing a snapshot of what happened, not a crystal ball of what’s coming. The value lies in understanding patterns and context.
The “splash” is a term we use at Moby Tick to describe the visible market impact of large dark pool prints. When a massive block trades in a dark pool, it’s like dropping a stone in water—the initial splash is the print, and the ripples are the subsequent price action.
But here’s where most traders get it wrong: the splash doesn’t always move in the “obvious” direction.
One of the most valuable insights from tracking dark pool data is recognizing that institutions often move the price opposite to their true direction before executing their main position.
Here’s why this happens:
This is why multiple prints at the same level are so significant. They tell you where institutional activity clustered—not where price is necessarily going next.
A single print is interesting. Multiple prints at similar prices are actionable.
When you see 3, 5, or 10 large prints all clustered within a narrow price range, that’s not coincidence. That’s an institution (or multiple institutions) establishing a significant position. The price level becomes an “institutional wall” or “floor”—a zone where large capital has committed.
Here’s what typically happens after a multi-print cluster:
The “opposite move” phase is where most retail traders get trapped. They see price moving away from the print level and assume the prints were wrong or irrelevant. But the smart money knows: the prints mark the level that matters, not the immediate direction.
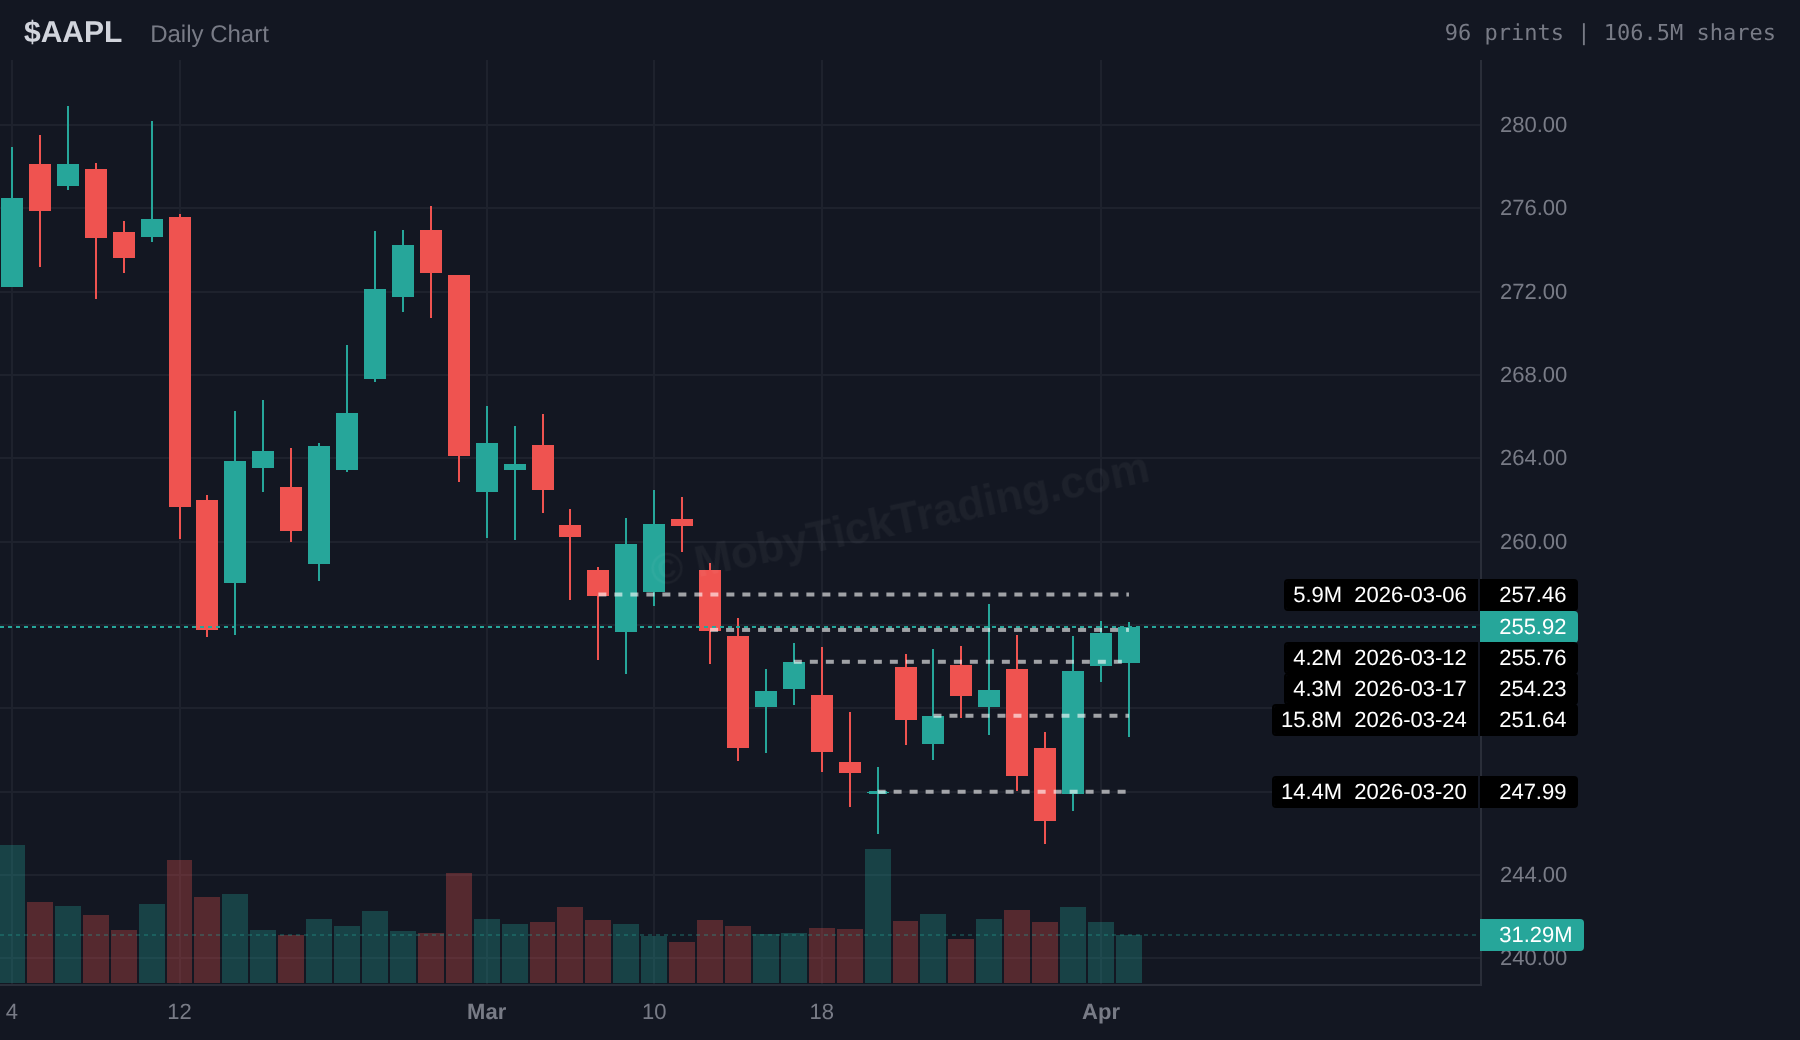
AAPL 60-day chart showing dark pool prints. Note the $251.64 level where 15.8M shares traded—this became a reference point for subsequent price action.
Institutional accumulation doesn’t look like retail buying. A retail trader buys 100 shares and hopes price goes up. An institution accumulating 5 million shares needs to hide their tracks.
Accumulation patterns to watch:
Key insight: Accumulation prints are often followed by price weakness, not strength. The institution wants to buy more at better prices. The opposite move serves their interest.
Distribution is the opposite of accumulation—and often harder to spot. Institutions don’t announce they’re selling. They use dark pools precisely to avoid tipping their hand.
Distribution patterns to watch:
Key insight: Distribution prints are often followed by price strength, not weakness. The institution wants to sell into strength. The opposite move (continued rally) serves their interest by attracting buyers.
A 1-million-share print sounds enormous—unless you’re looking at Apple, which trades 50+ million shares daily. A better question: What percentage of average daily volume does this print represent?
We classify prints by their volume ratio:
| Classification | Volume Ratio | Significance |
|---|---|---|
| Notable | 5-10% of ADV30 | Worth watching |
| Interesting | 10-20% of ADV30 | Potentially significant |
| Juicy | 20-50% of ADV30 | Strong signal |
| Massive | 50%+ of ADV30 | Major institutional activity |
ADV30 = 30-day average daily volume. A “juicy” print in a small-cap stock might be 500K shares. A “massive” print in SPY might be 10+ million shares.
Volume ratio matters because it tells you how unusual this print is for this specific stock. A 2-million-share print in NVDA (which trades 40M+ daily) is “interesting.” The same 2-million-share print in a mid-cap that trades 3M daily is “massive.”
Reality: Every trade has a buyer and seller. A large print shows that two parties agreed to transact—we don’t know which side initiated. What we do know is that significant capital changed hands at a specific price. That price level becomes relevant regardless of who initiated.
Reality: Dark pools are legal, regulated trading venues. They serve a legitimate purpose: allowing institutions to execute large orders without excessive market impact. The opacity is the feature, not a bug. However, the strategies institutions use within dark pools—like pushing price opposite to their true intent—can feel manipulative to retail traders who don’t understand the game.
Reality: By the time you see a print, it has already executed. You’re seeing the past, not the future. However, you can use prints to identify price levels that institutions may defend or target. The edge isn’t in front-running—it’s in recognizing levels before the rest of the market.
Reality: This is the trap. Prints at highs often indicate distribution, not continuation. The price may continue higher briefly (the opposite move), but the prints are marking the zone where institutional capital is exiting. Wait for the retest before drawing conclusions.
Some dark pool trades are reported late—sometimes hours after execution. These “late prints” can be misleading if taken as real-time signals.
A print reported at 2 PM might have actually executed at 10 AM. If price has already moved significantly since the actual execution, the print might appear at a “wrong” price level—making it look like the institution was wrong when they were actually right.
At Moby Tick, we clearly mark late prints and show execution timestamps when available. Always check whether a print is real-time or delayed before making trading decisions.
Let’s say you’re watching a stock that’s been in a downtrend. It hits a 52-week low, and over the next week, you see 5 large dark pool prints all between $45.00 and $46.00. The stock currently trades at $44.50.
Here’s how to interpret this:
The retail trader sees a stock making new lows and assumes it’s doomed. The dark pool data tells a different story: institutions are accumulating. The question isn’t whether to buy—it’s when. And the answer is: when price reclaims the print level.
Ready to see what institutions are doing? Start your free trial and get access to real-time dark pool data, institutional levels, and the weekly dark pool report.